LinkedIn thought leader ad examples
49 thought leader ads are live on LinkedIn right now, from 94 companies. Browse real ones, filtered by industry.
- DCA Market IntelligenceSince 24 Oct 2026
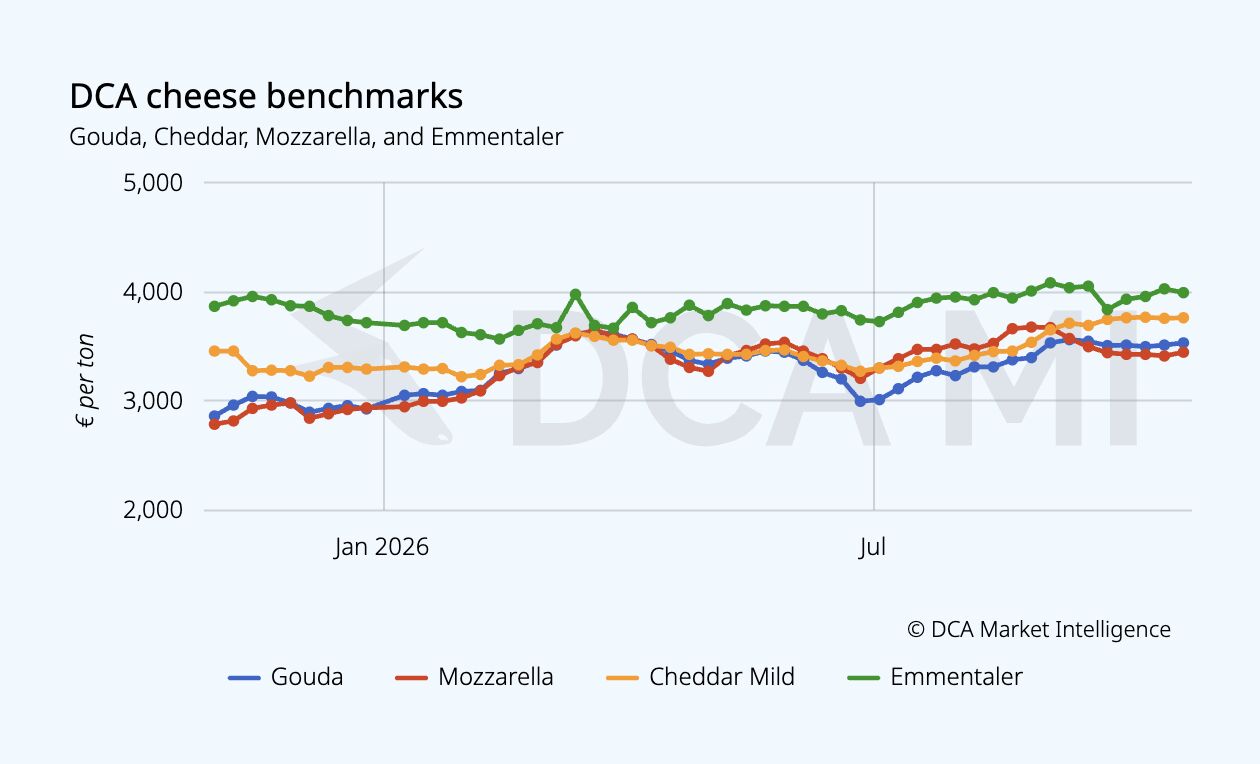
𝗘𝘂𝗿𝗼𝗽𝗲 𝗶𝘀 𝗲𝘅𝗽𝗼𝗿𝘁𝗶𝗻𝗴 𝗺𝗼𝗿𝗲 𝗰𝗵𝗲𝗲𝘀𝗲, 𝗯𝘂𝘁 𝗿𝗲𝘃𝗲𝗻𝘂𝗲 𝗱𝗼𝗲𝘀 𝗻𝗼𝘁 𝗳𝗼𝗹𝗹𝗼𝘄 EU cheese exports increased by 6.5% year-on-year through August, while export value declined by 1.5%. At the same time, European cheese production increased by 3.6% through July. In fact, 57.6% of the additional milk produced in the EU was allocated to cheese production. So where is all that extra cheese going? International demand is absorbing a good part of it, but the picture differs considerably between Gouda, Mozzarella, Cheddar and Emmentaler. Read the full DCA Market Intelligence analysis for the latest cheese benchmarks, production figures and trade developments: https://lnkd.in/eMGz6m6G #DairyMarkets #CheeseMarket #DairyTrade #CheeseExports #DairyBenchmarks #DCAMarketIntelligence
- Icon MapSince 21 Oct 2026
Icon Map for Fabric isn't just a map - it enables you to build interactive, spatially driven dashboards with charts, tables and slicers. Alongside your map layers, you may need to bring in additional tables to show trends, summarize performance, or provide more details about individual assets. The relationship editor gives you a visual representation of how everything connects - not only your data tables, but also your map layers, charts and slicers. This makes it easy to understand how selections and filters flow across the dashboard, helping you build richer, more intuitive geospatial experiences. Sign up to for the private preview here: https://lnkd.in/ecpnG2nU #MicrosoftFabric #PowerBI #Geospatial #DataVisualization #LocationIntelligence #IconMapForFabric
- Icon MapSince 21 Oct 2026
Sometimes the details on your map matter and you need to get up close. Icon Map for Microsoft Fabric enables you to surface Gaussian Splats (eg 3D models made from drone imagery) stored in your Onelake lakehouse. Just one of many new capabilities. Sign up for the private preview here: https://lnkd.in/ejhtbghC #IconMap #IconMapForFabric #MapsInFabric #MicrosoftFabric #Maps #GeospatialAnalytics Attribution: Satellite imagery - Mapbox. Gaussian Spat - https://lnkd.in/eV5ZpV-q
- OmniSince 20 Oct 2026
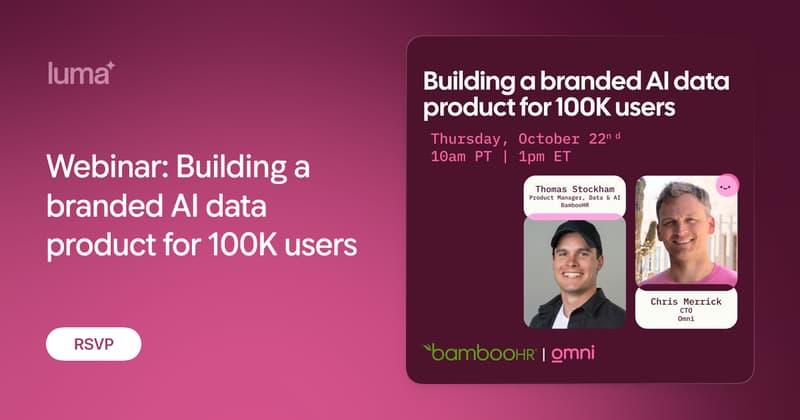
This Thursday I'm joining Chris Merrick (CTO, Omni) to talk about how BambooHR went from decision to GA on Elite Analytics, our branded AI data product, in four months, and has since grown it to 100K users. Chris and the Omni team have been amazing partners. Come hear what worked, what we learned, and how we did it without pulling engineering off our core roadmap. 📅 Thursday, Oct 22 · 10am PT / 1pm ET 🔗 Register: https://luma.com/94qpxqrs
- OmniSince 19 Oct 2026
Users want to build in Claude. It’s fast, it looks great, and it’s where the rest of their work already happens. Data teams want to know it’s right - or at least that the answer is interpretable, correctable, and defensible when an exec inevitably asks “how did we get this number?” Good news: you can have both. Tell Claude what you’re trying to build, and it builds an Omni app right there in the conversation - live data you can touch, explore, and filter. Every app comes with a link back to Omni, so it’s: → Shareable instantly → Governed - revenue means the same thing it means on every dashboard, and each viewer only sees what their permissions allow → Interpretable - your data team can open it, inspect how it was built, and fix it → Always current - it updates automatically when the semantic model changes Build where you work. Trust what you build.
- Cambridge IntelligenceSince 15 Oct 2026
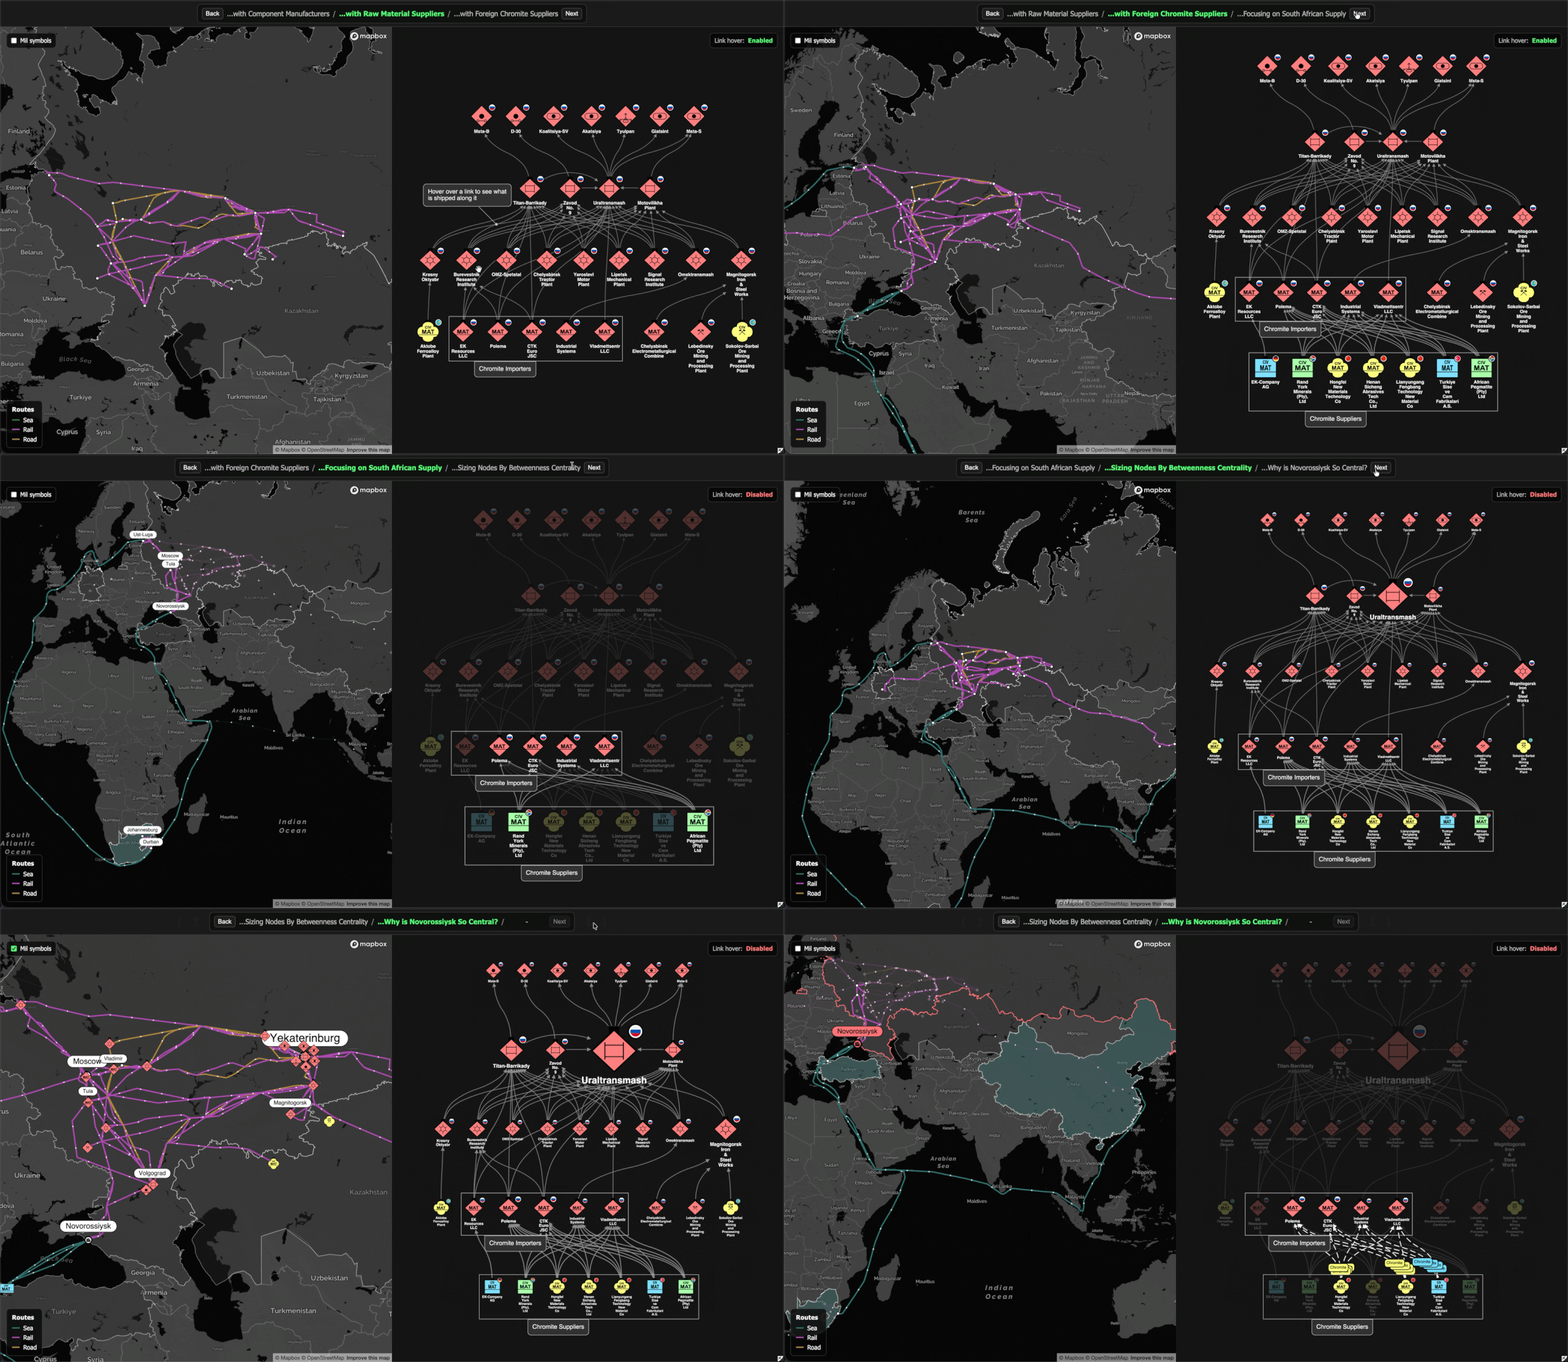
Graphs on maps just got real... Abstract graphs help you understand connectivity, bottlenecks and the importance of nodes in a network. But links in the real world aren't as simple as that. They follow train routes, or coastlines; they pass through real world geographic pinch points and conflict zones. MapWeave 1.9 is out, with a new hybrid approach. Treat a graph as an abstract concept for analysis, but give it real world path routing to understand the true geospatial meaning of those links and flows in your data. More examples at https://lnkd.in/ejQMT-_4
- Cambridge IntelligenceSince 15 Oct 2026
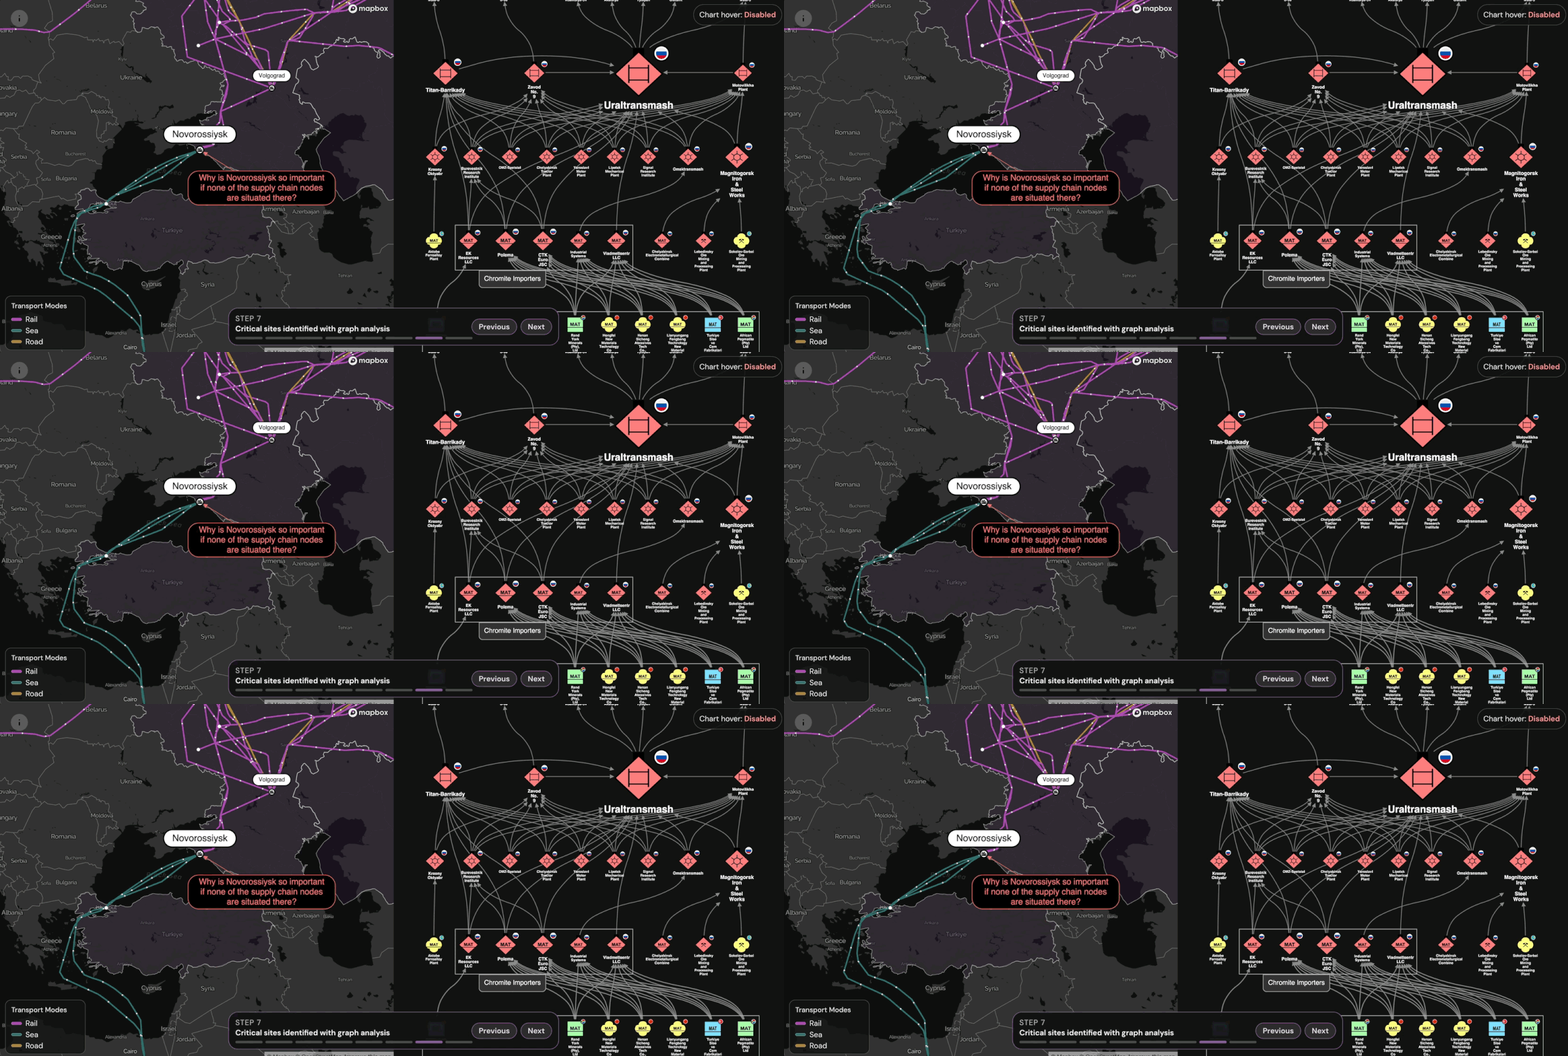
Who doesn't love a sneak preview? :) Last year, I built a little visualisation of the russian artillery supply chain based on RUSI's "Ore to Ordnance" paper and we published a blog on it back in December (can't believe that's 4 months ago - WTF?!). But basically since I built it, it bothered me... It received great feedback for the graph network visualisation part, and for the bit where you could see the potential impact of a typhoon on the map (I'll pop a link to the blog in the chat if you didn't see it before). But the rest of the geospatial visualisation didn't really add more value - it kind of just showed the same thing as the chart... So I've been working on a new version (in the gif) which is all about why its valuable to have complementary graph AND geospatial visualisations for supply chain applications, especially for assessing centrality, risk and impact of disruptions (Strait of Hormuz anyone?). More on this soon but hope you enjoy the gif for now :)
- DataboxSince 15 Oct 2026
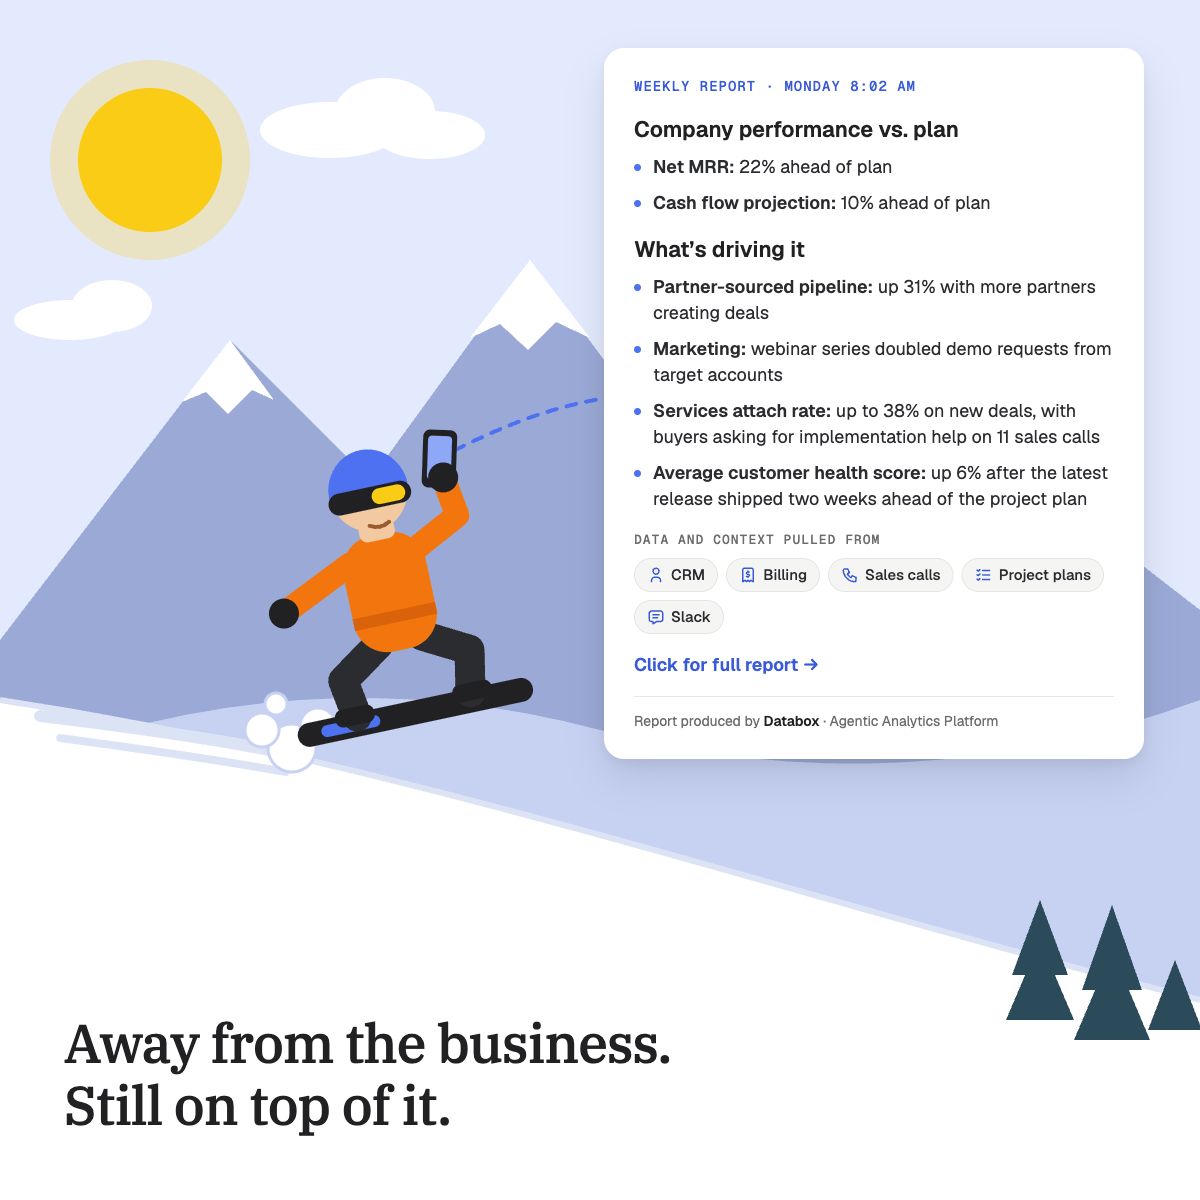
If I were the CEO of a mid-sized company and wanted to step away from the week-to-week running of the business without losing track of anything, I'd snap my fingers and build an operating system that does three things for me: ✅ A weekly brief showing how every team is tracking against plan and why, drawing on what was said in sales calls and Slack along with the numbers. ✅ An alert the moment something drifts off course, with the likely cause already diagnosed before anyone has to escalate it. ✅ An answer to any question I have about the business, grounded in both the data and the context, without pulling anyone into a meeting. This is how I'd build it, with each step depending on the one before it: 1️⃣ Get full visibility: connect every data source across the business, from the CRM and finance system to marketing, product and support, and pull in the context behind the numbers, including documented processes, sales call and meeting transcripts, Slack and project management. 2️⃣ Make everything measurable: build a semantic layer so every metric means the same thing to everyone and can be traced back to its source, define the metrics that matter for every team, and cascade goals down the entire org so every team and person has a number that ladders up to the company's. 3️⃣ Build a prediction model: map how those metrics drive each other, so anyone on the team can see which levers move revenue and profit and test how a change would affect them before making it. 4️⃣ Run autonomously: build skills that analyze every part of the business against its goals using both the numbers and the context, and run them on a schedule so the analysis happens every week on its own, with alerts that fire the moment something drifts. Execute as many activities as possible with AI that either initiates or facilitates work for the team, or does it completely autonomously. Oh wait, I don't need to snap my fingers. Everything on this list can already be built in Databox. Seriously, though. This is the operating system we've built to run Databox for 2027. Our software does all of this, and anyone can try it, for free, I might add: https://databox.com/signup But we're also rolling up our sleeves to help up to 10 companies build it, hands-on, pulling in our own people from across the business through our custom services (databox.com/services) and specialized partners, when needed. The 1st of 10 signed on this week. If it's something you want for your company, you know how to reach me. ⬇️ ⬇️ ⬇️
- GreybeamRecorded 16 Oct 2026
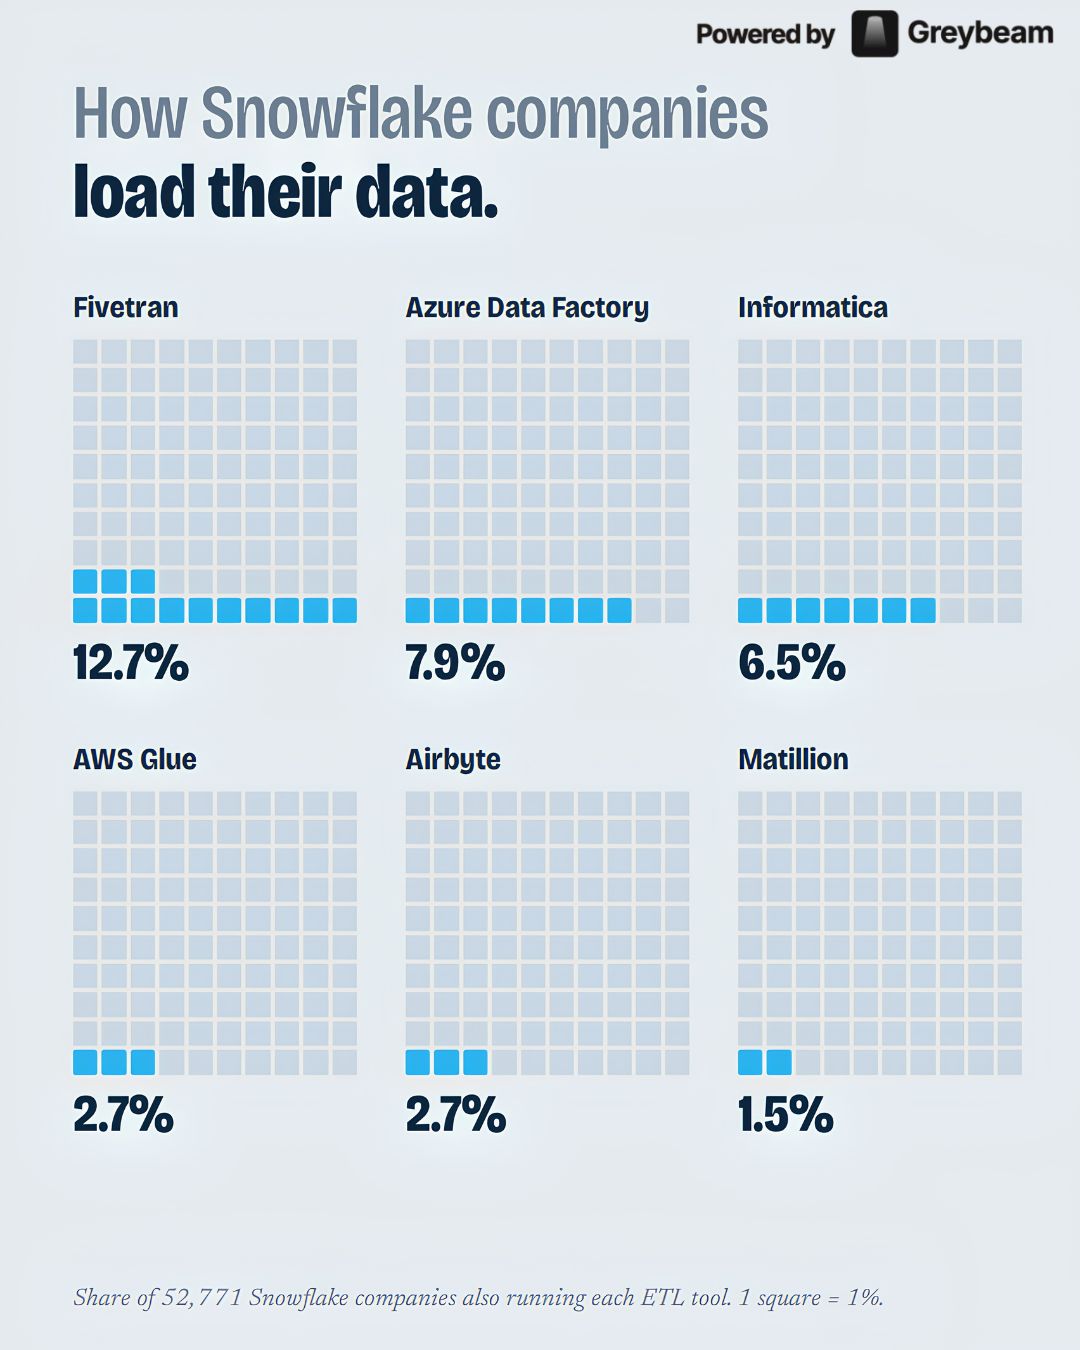
We looked at how 52,771 Snowflake companies get data into Snowflake. → 12.7% run Fivetran → 7.9% run Azure Data Factory → 6.5% run Informatica → 2.7% run AWS Glue → 2.7% run Airbyte → 1.5% run Matillion Very surprised to not see folks like Estuary or Streamkap up there! Source: Crustdata (YC F24)
- GreybeamRecorded 16 Oct 2026
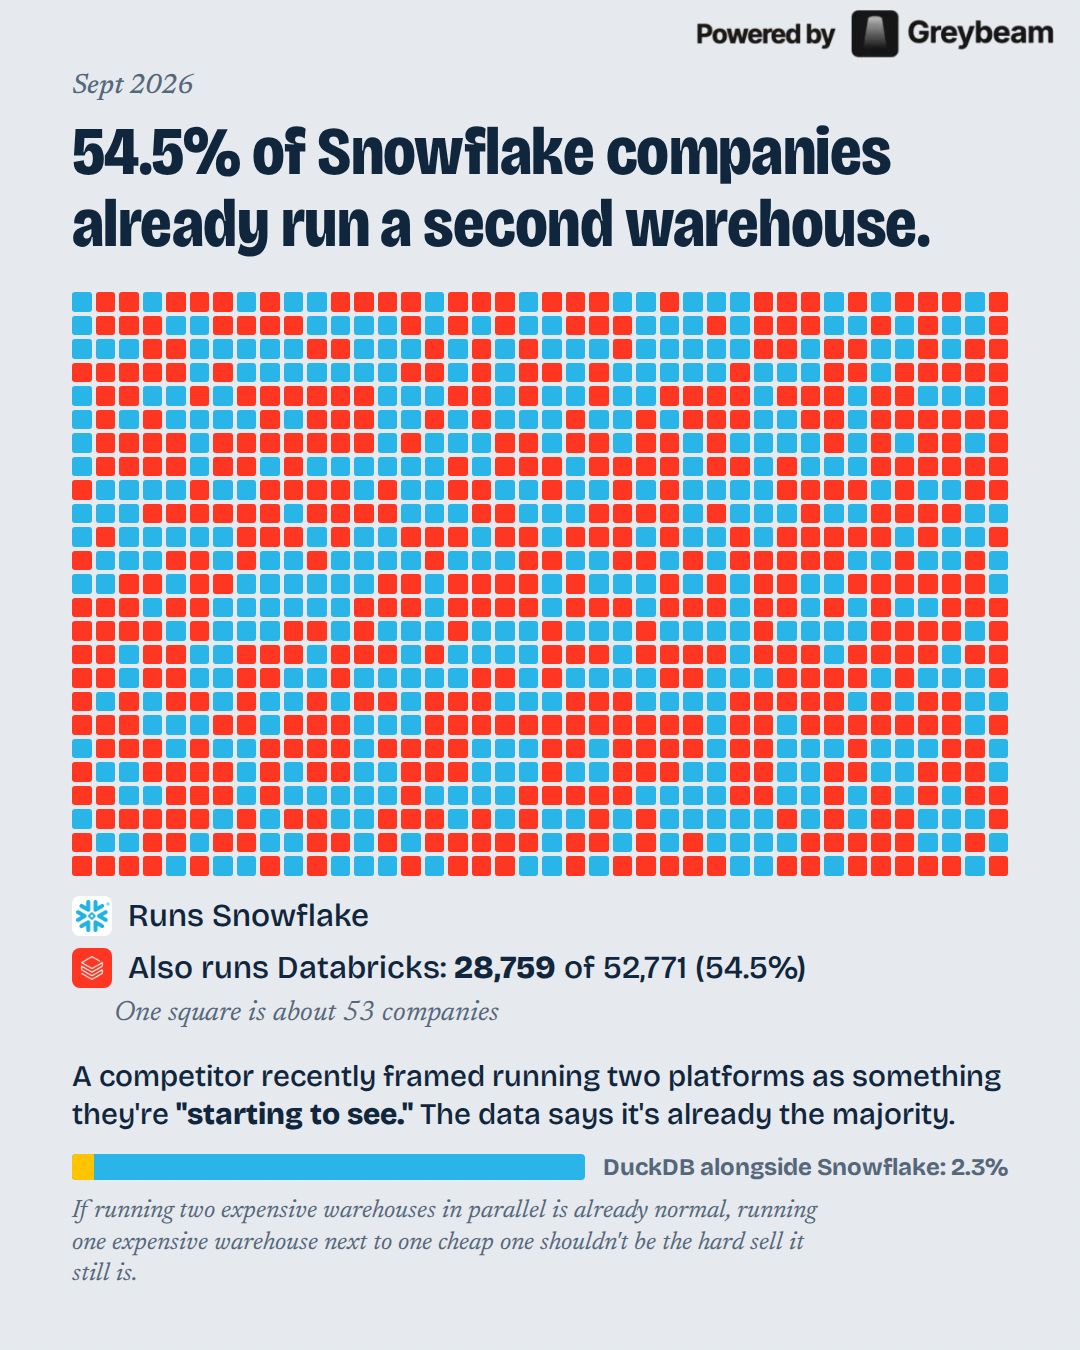
We've normalized running two expensive warehouses before we've normalized running one expensive warehouse and one cheap one. 54.5% of Snowflake companies also use Databricks. Just 2.3% use DuckDB alongside Snowflake. So the barrier clearly isn’t “we don’t want another execution engine.” The interesting question is why it’s still unusual to route the right workloads somewhere dramatically cheaper. Source: Crustdata (YC F24)
- Coupler.ioSince 13 Oct 2026
“Where did this number come from?" That question ends most agency AI reporting demos. The model got raw tables and nothing else: no client KPIs, no definition of a lead, no note that half the campaigns were paused months ago. So it fills the gaps with answers that leave a lot to be desired, and the analyst on the call has no way to trace them. On October 22, Veronika Tamaio Flores and I are running a free session on the layer between raw data and an answer you can defend. We call it AI Business Context, and most setups skip it. We'll show where AI reporting still breaks for multi-client agencies, and how Coupler.io clients rebuilt theirs so the model works from definitions instead of guesses. When will this go down? Thursday, Oct 22, 2026 | 6:00 PM GMT+2 Register for the free session here: https://lnkd.in/emsCgjdp
- definitySince 13 Oct 2026
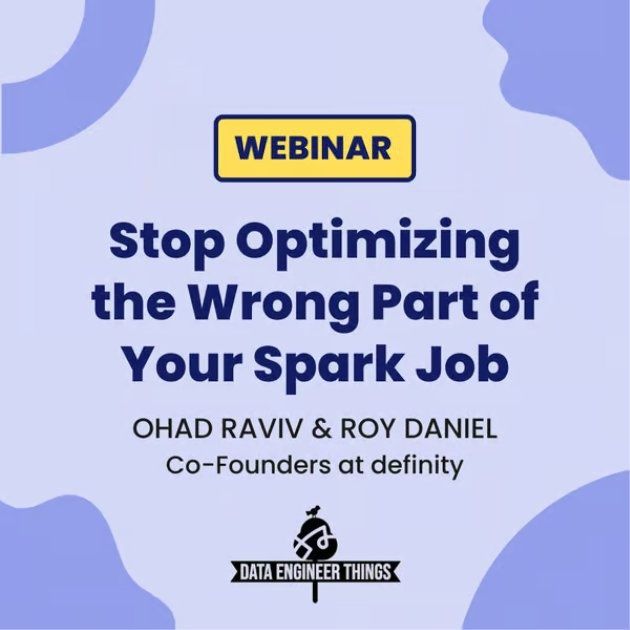
Most Spark waste isn't simply “hard to fix”. 𝗜𝘁'𝘀 𝗵𝗮𝗿𝗱 𝘁𝗼 𝘀𝗲𝗲. ⠀ The signals that can expose it are often not monitored, and rarely live in one place. ⠀ These native signals – e.g. runtime executor vs machine shape, query-level skewed keys, S3 calls in idle-time, and operator-level input vs output rows – are hard to extract. Some don’t exist natively. Others are gone once the job completes. Most are never collected. ⠀⠀ In our webinar with Data Engineer Things, Ohad Raviv and I walk through the signals that matter at each layer of the Spark stack and how to collect them, sharing specific cases from our own experience. ⠀ Join here - https://lnkd.in/g4_WqcF8
- FlashGridSince 12 Oct 2026
The current set of Oracle MAA blueprints is lacking the Multi-AZ clustering architecture. This is not surprising. The concept of Availability Zones did not exist in the traditional on-premises architectures, while Oracle Cloud (and by extension the Oracle Database @ AWS/Azure/Google Cloud offerings) do not have the capability for Multi-AZ clustering. On the other hand, competing solutions, such as Amazon Aurora, leverage Multi-AZ database clustering to its fullest (even though they lack the unique active-active clustering capabilities that Oracle RAC boasts). In this article we compare the Multi-AZ clustering architecture to other architectures and will discuss its unique benefits specifically for Oracle databases on AWS, Azure, and Google Clouds. #oracledatabase #oraclemaa #oraclerac #oraclecloud #aws #azure #googlecloud
- InfodeskSince 10 Oct 2026
Most organizations don’t have an information problem anymore. They have a decision problem. There’s no shortage of dashboards, alerts, reports, summaries, feeds, or AI-generated outputs inside regulated industries today. In fact, most teams are overwhelmed by the volume of information coming at them. But information alone doesn’t create value. Decisions do. And that’s where I think the conversation around “decision intelligence” becomes important, especially in life sciences and regulated environments. Because in these industries, the challenge isn’t simply identifying a regulatory signal or detecting a market change. The real challenge is: ➡️ understanding what it means ➡️ determining who is impacted ➡️ coordinating the right response ➡️ documenting decisions clearly and defensibly ➡️ ensuring actions happen That’s a very different capability than monitoring. What’s becoming increasingly clear is that organizations need systems designed not just to surface intelligence, but to operationalize it. That’s the shift from information management → decision intelligence. And in practice, the companies doing this well tend to focus on a few things: 1️⃣ Connecting intelligence directly to workflows: The most mature organizations are embedding intelligence into operational processes instead of leaving it trapped inside dashboards or inboxes. 2️⃣ Maintaining traceability from signal to action: In regulated industries, every major decision may eventually need to be explained, audited, or defended. Traceability matters. 3️⃣ Combining AI with human expertise: AI can dramatically reduce the manual burden of monitoring, summarization, categorization, and search. But human expertise remains critical for interpretation, prioritization, and accountability. The strongest models aren’t AI-only. They’re human-first systems enhanced by AI. 4️⃣ Creating organizational alignment: Decision intelligence is ultimately about helping teams move faster together, regulatory, quality, safety, compliance, operations, leadership, all working from shared context and trusted information. That alignment is becoming a competitive advantage. One point I think is often overlooked: The future of AI in regulated industries probably won’t belong to generic copilots alone. It will belong to organizations that successfully integrate trusted intelligence, governance, workflows, and human judgment into a repeatable operational system. That’s where a measurable impact starts to happen. We recently explored this topic in more detail, including how decision intelligence is evolving across pharma and life sciences: https://lnkd.in/egXtZ2Eq Curious how others are thinking about this shift. Are you seeing organizations move beyond monitoring toward true intelligence activation and decision support? Or are most teams still stuck at the “information overload” stage?
- QlikSince 8 Oct 2026
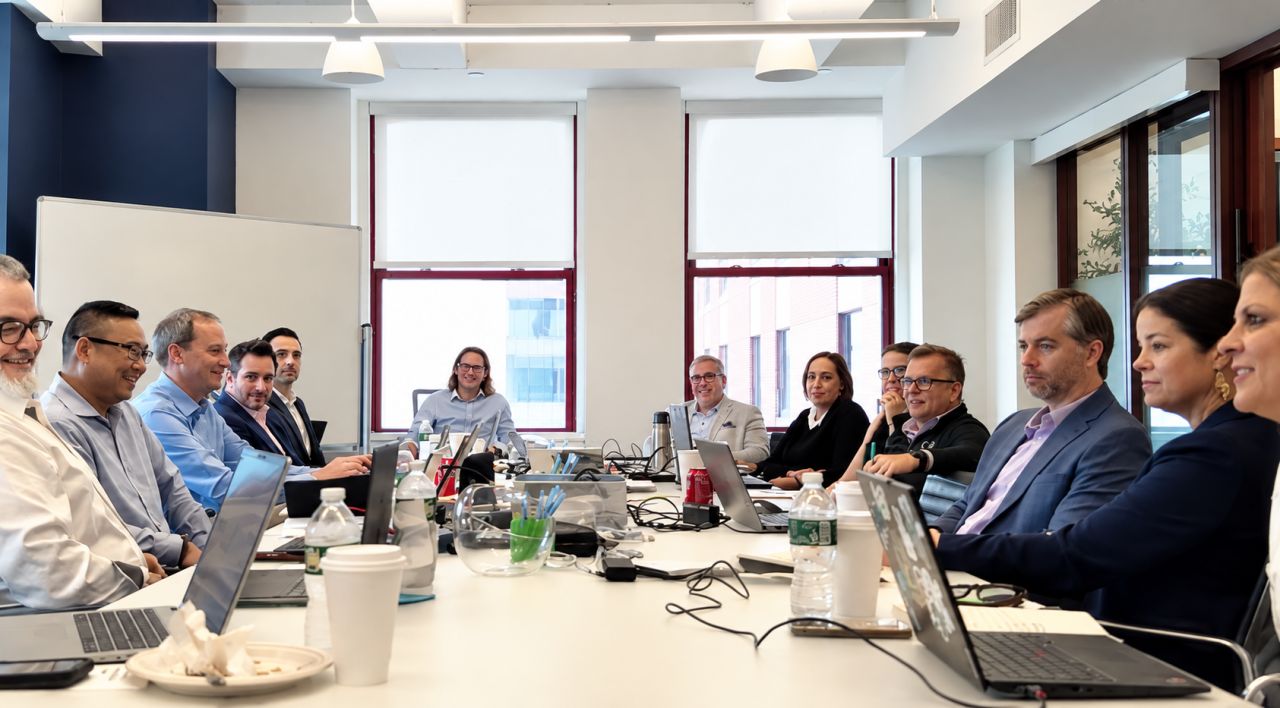
A few weeks ago I spent a full day in New York with the team from Trace3, Qlik's New Partner of the Year, talking through what the next 12 months of this partnership look like. We had a simple goal for our day together: to leave the room with our top three strategic objectives and a plan to action them. It might come as no surprise that AI readiness made it onto the list, including dynamic technologies like Iceberg and Open Lakehouse. Helping customers figure out how ready (or not) their data management, governance, and preparation are for AI projects is a critical first step. So with Trace3, we're now making sure that's part of the conversation from day one instead of an extra step later on. I really liked the way one of the Trace3 leaders summed up their role: "Our customers pay us to be agnostic, but to have an opinion." That's the responsibility of a good partner. With their data and analytics practice growing 100% year over year (wow!), it seems we're not the only ones who think they're great to work with. Special thanks to Susie LeMay for playing host and expertly guiding the discussion, Hayden Ng for leading from the Qlik side, and Asher Lohman, Scott MacConnell, Kevin Rogers, and Frank Matteson at Trace3 for being such a pleasure to work with. Looking forward to all of the great things to come!
- Inphinity ∞Since 8 Oct 2026
A simple thing with great value - comments on reports. And it is almost "plug-and-play". This is something every company needs: add context to numbers and explain what happened, why, etc.. If you want this in your #Qlik Apps, message me and our team will be happy to help you set it up in a short call. And if you wonder if it costs something: you can start at no cost with a freemium license of Inphinity ∞ to prove it adds value to your team. But much more is possible, so bring us your problem and we'll find a solution. #analytics
- Inphinity ∞Since 7 Oct 2026
Inphinity Forms 19.0 brings major updates! ✅ 𝗔𝘂𝘁𝗼𝗺𝗮𝘁𝗶𝗰 𝘁𝗿𝗮𝗻𝘀𝗹𝗮𝘁𝗶𝗼𝗻𝘀 into German, Czech, Slovak, Russian and Ukrainian based on Qlik Cloud or browser settings - let us know which language you’d like us to support next! ✅ Enhanced real-time 𝗰𝗼𝗹𝗹𝗮𝗯𝗼𝗿𝗮𝘁𝗶𝗼𝗻 𝗶𝗻 𝗙𝗼𝗿𝗺𝘀 𝗣𝗹𝗮𝗻𝗻𝗶𝗻𝗴, locking only the part of the form affected by a modification ✅ 𝗦𝗺𝗼𝗼𝘁𝗵 𝘀𝗰𝗿𝗼𝗹𝗹𝗶𝗻𝗴 within large Forms Planning objects As always, the what's new blog post is here: https://lnkd.in/gUM_HzGP and you can find the full changelog in the documentation. It’s time to upgrade, don't you think? 😉
- ArovySince 10 Oct 2026
AI will never ask your Salesforce admin/ops team which revenue field to choose (and you do have many:)!) It doesn't know or care someone with this tribal knowledge exists... Dadrian Eason Result: fast, but inaccurate answers -> lack of trust in ai/agents -> bad outcomes OR failed initiatives Starting at the foundation with Arovy's accurate context is key #forwardfacingfriday
- Altinity, Inc.Since 6 Oct 2026
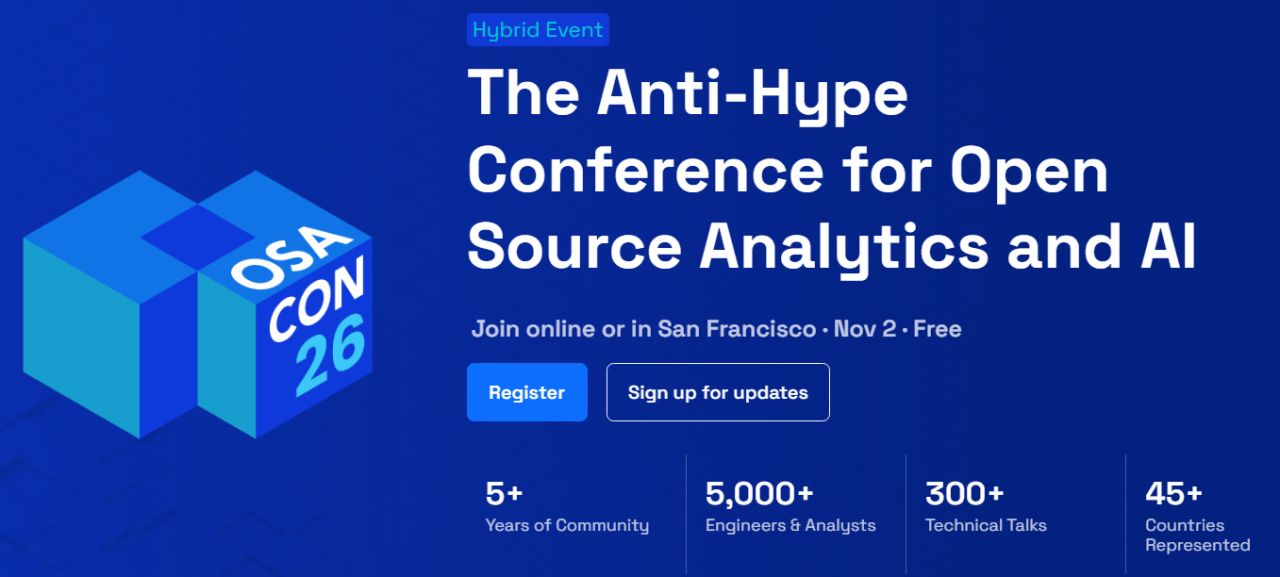
Tired of single-product vendor conferences? They're boring! 6 years ago I came up with an alternative: OSA Con. https://osacon.io. It's anti-hype, practical, and intellectually diverse, with speakers on open source, AI, and analytics. And we invite you to join us on November 2nd for our first in-person conference at the AWS Loft in Downtown San Francisco. There will be 20 awesome talks from awesome engineers at Firebolt, Databricks, IBM, Gamebeast, Grafana Labs, Dremio, Salesforce, Loophole Labs and many others. We have two tracks across the entire day with plenty of time to network and have great hallway conversations. Did I mention that it's free? Can't make it to San Francisco? No problem! The conference is streamed as well. I'll be introducing our speakers over the next few days. Don't wait, though. Tickets are going fast. Sign up today! We'll see you at OSA Con! p.s., Huge thanks to Amazon Web Services (AWS) for the space to run the conference. Y'all are awesome. #OSACon #opensource #ai #lakehouse #databases #cloud
- Altinity, Inc.Since 6 Oct 2026
Built-in separation of storage and compute is a key feature of every modern analytic database...Except for open source ClickHouse®. We are changing this today. I'm delighted to announce that Altinity, Inc. Antalya 26.6 builds now offer experimental Content-Addressable Storage (CAS) for MergeTree tables. With a simple configuration change, users can place MergeTree data on shared object storage. The door is open to even faster and more cost-efficient insight on large data sets. There's no lock-in: CAS is 100% open source. Our CTO Alexander Zaitsev has written a blog about the innovative design behind CAS and how to enable it yourself. https://lnkd.in/eaMUz3is. Altinity customers are already lining up to try it. CAS is still experimental. It passes our internal tests--which are extensive. What we need now is feedback on real world systems. We invite you to install Antalya and give us feedback. Our plan is to release a GA version of CAS by the end of 2026. It will join a host of Antalya features like OAuth/OIDC integration, swarm servers, plus high-performance export to and query from Iceberg data lakes. We're building the open source foundation for the fastest, most cost-efficient analytics on the planet. Help us get there. Try out CAS today! #opensource #realtime #analytics #antalya #clickhouse
- DataboxSince 8 Oct 2026
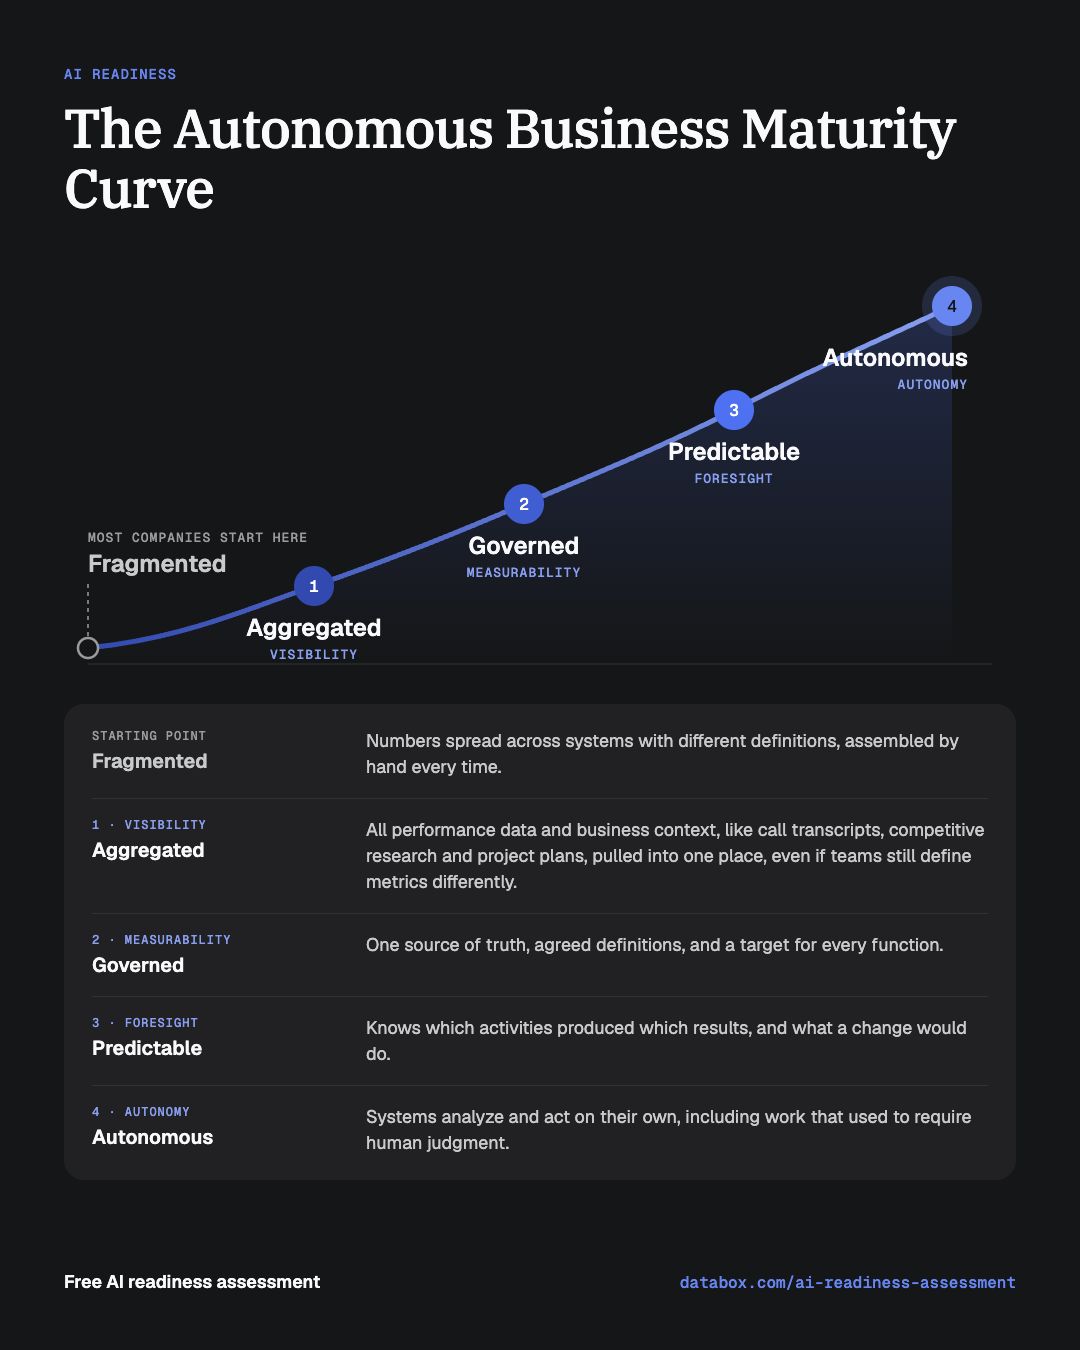
AI is the most hyped technology of my 30+ year career, but I think it's significantly under-hyped when it comes to how drastically it'll transform the way businesses run. Most companies are still just using AI as an assistant that helps them write messages, summarize meetings, build a chart, etc. The bigger impact comes when AI starts making business decisions. I have gotten a lot of pushback when i've said this before, and it usually sounds like "judgment should remain with humans." But AI is faster and its memory is greater than the sum of an entire team's. And with the right system, AI can make even complex decisions, while humans focus on the ones that need them (and system design.) I'm seeing this happen in startups & smaller tech firms now. A startup building on AI from day one doesn't carry the baggage of how things have always been done. But, in nearly every market, I think someone will eventually get to 10x the output at 1/2 the headcount, if they haven't already. Therefore, every company is going to need to think this way in order to compete against new entrants in their space. Getting there takes two things: 1️⃣ Process. Companies need processes people actually follow, documentation that explains them, software that facilitates (or runs) them. Processes make a business measurable. 2️⃣ Full history. A record of everything that happens, from sales calls to meeting transcripts, to competitive research, to project plans to marketing, sales, operational, financial, etc data. This makes a business visible to AI and the team. With these two things in place, agentic analytics can do analysis and make (or suggest) better decisions, faster and far more frequently than humans. With agentic analytics, companies can be more agile, making decisions that used to take a quarter or a year within a week or a month. To help companies get here, I've developed an assessment. I've run it a few times now. Here's what I've seen so far: Nearly every company starts out fragmented, with numbers spread across systems that define them differently and someone assembling (or inspecting) them by hand every time. From there, the curve to an autonomous business has 4 stages: 1️⃣ Aggregated (visibility): All performance data & business context pulled into one place. 2️⃣ Governed (measurability): One source of truth, agreed definitions, and a target for every function. 3️⃣ Predictable (foresight): The business knows which activities produced which results, and can model what a change would do. 4️⃣ Autonomous (autonomy): Systems analyze and suggest work or act on their own. If you're curious where you stand, the assessment is free. It takes an hour, and you leave with a written report built at the end of the call. If you are one of the first few that respond to this, I'll be running the assessment. https://lnkd.in/guuB5uuk
- Digital Ratio GmbHSince 9 Oct 2026
„Agentic Sales ist spannend. Wir beobachten das erst einmal.“ Der Satz fiel im letzten Strategiemeeting. Das ist nachvollziehbar. Niemand möchte mit einem schlecht gewählten KI-Projekt Zeit und Budget verbrennen. Beim nächsten Meeting fällt derselbe Satz wieder. Ein Verantwortlicher fehlt weiterhin. Ein konkreter Versuch auch. Währenddessen bleibt der Vertrieb nicht stehen. Nur die Arbeit bleibt liegen. Nachfassaktionen versanden. Kundensignale aus CRM, E-Mails und Gesprächen werden nicht genutzt. Die Vorbereitung auf den nächsten Termin beginnt wieder bei null. Das Problem daran: Diese Verluste tauchen selten als eigene Position im Bericht auf. Niemand schreibt in eine Zeile, wie viele Chancen durch späte Reaktionen oder lückenhafte Vorbereitung verloren gingen. Ein Pilotbudget dagegen fällt sofort auf. So entsteht eine merkwürdige Sicherheit. Das sichtbare Budget wird vermieden. Die unsichtbaren Kosten laufen weiter. Die unbequeme Zuspitzung: Wer jeden Versuch verschiebt, verschiebt auch die Erkenntnis, was im eigenen Vertrieb funktioniert. Der bessere Weg beginnt nicht mit einem großen Programm. Wähle einen eng begrenzten Prozess. Zum Beispiel das Nachfassen nach einem Angebot, wenn innerhalb von drei Tagen keine Reaktion kommt. Erfasse vorher die Ausgangswerte: Zahl der Nachfassaktionen, Reaktionszeit des Teams und daraus entstehende Gespräche. Dann starte einen überschaubaren Versuch. Ein Agent bereitet die nächste Aktion vor. Der Mensch prüft und entscheidet. Erfolgskriterien, Laufzeit und Abbruchregeln stehen vorher fest. So wird aus Beobachtung eine belastbare Entscheidung. Vielleicht funktioniert der Ansatz. Vielleicht muss er angepasst werden. Beides ist wertvoll, weil es die eigene Realität abbildet und nicht die Folie eines Anbieters. Ein überschaubarer Einstieg liefert eigene Erfahrungen. Genau die fehlen im nächsten Strategiemeeting sonst wieder. Wenn du in einem zehnminütigen Video live sehen willst, wie Agentic Sales zum Turbo im Vertrieb wird, schreib mir eine private note mit „NICHT MEHR WARTEN“. Ich sende dir den Videolink.
- Digital Ratio GmbHSince 9 Oct 2026
11 Excel-Dateien, fünf Verantwortliche, eine Wahrheit. Die Wahrheit war nirgendwo. Bei einem Kunden lief die operative Steuerung über elf Excel-Dateien. Jede beteiligte Abteilung pflegte ihre eigene Version. Fünf Menschen trugen Verantwortung, doch niemand konnte verbindlich sagen, welcher Stand galt. Die Dateien waren nicht zwingend falsch. Sie beantworteten nur jeweils einen Ausschnitt. Das Problem entstand an den Übergängen: unterschiedliche Definitionen, unterschiedliche Aktualisierungszeitpunkte, unterschiedliche Annahmen. Elf sauber gepflegte Ausschnitte ergeben noch kein gemeinsames Bild. Wir haben die Daten in eine zentrale Struktur überführt. Technisch war das lösbar. Die eigentliche Arbeit begann danach. Wer pflegt welche Kennzahl? Bis wann? Wer prüft Abweichungen? Wer entscheidet, wenn zwei Bereiche unterschiedliche Werte melden? Und welcher Stand gilt ab Montagmorgen? Die fünf wichtigsten Learnings: 1. Eine gemeinsame Datenbasis braucht eine gemeinsame Definition. Sonst werden nur elf Widersprüche an einem Ort gesammelt. 2. Jede Kennzahl braucht eine fachlich verantwortliche Person. Nicht jeder ein bisschen. Eine Person muss verbindlich zuständig sein. 3. Aktualität muss geregelt sein. Ein Wert ohne Stichtag ist keine Steuerungsinformation. 4. Abweichungen brauchen einen Eskalationsweg. Sonst gewinnt im Meeting die Datei mit der überzeugendsten Formatierung. 5. Entscheidungen brauchen einen klaren Prozess. Daten zeigen etwas. Handeln muss danach jemand. Excel war nicht der Bösewicht. Für einzelne Aufgaben ist es schnell, flexibel und völlig ausreichend. Kritisch wird es, wenn aus vielen lokalen Werkzeugen unbemerkt ein gemeinsames Steuerungssystem werden soll. Eine zentrale Plattform allein löst das ebenso wenig. Ohne Rollen, Definitionen und Entscheidungsregeln entsteht aus elf Dateien nur ein sehr ordentlich zentralisierter Streit. Wenn du prüfen willst, ob deine operative Steuerung auf einer gemeinsamen Wahrheit beruht, schreib mir. In einem kurzen Steuerungs-Check klären wir Datenquellen, Verantwortungen und Entscheidungswege.
- CubbitSince 7 Oct 2026
🛡️ Cubbit and GigaCloud are bringing 𝘀𝗼𝘃𝗲𝗿𝗲𝗶𝗴𝗻, 𝗿𝗲𝘀𝗶𝗹𝗶𝗲𝗻𝘁 𝗰𝗹𝗼𝘂𝗱 𝘀𝘁𝗼𝗿𝗮𝗴𝗲 to Ukraine and Poland. GigaCloud (Ukraine's leading cloud provider and the first NVIDIA Solutions Advisor in the country, serving 1,500+ companies and 20M users) will deploy DS3 Composer across its 𝗳𝗶𝘃𝗲 𝗱𝗮𝘁𝗮 𝗰𝗲𝗻𝘁𝗿𝗲𝘀 in Kyiv, Lviv, and Warsaw, spanning three availability zones. This isn't a theoretical resilience story. 𝗔𝗿𝗺𝗲𝗱 𝗰𝗼𝗻𝗳𝗹𝗶𝗰𝘁 𝗵𝗮𝘀 𝗽𝗿𝗼𝘃𝗲𝗻 𝘁𝗵𝗮𝘁 𝗻𝗼 𝘀𝗶𝗻𝗴𝗹𝗲 𝗳𝗮𝗰𝗶𝗹𝗶𝘁𝘆 𝗰𝗮𝗻 𝗯𝗲 𝗰𝗼𝗻𝘀𝗶𝗱𝗲𝗿𝗲𝗱 𝘀𝗮𝗳𝗲: attacks on critical infrastructure can take data centres offline, and "always available" has to mean something real. Cubbit's technology encrypts, fragments, and geo-distributes data across multiple sites, so no single facility failure takes critical systems down. Organisations choose exactly where their data lives: Ukraine only, Poland only, or both, staying compliant with GDPR while keeping full control. Each customer gets full tenant isolation, with a dedicated S3-compatible endpoint covering access rights, projects, configurations, metrics, and billing, plus multiple service tiers active at once through a single interface. Use cases span immutable backup, disaster recovery, long-term archiving, and unstructured data at scale. GigaCloud is bringing this to government, defence, financial services, media, retail, and IT - sectors where predictable RTO and RPO aren't nice-to-haves, they're operational requirements. Unstable conditions redefine what reliable infrastructure means. Sovereignty is not a separate goal from resilience, it's what makes resilience possible. 👇 Full press release in the first comment.



Other LinkedIn formats
Watch the companies you care about.
Filter every ad by industry, country, format and network, and get alerts when a company you watch starts running new ads.