On air · 1 of 3 networks
Cambridge Intelligence
- cambridge-intelligence.com
- Data
- GB
- 86 employees
Cambridge Intelligence’s ads on LinkedIn, Meta and Google, recorded by adsrunning. Browse the latest here for free. Sign up free to see all 27. Watch Cambridge Intelligence with Starter to get each new one in your feed.
Watchlist with Starter · $49/mo
| Network | Status | Live ads | Nov 2025LinkedIn activity · 52 weeksOct 2026 | Checked | Next step |
|---|---|---|---|---|---|
| None recorded | 0 | Checked 28 Oct 2026 | See all 27 ads → | ||
| Meta | Not checked | — | |||
| Running | 62 | Ads on the Google Ads Transparency Center | Checked 24 Oct 2026 | Collect them with the API → |
Cambridge Intelligence has no live LinkedIn ads. We recorded 62 Google ads on 24 Oct 2026.
Latest ads
- LINKEDIN · IMAGESince 26 Oct 2026
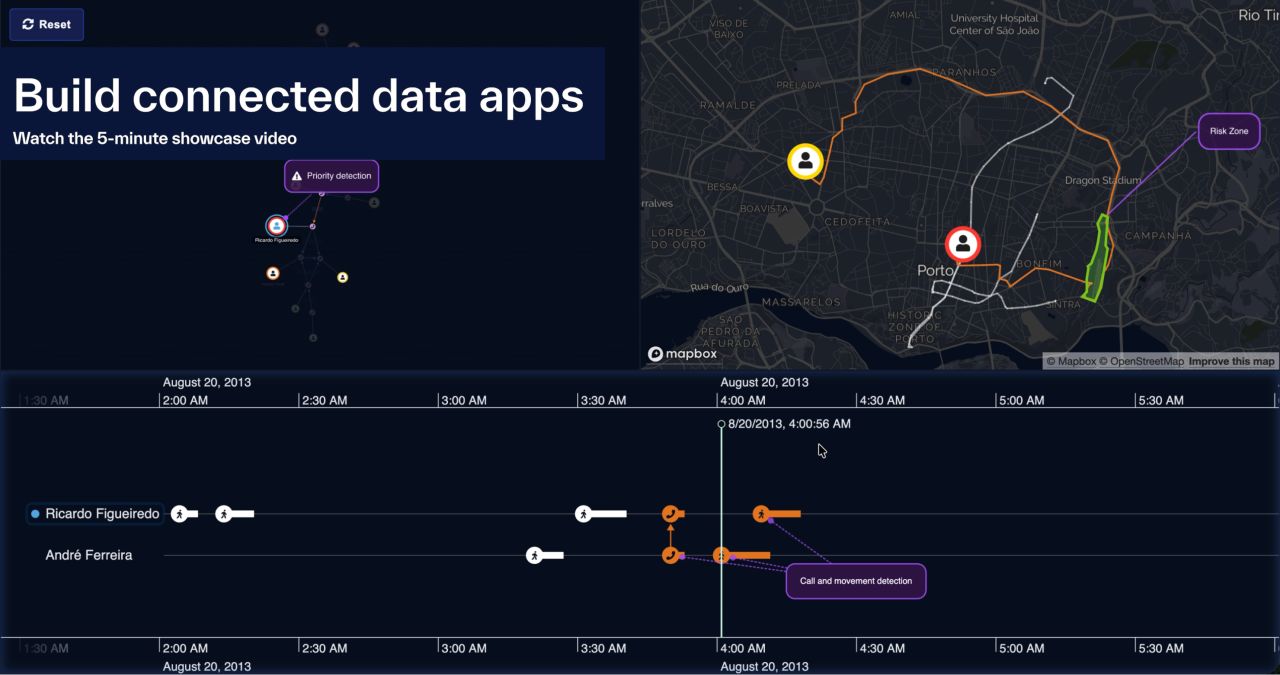
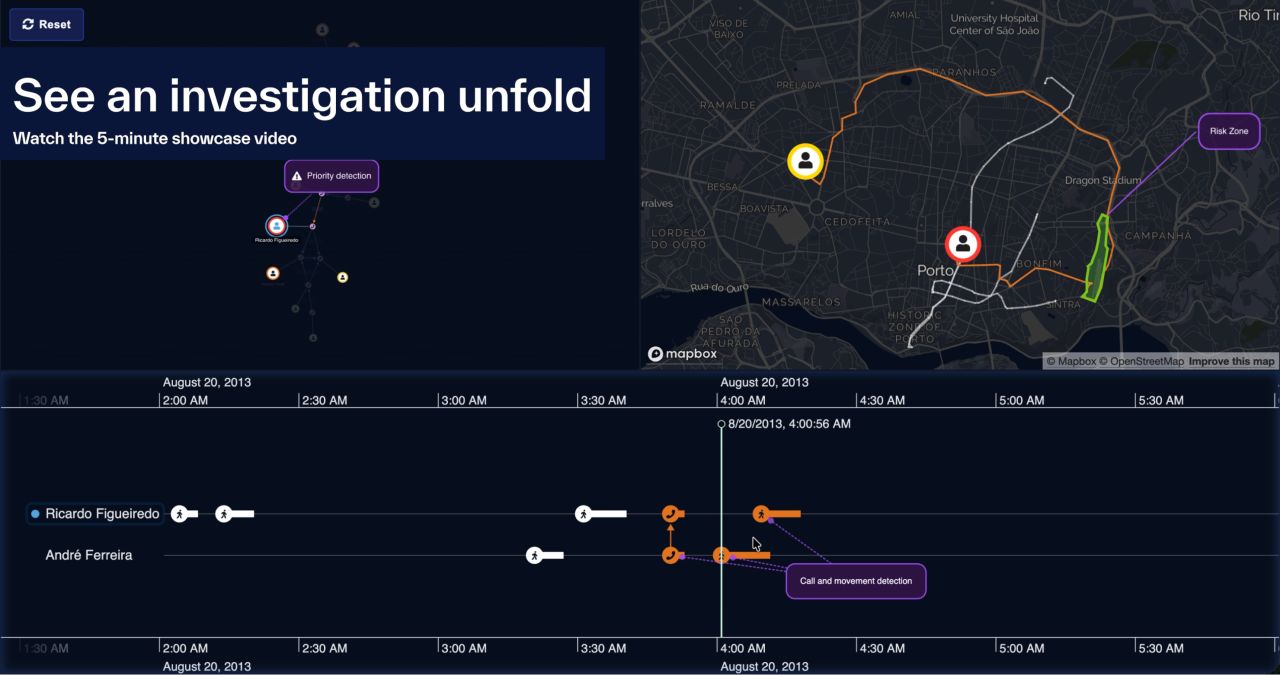
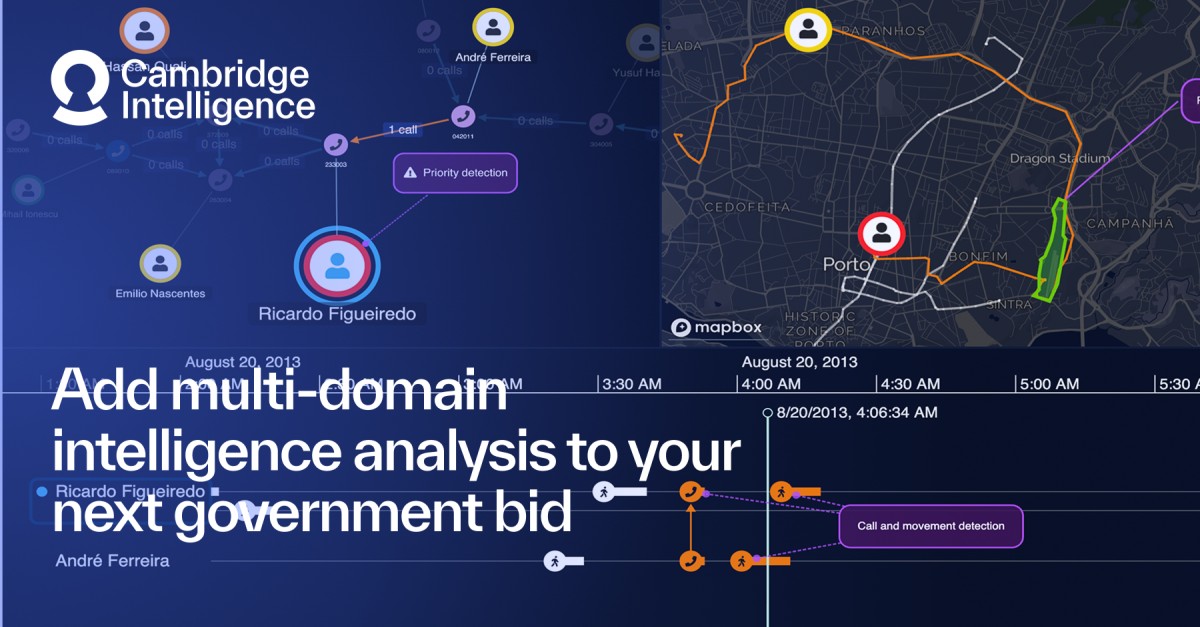
What does it take to bring relationships, events and locations together in one investigation application? See how KeyLines, KronoGraph and MapWeave work together to deliver an interactive, multimodal investigative experience. Watch the 5-minute showcase overview.
- LINKEDIN · IMAGESince 26 Oct 2026
One phone call. Two devices moving across a city. A shared destination. How can investigators connect these events to identify patterns worth exploring? Watch our 5-minute data fusion investigations showcase to see how graph, timeline and geospatial visualizations bring connected data into a single investigative workflow.
- LINKEDIN · IMAGESince 15 Oct 2026
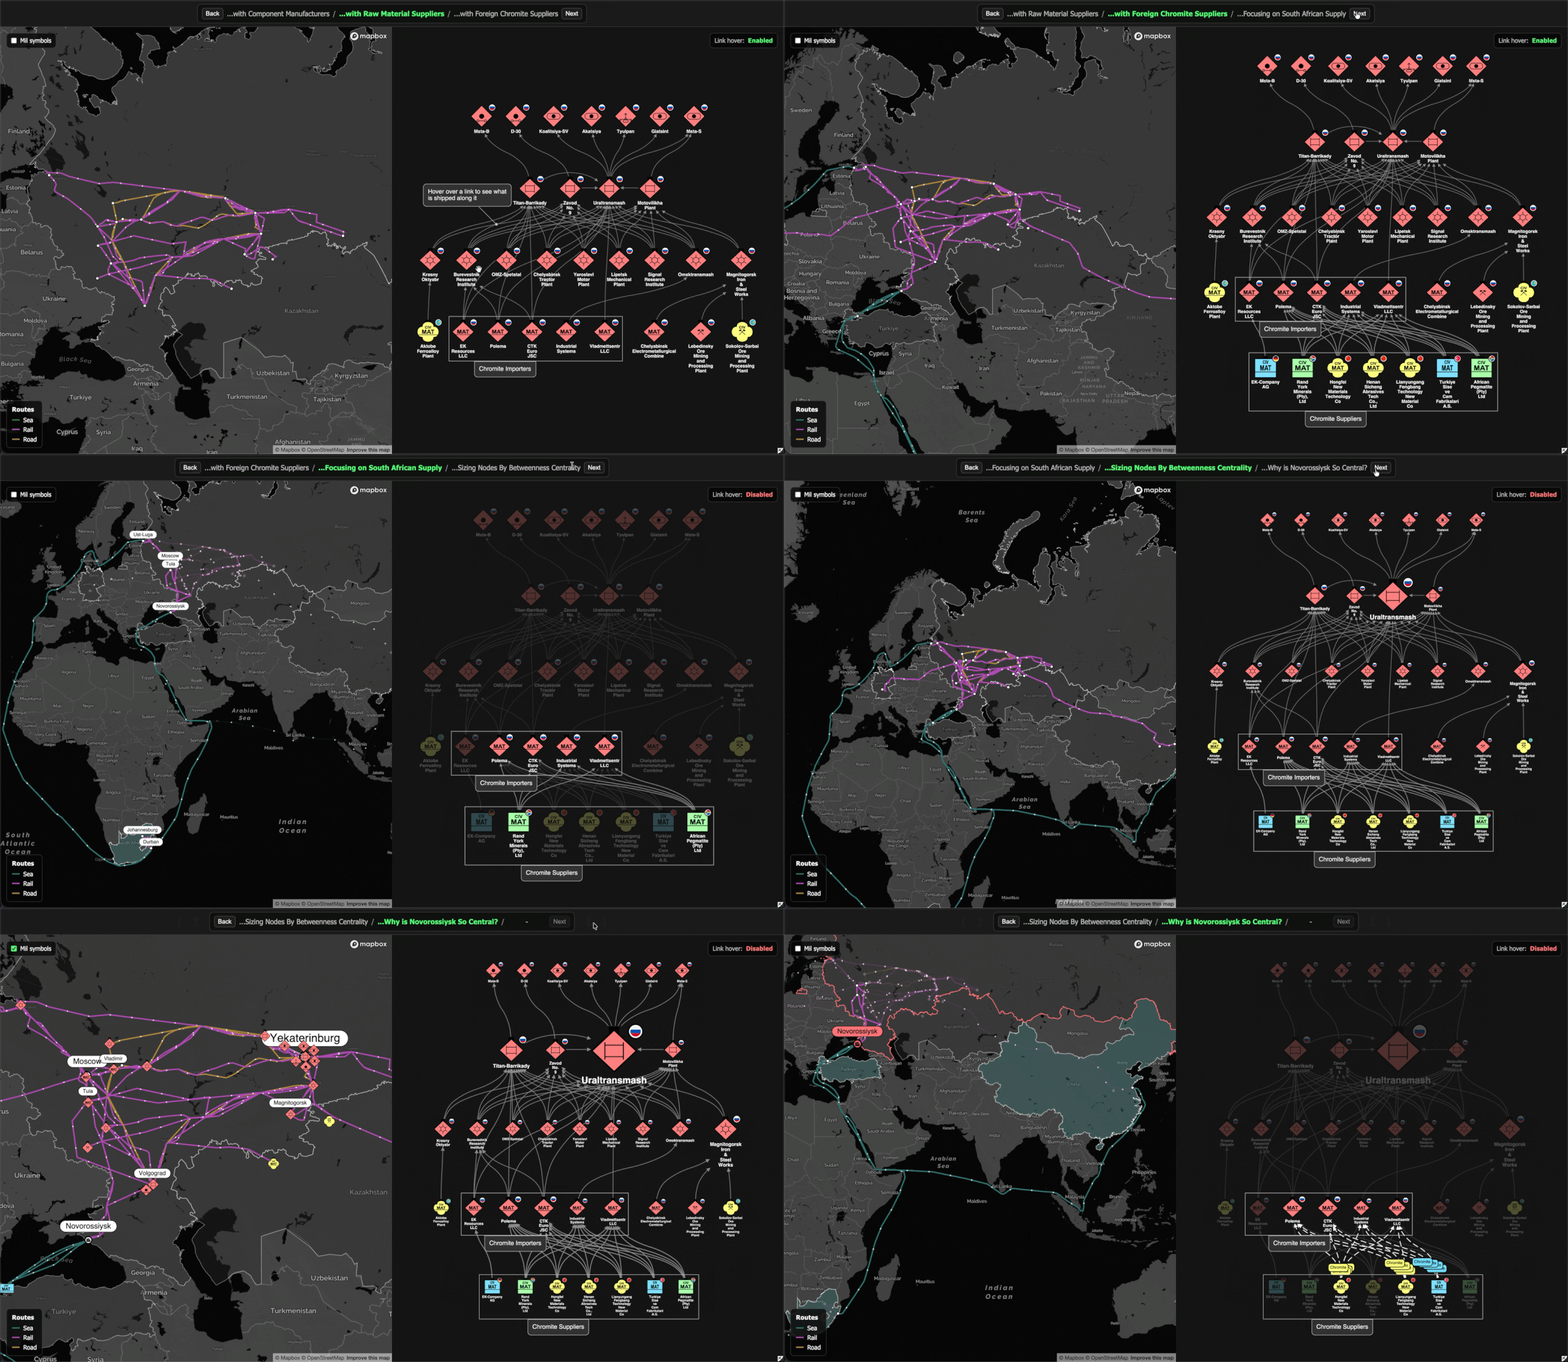
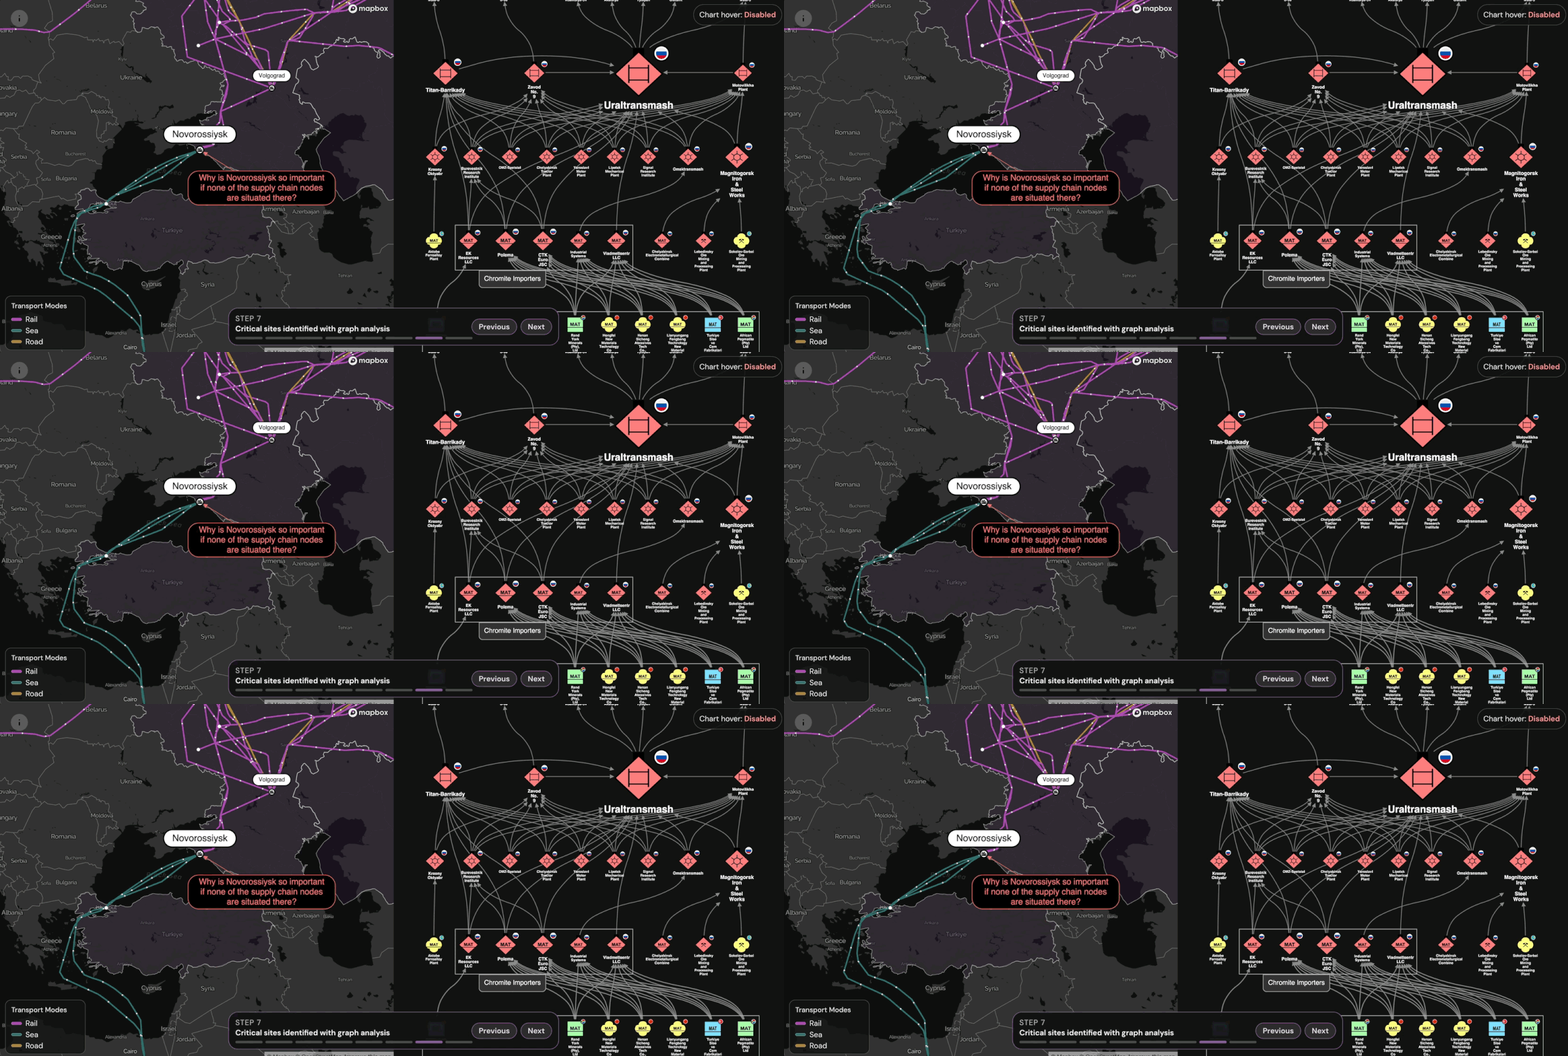
Who doesn't love a sneak preview? :) Last year, I built a little visualisation of the russian artillery supply chain based on RUSI's "Ore to Ordnance" paper and we published a blog on it back in December (can't believe that's 4 months ago - WTF?!). But basically since I built it, it bothered me... It received great feedback for the graph network visualisation part, and for the bit where you could see the potential impact of a typhoon on the map (I'll pop a link to the blog in the chat if you didn't see it before). But the rest of the geospatial visualisation didn't really add more value - it kind of just showed the same thing as the chart... So I've been working on a new version (in the gif) which is all about why its valuable to have complementary graph AND geospatial visualisations for supply chain applications, especially for assessing centrality, risk and impact of disruptions (Strait of Hormuz anyone?). More on this soon but hope you enjoy the gif for now :)
- LINKEDIN · IMAGESince 15 Oct 2026
Graphs on maps just got real... Abstract graphs help you understand connectivity, bottlenecks and the importance of nodes in a network. But links in the real world aren't as simple as that. They follow train routes, or coastlines; they pass through real world geographic pinch points and conflict zones. MapWeave 1.9 is out, with a new hybrid approach. Treat a graph as an abstract concept for analysis, but give it real world path routing to understand the true geospatial meaning of those links and flows in your data. More examples at https://lnkd.in/ejQMT-_4
- LINKEDIN · IMAGESince 2 Sept 2026
Embedding Cambridge Intelligence's SDKs means your team can put network, temporal, and geospatial analysis in front of your own clients. Accredited for high-security environments, built for massive data volumes, and backed by hands-on delivery support, it delivers native functionality fully tailored to your offer.
- LINKEDIN · IMAGESince 19 Aug 2026
Government and intelligence analysts often have the data they need, but not an easy way to connect it. Cambridge Intelligence gives systems integrators the visual analysis technology to bring relationships, events and locations together inside the platforms they deliver.
6 of 27 adsSign up to see every Cambridge Intelligence ad, filter by format and date, and get alerts on new ones.
See all 27 adsWatch the companies you care about.
Filter every ad by industry, country, format and network, and get alerts when a company you watch starts running new ads.