On air · 1 of 3 networks
definity
- definity.ai
- Data
- US
- 23 employees
definity’s ads on LinkedIn, Meta and Google, recorded by adsrunning. Browse the latest here for free. Sign up free to see all 280. Watch definity with Starter to get each new one in your feed.
Watchlist with Starter · $49/mo
| Network | Status | Live ads | Nov 2025LinkedIn activity · 52 weeksOct 2026 | Checked | Next step |
|---|---|---|---|---|---|
| Running | 7 | Checked 30 Oct 2026 | See all 280 ads → | ||
| Meta | Not checked | — | |||
| None recorded | 0 | No ads found on the Google Ads Transparency Center | Checked 26 Oct 2026 | Collect them with the API → |
definity has 7 live LinkedIn ads. We recorded no Google ads on 26 Oct 2026.
Latest ads
- LINKEDIN · IMAGESince 22 Oct 2026
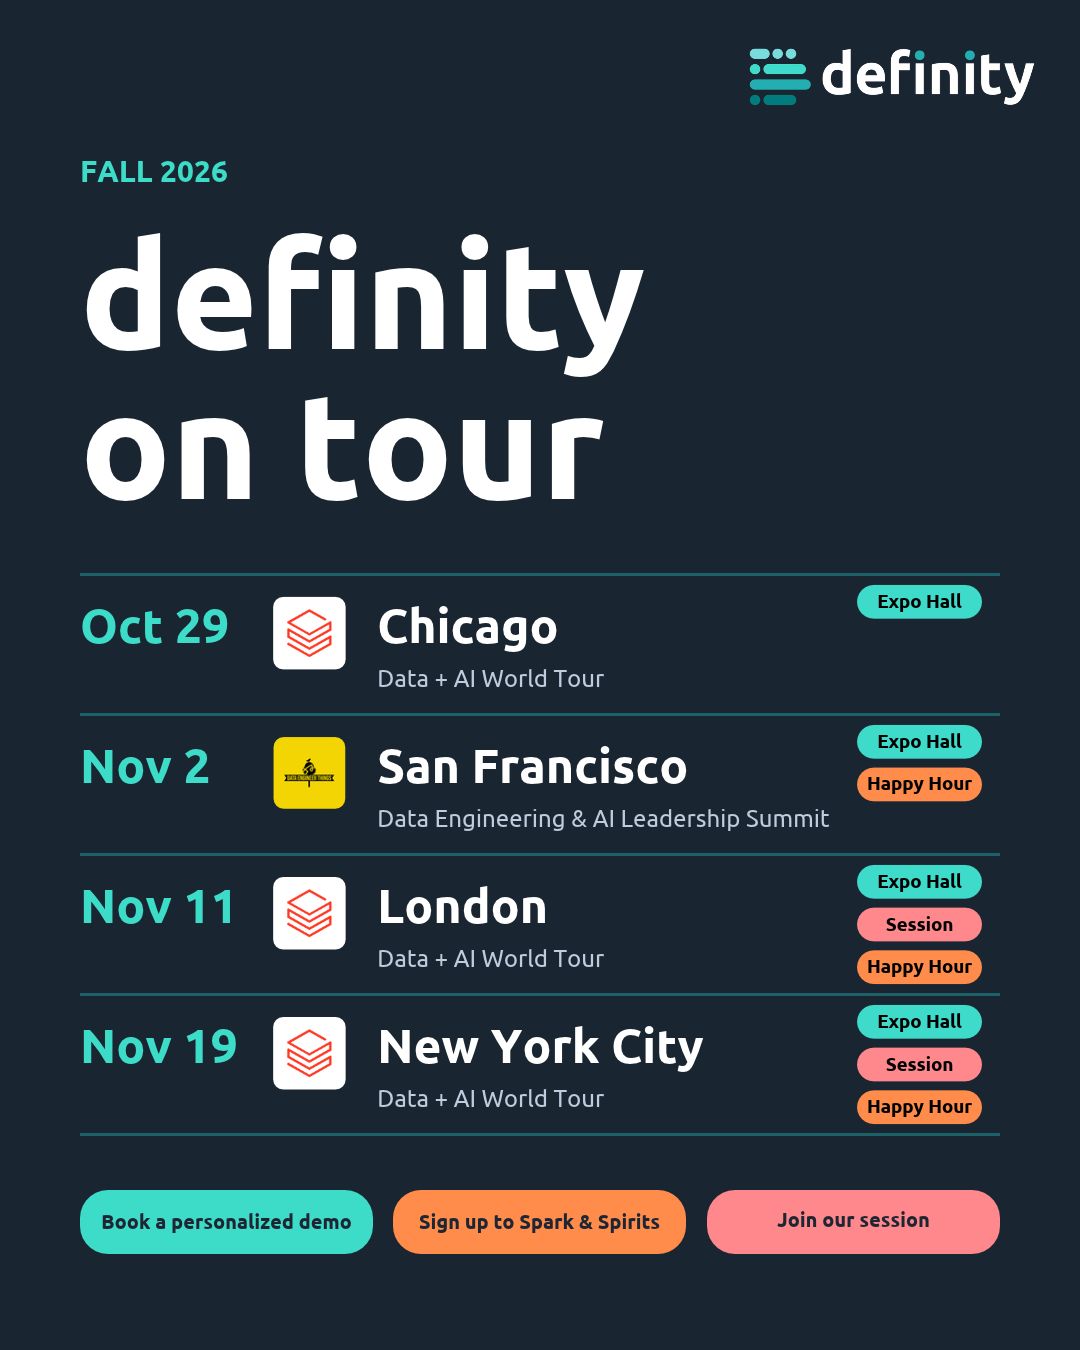
This fall, we’re on the road: 𝗖𝗵𝗶𝗰𝗮𝗴𝗼 → 𝗦𝗮𝗻 𝗙𝗿𝗮𝗻𝗰𝗶𝘀𝗰𝗼 → 𝗟𝗼𝗻𝗱𝗼𝗻 → 𝗡𝗲𝘄 𝗬𝗼𝗿𝗸. ⠀ A packed few weeks with live demos, Spark & Spirits happy hours, and deep technical conversations. ⠀ I’ll also be on stage in London and NYC, talking about 𝗔𝗴𝗲𝗻𝘁𝗶𝗰 𝗖𝗼𝘀𝘁 𝗢𝗽𝘁𝗶𝗺𝗶𝘇𝗮𝘁𝗶𝗼𝗻 𝗳𝗼𝗿 𝗦𝗽𝗮𝗿𝗸 𝗮𝗻𝗱 𝗗𝗮𝘁𝗮𝗯𝗿𝗶𝗰𝗸𝘀. ⠀ One of my favorite parts of the job – connecting in person with the Databricks and Data Engineer Things communities. ⠀ 𝗕𝗿𝗶𝗻𝗴 𝘂𝘀 𝘆𝗼𝘂𝗿 𝘁𝗼𝘂𝗴𝗵𝗲𝘀𝘁 𝗽𝗶𝗽𝗲𝗹𝗶𝗻𝗲. 𝗪𝗲’𝗹𝗹 𝗼𝗽𝘁𝗶𝗺𝗶𝘇𝗲 𝗶𝘁.
- LINKEDIN · IMAGESince 21 Oct 2026
Four cities. Three weeks. One team. ⠀ definity is on tour this fall: ⠀ Chicago · Oct 29 San Francisco · Nov 2 London · Nov 11 New York · Nov 19 ⠀ 📍 Meet us at the booth at every stop – and schedule time with us for a personalized demo. 🥂 Join Spark & Spirits happy hours in SF, London, and NYC with fellow data, platform, and AI engineers. 🎤 Join our Agentic Databricks Cost Optimization session in NYC and London. ⠀ Booking and RSVP links in the comments.
- LINKEDIN · IMAGESince 19 Oct 2026
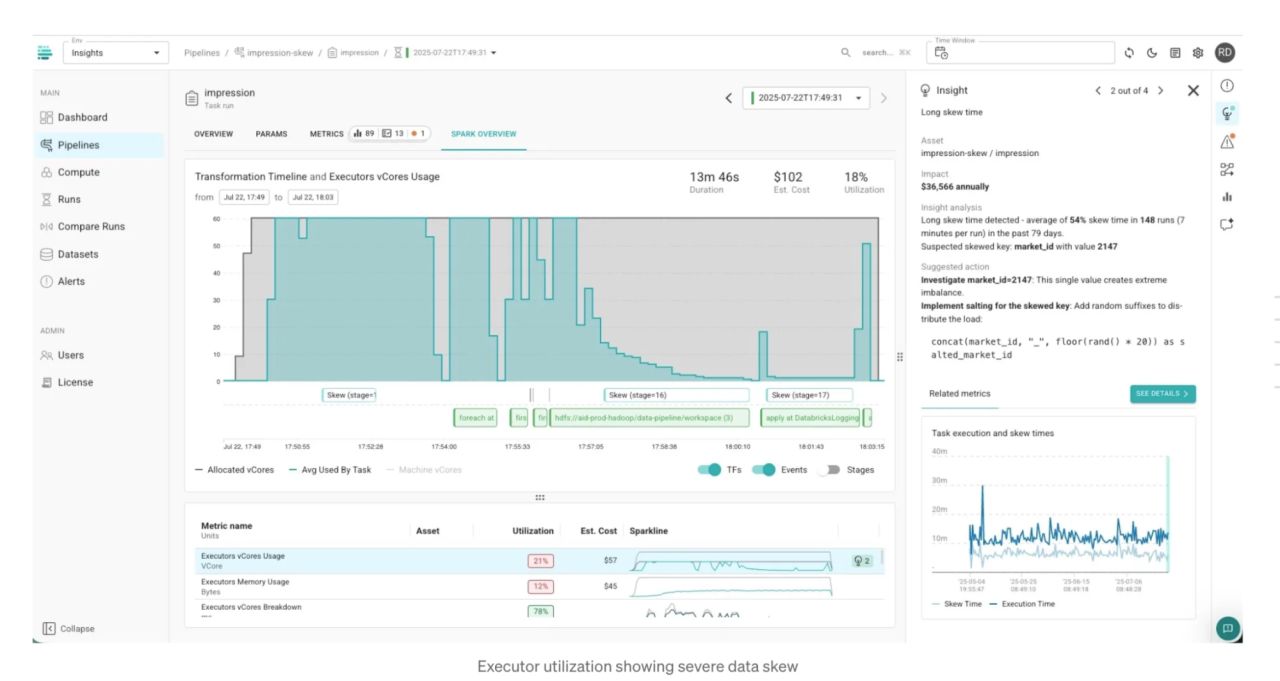
One thing I find fascinating about Spark optimization is how much the nuances matter. ⠀ In a recent case I worked on, we were analyzing a pipeline with low utilization, but unclear root cause. At first glance, the average task duration looked fine. But looking deeper, the average task ran for 27 seconds, while the slowest task took over 3.5 minutes. ⠀ 𝗙𝗼𝗿 𝗼𝘃𝗲𝗿 𝟮 𝗺𝗼𝗻𝘁𝗵𝘀, 𝘀𝗸𝗲𝘄 𝗮𝗰𝗰𝗼𝘂𝗻𝘁𝗲𝗱 𝗳𝗼𝗿 𝟱𝟰% 𝗼𝗳 𝘁𝗵𝗲 𝗷𝗼𝗯 𝗲𝘅𝗲𝗰𝘂𝘁𝗶𝗼𝗻 𝘁𝗶𝗺𝗲! ⠀ Detecting skew wasn't the hard part. We needed to find exactly where it occurred, why, and what key was responsible for the imbalance. ⠀ So we went down the rabbit hole, following the execution path from stages → tasks → shuffle partitions → partitioning keys – which uncovered the culprit key (𝘮𝘢𝘳𝘬𝘦𝘵_𝘪𝘥 = 2147 if you're interested). ⠀ From there, the fix was clear – salting the hot key to spread the work across partitions. ⠀ 𝗧𝗵𝗲 𝗿𝗲𝘀𝘂𝗹𝘁? 𝟮𝟰% 𝗳𝗮𝘀𝘁𝗲𝗿 𝘀𝘁𝗮𝗴𝗲 𝗿𝘂𝗻𝘁𝗶𝗺𝗲 𝗮𝗻𝗱 $𝟯𝟲𝗞 𝗮𝗻𝗻𝘂𝗮𝗹𝗶𝘇𝗲𝗱 𝘀𝗮𝘃𝗶𝗻𝗴𝘀 𝗳𝗿𝗼𝗺 𝘁𝗵𝗶𝘀 𝗷𝗼𝗯 𝗮𝗹𝗼𝗻𝗲. ⠀ This is exactly the kind of investigation we've built definity to do agentically, out of the box, so you don’t have to spend days in Spark UI, reviewing code, and re-running jobs, again and again. ⠀ In our webinar with Data Engineer Things, Roy Daniel and I will walk through a framework for optimizing Spark across the stack, using real production cases. ⠀ Stop Optimizing the Wrong Part of Your Spark Job ↓ https://lnkd.in/d5A2Pmyg
- LINKEDIN · IMAGESince 13 Oct 2026
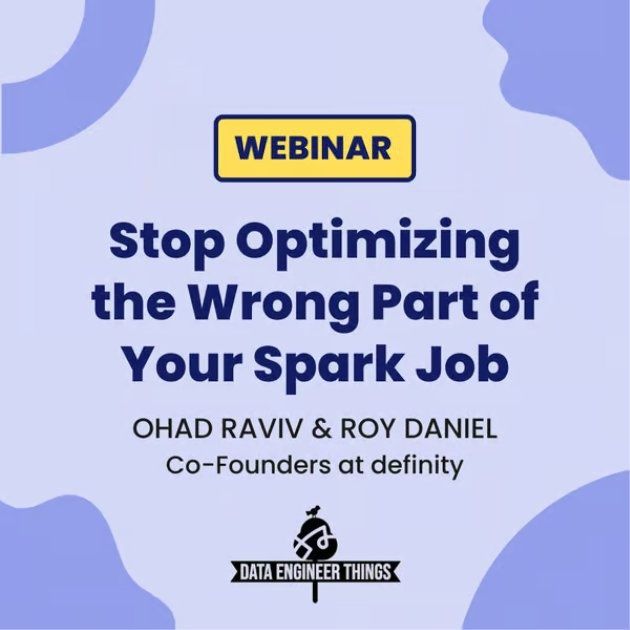
Most Spark waste isn't simply “hard to fix”. 𝗜𝘁'𝘀 𝗵𝗮𝗿𝗱 𝘁𝗼 𝘀𝗲𝗲. ⠀ The signals that can expose it are often not monitored, and rarely live in one place. ⠀ These native signals – e.g. runtime executor vs machine shape, query-level skewed keys, S3 calls in idle-time, and operator-level input vs output rows – are hard to extract. Some don’t exist natively. Others are gone once the job completes. Most are never collected. ⠀⠀ In our webinar with Data Engineer Things, Ohad Raviv and I walk through the signals that matter at each layer of the Spark stack and how to collect them, sharing specific cases from our own experience. ⠀ Join here - https://lnkd.in/g4_WqcF8
- LINKEDIN · IMAGESince 26 Sept 2026
Join us and the Data Engineer Things community for a practical webinar on how to investigate and fix Spark waste across the stack, with a framework and real production cases.
- LINKEDIN · IMAGESince 21 Sept 2026
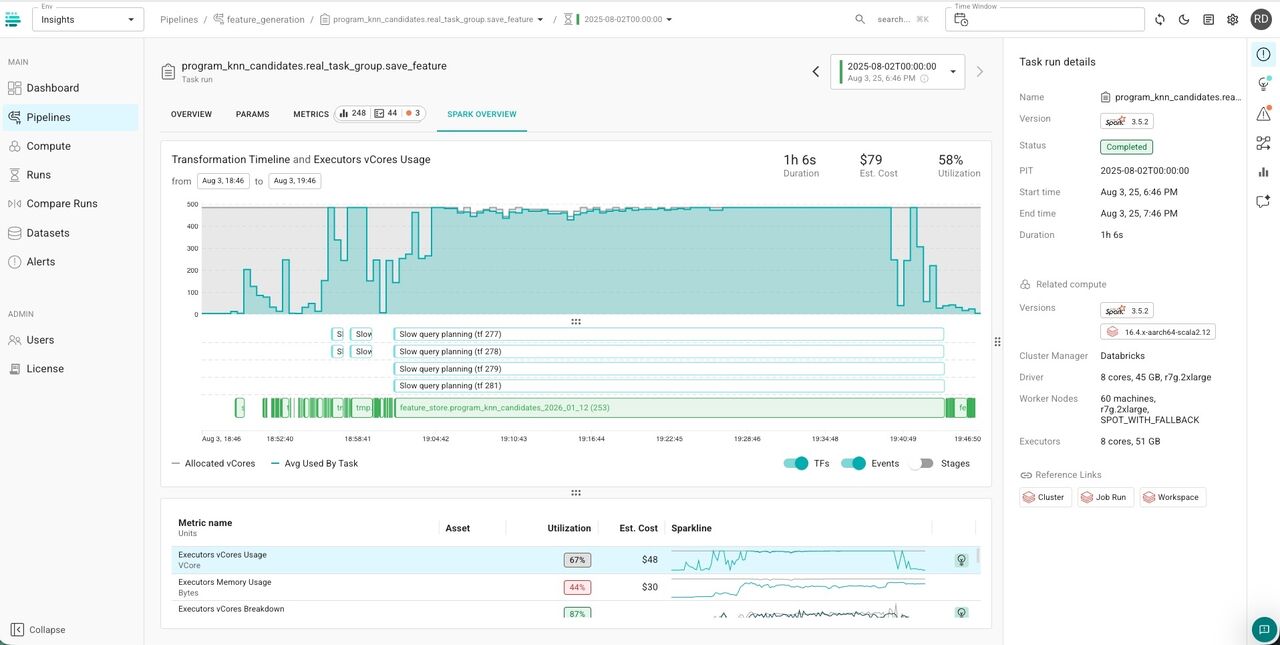
The layer where Spark waste shows up is often not the layer where you need to fix it. High compute utilization, long stages, spill, or expensive shuffles are useful signals. But they can easily lead you toward an obvious optimization – and the wrong one. In one case, I was investigating an expensive KNN workload with high compute utilization and a ~10K-line query plan. Runtime cardinality showed a long-running stage spending half its time sorting ~13B intermediate records – most of which were discarded later in the plan. The fix wasn’t compute tuning. It was changing the application logic to reduce the data earlier in the execution. 𝗦𝗼 𝗵𝗼𝘄 𝗱𝗼 𝘆𝗼𝘂 𝗴𝗲𝘁 𝗳𝗿𝗼𝗺 𝘁𝗵𝗲 𝘀𝘆𝗺𝗽𝘁𝗼𝗺 𝘁𝗼 𝘁𝗵𝗲 𝗮𝗰𝘁𝘂𝗮𝗹 𝗼𝗽𝘁𝗶𝗺𝗶𝘇𝗮𝘁𝗶𝗼𝗻? Trace the execution across infrastructure, Spark runtime, data access, and the physical query plan. Look at executor allocation, task distribution, I/O, shuffle and spill, and operator-level cardinality. The goal is to follow where the work is created, where it accumulates, and where it can actually be eliminated. Roy Daniel and I wrote about this framework and four real production cases in 𝗜𝗻𝘃𝗲𝘀𝘁𝗶𝗴𝗮𝘁𝗶𝗻𝗴 𝗦𝗽𝗮𝗿𝗸 𝗪𝗮𝘀𝘁𝗲 𝗔𝗰𝗿𝗼𝘀𝘀 𝘁𝗵𝗲 𝗦𝘁𝗮𝗰𝗸, now on the Data Engineer Things blog.


6 of 280 adsSign up to see every definity ad, filter by format and date, and get alerts on new ones.
See all 280 adsWatch the companies you care about.
Filter every ad by industry, country, format and network, and get alerts when a company you watch starts running new ads.