LinkedIn thought leader ad examples
49 thought leader ads are live on LinkedIn right now, from 94 companies. Browse real ones, filtered by industry.
- Icon MapSince 21 Oct 2026
I've been wanting to improve how the sea looks on our base map styles for a long time - especially for our a maritime customers. After a series of rewrites I think I've finally found an approach I'm happy with. It works with all our map styles, and can inherit the colours of the existing map. Keep up to date with the regular updates: https://lnkd.in/ecpnG2nU #IconMapForFabric #MapsInFabric #MicrosoftFabric #IconMap
- Icon MapSince 21 Oct 2026
What will your construction project look like from the surrounding community? Before a wind turbine, power line, road, or new building is constructed, understanding its visual impact can be critical. The viewshed tools in #IconMapForFabric make this analysis interactive. Choose a location and height, then instantly see where the object would be visible from. Highlight affected buildings and areas, or select impacted features directly from a map layer. You can also analyze multiple objects together, creating a combined viewshed for an entire development rather than assessing each asset individually. It turns a complex spatial question - “Who will be able to see this?” - into an interactive visual analysis. Icon Map for Fabric launches soon - sign up to keep up to date: https://lnkd.in/ecpnG2nU #MicrosoftFabric #Geospatial #Construction #GIS #LocationIntelligence #SpatialAnalytics
- Inphinity ∞Since 7 Oct 2026
A short tech/business overview of what you can do with Inphinity Planning in Qlik (both, On premise and Cloud). Created to solve real planning challenges, it uses Qlik dimensions and measures respecting section access and other #Qlik rules. And there is much more.. Got a use case there? #analytics Inphinity ∞
- Digital Ratio GmbHSince 9 Oct 2026
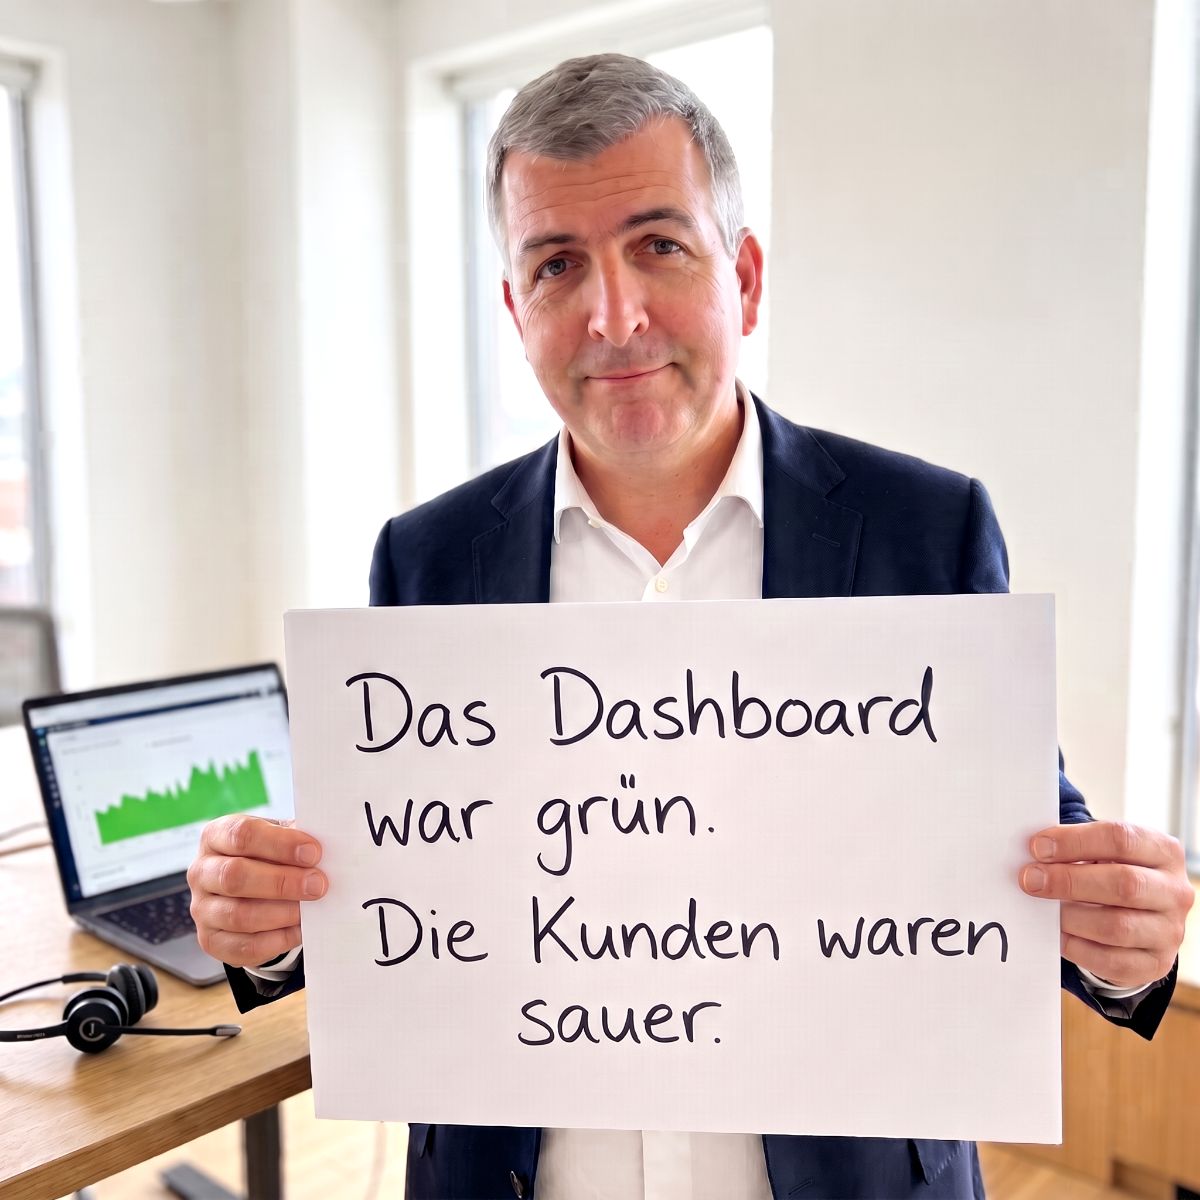
Das Dashboard war grün. Die Kunden waren sauer. Ich habe Berichte gesehen, die technisch einwandfrei waren. Die Daten waren korrekt. Die Berechnungen auch. Trotzdem wusste niemand, welche Entscheidung daraus folgen sollte. Erst als wir Kontext und Handlungsempfehlungen ergänzten, wurde aus der Auswertung eine Entscheidungsgrundlage. Ein Beispiel aus dem Kundenservice macht das greifbar. Die durchschnittliche Bearbeitungszeit sinkt. Das Management freut sich über mehr Effizienz. Kürzere Gespräche, mehr erledigte Kontakte. Sieht gut aus. Der Bericht zeigt aber nur die halbe Geschichte. Kunden rufen mehrfach an, weil ihr Anliegen beim ersten Kontakt ungelöst bleibt. Jedes Gespräch ist kürzer. Bis zur Lösung dauert es für den Kunden trotzdem länger. Und das Serviceteam bearbeitet dasselbe Problem mehrfach.Die Zahlen stimmen. Die Schlussfolgerung braucht mehr Kontext. Aus meiner Sicht gehören hier drei Kennzahlen zusammen. Die Bearbeitungszeit je Kontakt. Die Wiederholungskontakte zum selben Anliegen. Und die Quote der Anliegen, die beim ersten Kontakt tatsächlich gelöst werden. Auch diese Verbindung braucht klare Regeln. Es muss feststehen, wann ein Anliegen als gelöst gilt. Ebenso braucht es eine Frist für die Zuordnung von Wiederholungskontakten. Und einen Vergleich ähnlicher Anliegen. Einfache Auskünfte und komplizierte Reklamationen in einen Durchschnitt zu werfen, erklärt wenig. Wenn kürzere Gespräche mit mehr Wiederholungskontakten zusammenfallen, lohnt sich der Blick auf die Ursachen. Vielleicht fehlen Wissen oder Befugnisse. Vielleicht endet das Gespräch, bevor der nächste Schritt geklärt ist. Eine brauchbare Handlungsempfehlung könnte dann so aussehen. Die Serviceleitung prüft die häufigsten Gründe für erneute Anrufe. Für einen ausgewählten Anliegenstyp verbessert sie den Ablauf. Anschließend kontrolliert sie, ob mehr Anliegen beim ersten Kontakt gelöst werden und der gesamte Bearbeitungsaufwand sinkt. Das ist für mich die Aufgabe eines guten Berichts. Er zeigt den Zusammenhang. Er macht die nächste Entscheidung greifbar. Und er benennt, wer handelt und woran die Wirkung geprüft wird. Daten ohne Kontext sind wie eine Karte ohne Legende. Präzise gezeichnet. Zur Orientierung fehlt trotzdem etwas. Wenn du einen solchen Bericht hast, schreib mir. Wir schauen gemeinsam, welcher Zusammenhang für die nächste Entscheidung fehlt.
- CubbitSince 7 Oct 2026
📊 🇳🇱 New deployment in the Netherlands Dutch cloud infrastructure provider Worldstream - Solid IT. No Surprises. will integrate DS3 Composer, Cubbit’s software-defined object storage, across its three data centres in the Netherlands. This will allow Worldstream to launch its own S3-compatible cloud storage service, fully hosted and operated on its infrastructure — including its own bare-metal solutions and high-performance network. For service providers, this kind of deployment makes it possible to offer storage services that are: • sovereign by design • cost-competitive vs. hyperscalers • easy to implement, with full control over data Worldstream is launching the service with an initial capacity of 1 PB, with further expansion planned in the coming years. This shows how service providers can create fully sovereign, premium cloud storage services that are cost competitive — directly leveraging their own infrastructure. A concrete step toward stronger sovereign cloud infrastructure in Europe. #distributedcloud #cubbit #ds3 #composer
- DATPROF - Test Data SimplifiedSince 9 Oct 2026
How do you decide between synthetic data and masked production data? During the Q&A of our DATPROF Customer Webinar yesterday, I discussed this question with Bert Nienhuis. It’s one of the most persistent debates in Test Data Management (TDM), but in reality, you don't have to choose. Use synthetic data early in your SDLC for fast unit testing and new features where production data doesn't exist yet. Switch to masked, subsetted production data further down the pipeline for integration and regression testing, where real-world business logic and historical edge cases are essential to catch critical bugs. Stop looking for a single magic solution. True TDM maturity is about placing the right tool at the right stage of your delivery pipeline. 👇 Want to watch the full Customer Webinar? Link in comments.
- Ellipsis DriveSince 8 Oct 2026
While Agentic AI can reason, it still needs an external compute resource to run its logic. Such logic may include geospatial computations. 🧠 The future of spatial AI depends on connecting the intelligent reasoning from LLMs with a solution that can run any geospatial logic against any geospatial data in a scalable way. #AgenticAI #GeospatialData #SpatialComputing
- Ellipsis DriveSince 8 Oct 2026
🗺️ 𝗥𝗮𝘀𝘁𝗲𝗿 𝗱𝗮𝘁𝗮 𝗶𝘀 𝗮 𝗴𝗼𝗼𝗱 𝗲𝘅𝗮𝗺𝗽𝗹𝗲 𝗼𝗳 𝘄𝗵𝘆 𝗼𝗻𝗲 𝘀𝘁𝗼𝗿𝗮𝗴𝗲 𝗮𝗯𝘀𝘁𝗿𝗮𝗰𝘁𝗶𝗼𝗻 𝗱𝗼𝗲𝘀𝗻'𝘁 𝗻𝗲𝗰𝗲𝘀𝘀𝗮𝗿𝗶𝗹𝘆 𝗳𝗶𝘁 𝗮𝗹𝗹 𝗱𝗮𝘁𝗮. Its spatial relationships are fundamental to how it needs to be stored, accessed and processed, something a tabular abstraction doesn't naturally preserve. The result? More complexity gets pushed downstream onto the data team.
- SentrySince 9 Oct 2026
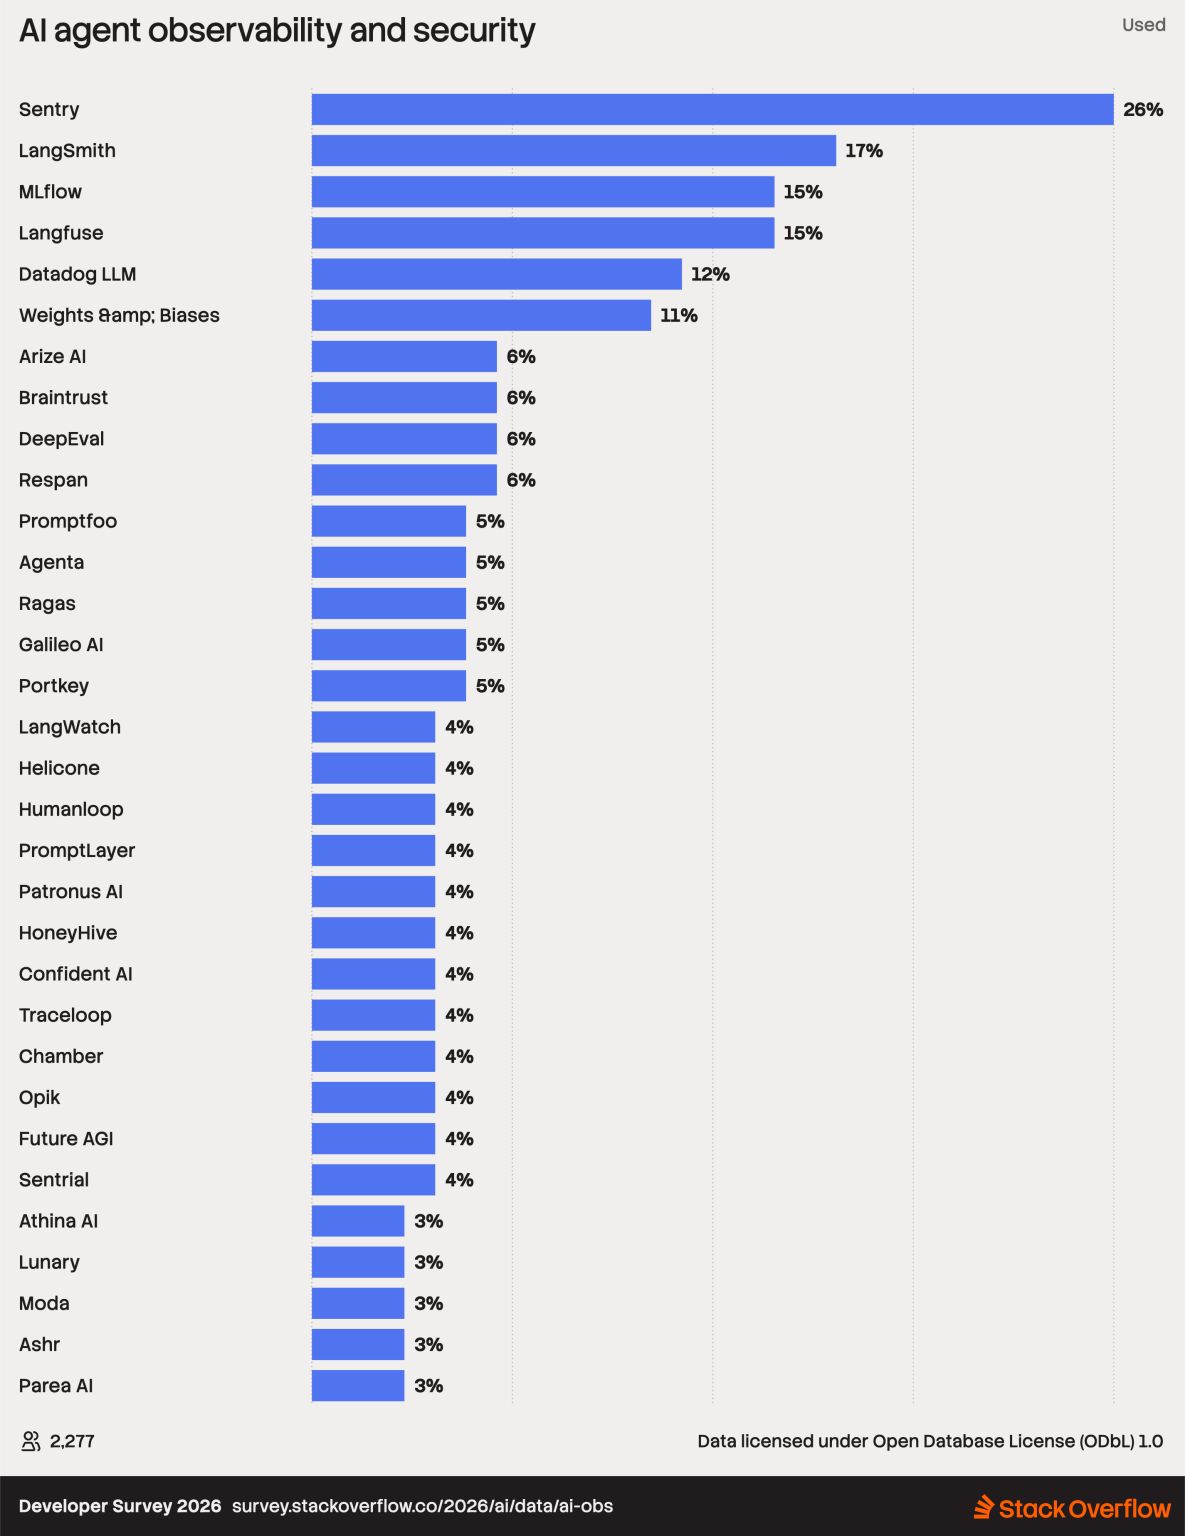
In Stack Overflow's Developer Survey, the majority of developers said they use Sentry for AI agent observability and security. Here's what's we are seeing: - AI observability isn’t a silo. Increasingly apps are embedding AI through chat and other features, and teams want to see the whole user journey, not just the LLM calls. We got you! When your AI and the rest of your app are monitored in one place, you can trace a bad response back to what the user actually did. - Agent tracing is becoming the norm. Capturing agent behavior is the baseline. What matters more is finding the issues inside those traces and feeding them into your eval systems so your agents keep getting better. We’re staying focused on developers building with agents and AI. If you’re one of them, tell us what we can do better. We want these numbers to keep climbing.
- ClickHouseSince 8 Oct 2026
Quelles sont les plus grandes news de l’année chez ClickHouse? On a tout dit sur DataGen au micro de Robin Conquet! Au menu : 🤖 Comment l'arrivée des agents IA impacte ClickHouse, la base de données et l’observabilité 🚀 La création d’une Agentic Data Stack avec le rachat de Langfuse, leader dans l’observabilité des agents IA 🧑💻 L'extension vers une plateforme data & IA complète (Iceberg support, CDC, streaming queries) L'entretien en intégral: youtu.be/EZ-dEA-mDGs
- DataPeepsSince 14 Sept 2026
Det er skræmmende, hvor meget man kan betale for data 😨 og hvor lidt man i realiteten kan ende med at få ud af det! Netop derfor tilbyder vi ubegrænsede leadlister - til en fast lav pris. Data skal betale sig selv tilbage i øget salg, sparet tid og bedre indsigter. Og så skal det være opdateret... Ellers giver det ingen mening at bruge penge på! Læs mere her: https://lnkd.in/ePYzzema
- DataPeepsSince 14 Sept 2026
Vil du gerne springe over, hvor gærdet er lavest? 🫏 Jeg har i alt for mange år manuelt håndteret salgsemner til outbound og marketing. Du ved, de der dage, hvor du sidder og VLOOKUP'er, CSV-ificerer, fjerner dubletter og krydser fingre for, at der ikke er fejl i dine efterhånden uendelige Excel-formler 😴💤 Og i den anden ende af kontoret, sidder der en utålmodig mødebooker eller salgschef og venter på deres opdaterede filer. Det løber mig koldt ned ad ryggen, når jeg tænker på alle de timer, jeg har brugt på det. En af vores kunder sparer 30 timer om måneden på datahåndtering. Det er næsten en hel arbejdsuge - hver måned! Derfor startede vi DataPeeps. Så du bruger din tid på salg – ikke på at gøre data klar til salg. DataPeeps.dk
- Dash0Since 22 Sept 2026
Trace #sampling allows you to harness the power of distributed tracing without breaking the bank, but also adds inaccuracies; let's talk about how you fix that. There are two commonplace ways of doing sampling: probabilistic #HeadSampling and #TailSampling. With probabilistic head sampling, it is like you throw a die for every trace, and keep the trace only if the die's face is low enough. With tail sampling, you collect the traces and keep those that are *interesting*, typically slow ones and erroneous ones. Head and tail sampling reduce the accuracy of your data, over or underestimating error rates and latencies of your services. (Btw, creating animations with LLMs is pretty addictive.) What can you do to reduce inaccuracies? You additionally record rate, errors and durations (RED) metrics for your services on the full data before sampling. With #OpenTelemetry, you can do trace sampling and #RED metrics collection with the same pipeline setup. Sometimes you also combine the two methods: tail sampling for interesting traces and probabilistic head sampling for baselines. However, processing the resulting data in alerting and dashboards is usually a challenge, while RED metrics make it easy. I wrote an article about this a little while ago that is still pretty relevant, and there is also an accompanying talk, which I fearlessly link in the main post: * https://lnkd.in/eKJCyuXy * https://lnkd.in/eRaczB4N What else do you do to improve the accuracy of trace sampling?
- ImmutaSince 23 Sept 2026
Today, Immuta becomes the Data Authorization Platform, the authorization layer for enterprise data. This is more than a new category or a new website. It reflects a fundamental shift in how people access data. I believe that by next year, the predominant way employees interact with enterprise data will be through AI harnesses. People will no longer search for a dataset, submit a request, wait for access, and then write a query. They will simply ask a question and an agent will determine what data it needs, where that data lives, and how to retrieve it. One question may generate hundreds of queries. Agents will delegate to sub-agents. And they will use whatever path is available to complete the task. They do not care whether the answer lives in a warehouse, a lakehouse, a dashboard, a SaaS application, an internal API, or a real-time data feed. They care about getting the answer. That changes the speed, scale, and risk of data access, and it changes the role Immuta must play. Historically, Immuta has been centered on policy enforcement inside the data layer: authoring policy centrally and applying it through the native controls of platforms such as Snowflake, Databricks, Teradata, Starburst, BigQuery, and others. That remains essential. But in the agentic enterprise, we must also become the policy decision point for data. For a dashboard, API, SaaS application, or data feed, the system holding the data may remain the enforcement point. But before returning anything, it should be able to ask Immuta: May this human or agent, acting for this person and for this purpose, access this resource right now? Immuta makes the determination. The application enforces the answer. That distinction is critical. Agents will use every door available to them, so enterprises need one policy model capable of governing access at every door—not just at the warehouse boundary. This is the beginning of Era Three for Immuta: agentic governance. We are bringing together policy enforcement, request workflows, agentic data access, declared intent, Universal Access Controls, and compliance evidence into one authorization layer across the enterprise data estate. Every request for data needs permission. Now there are millions. Read more about why we are making this shift and what we are building: https://lnkd.in/eify7Hs4 Open your data to AI. Not to everyone. #DataAuthorization #AgenticAI #DataSecurity #DataGovernance
- Inphinity ∞Since 23 Sept 2026
Dear partners, let's show your best work. The first Inphinity Partner Awards are here. More than 90 partners now make up our community. Behind that number are inspiring people building projects that help customers turn data and Qlik into action. We see your work and we’re proud to work with you. These awards celebrate what you’ve achieved: 🏆 𝗣𝗮𝗿𝘁𝗻𝗲𝗿 𝗼𝗳 𝘁𝗵𝗲 𝗬𝗲𝗮𝗿 overall business performance 🏆 𝗜𝗺𝗽𝗮𝗰𝘁 𝗼𝗳 𝘁𝗵𝗲 𝗬𝗲𝗮𝗿 customer transformation and innovation 🏆 𝗕𝗿𝗲𝗮𝗸𝘁𝗵𝗿𝗼𝘂𝗴𝗵 𝗼𝗳 𝘁𝗵𝗲 𝗬𝗲𝗮𝗿 strongest business growth We’ll promote every winner and show what makes them and their work stand out. But Impact of the Year needs your help. Think of the customer project you’re most proud of. Did it make a clear difference for your customer? Did you build an innovative solution with Inphinity? Share your solution with us and be the first Impact of the Year winner. Learn more about the awards and how to submit your project: https://lnkd.in/d3s8eKDh
- GoldrightSince 29 Sept 2026
Vor Kurzem habe ich mit einem Interessenten unseren ROI Calculator live im Call ausgefüllt. Zehn Minuten, einige Zahlen – und ein sehr stiller Moment auf der anderen Seite. Es ging um eine ziemlich normale Ausgangslage: mehrere hunderttausend Stammdatensätze, sieben Quellsysteme, ein Team, das laut eigener Schätzung „irgendwie“ viel Zeit mit Datenpflege verbringt. Wir haben gemeinsam die Zahlen eingetragen: - Anzahl der Datensätze, - Anzahl der Systeme, die integriert werden sollen, - geschätzter derzeitiger Zeitaufwand pro Woche für manuelle Datenerfassung und Fehlerbehebung, - Kosten für externe Berater, die immer wieder dieselben Aufräumarbeiten übernehmen, usw. Am Ende standen unter anderem vier wichtige Werte auf dem Bildschirm: - der Zeitpunkt, ab dem sich die Investition rechnet, - der ROI über drei Jahre, - die Kosten, die über drei Jahre entstehen, wenn sich nichts ändert, - und der Netto-Vorteil pro investiertem Euro. Keine der vier Zahlen war eine Schätzung von uns. Es waren seine eigenen Zahlen – nur endlich einmal zusammengerechnet, statt über IT-Budget, Fachbereich und Beratungskosten verteilt zu bleiben. Genau das ist für mich der eigentliche Wert der Berechnung mit Hilfe unseres ROI Calculators: nicht ein weiteres Argument für MDM, sondern die Rechnung, die intern sonst niemand aufmacht. Wer diese Rechnung für die eigene Systemlandschaft sehen will: DM oder Kommentar mit „ROI“ und ich schick den Link direkt zum selbst ausprobieren durch.
- DataFlintSince 24 Sept 2026
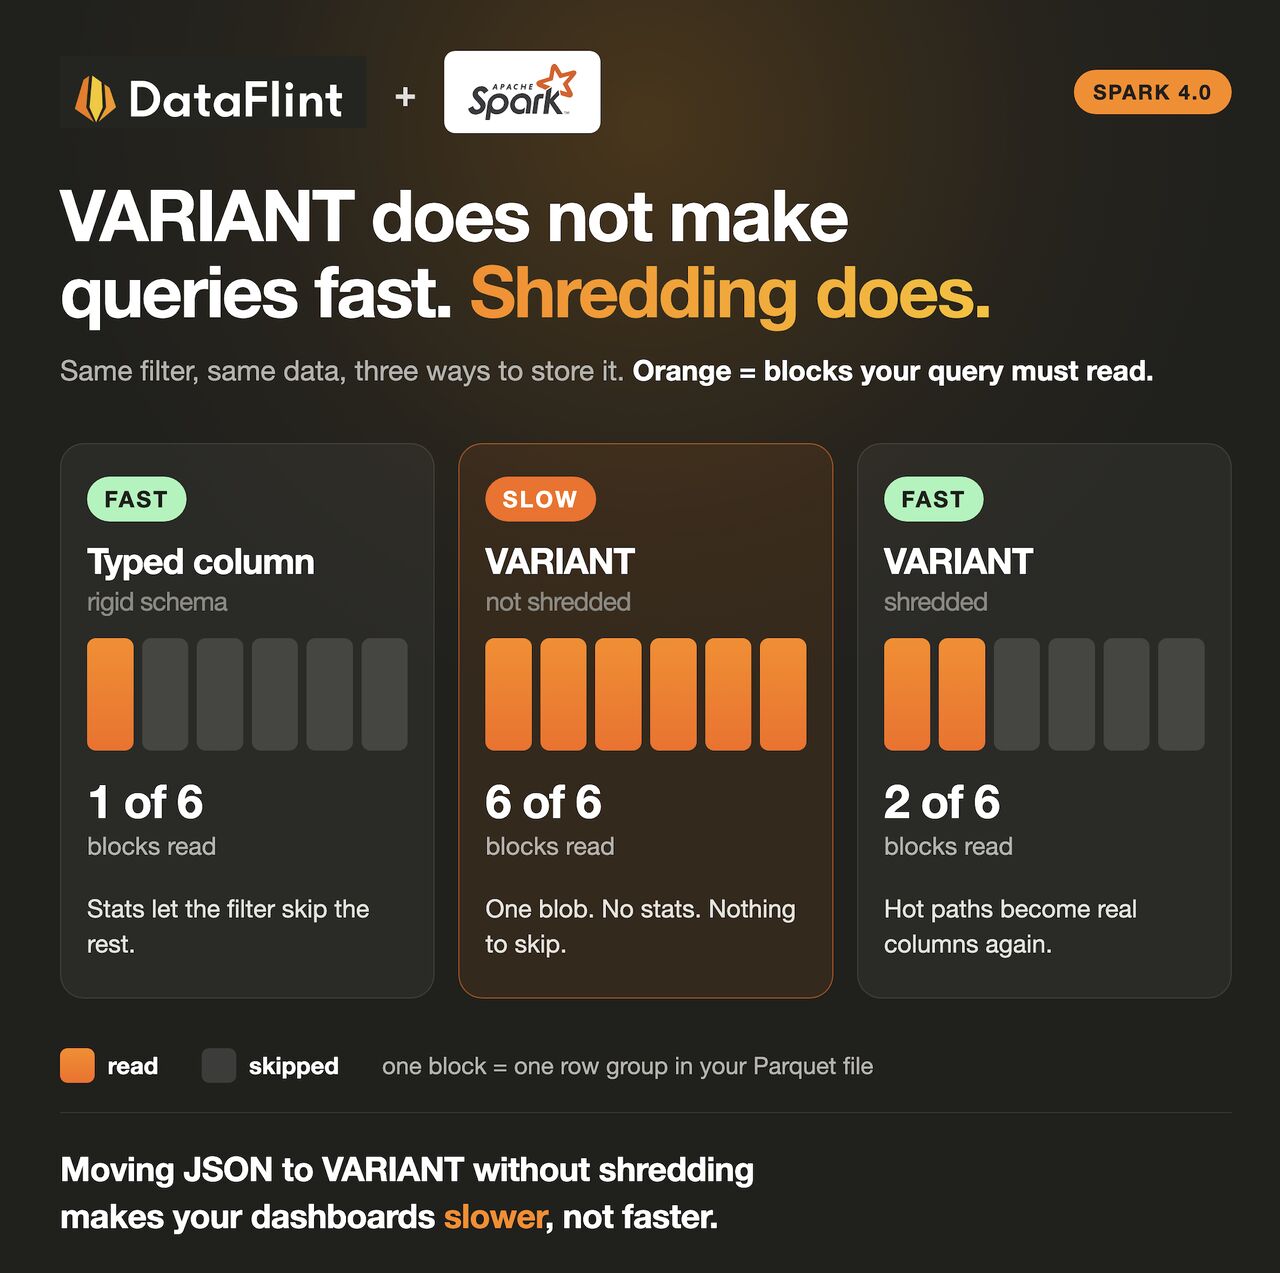
Apache Spark 4.0 gave you the VARIANT type. It will not make your queries faster. Shredding will. Every post about it says the same three things: no schema, no from_json, 8x faster. Teams are already planning to move their JSON columns over. VARIANT is stored as one binary blob inside Parquet. Parquet is fast for one reason. Every column keeps min and max values per row group, and a filter uses them to skip most of the file without opening it. A blob has no stats for the fields inside it, so your filter skips nothing. Every block gets read, then decoded. You stop paying to parse. You start paying to read. So what is shredding? At write time, Spark pulls chosen paths out of the blob and writes each one as its own typed column, next to the blob. user.id becomes a real BIGINT column with min and max stats. Whatever you did not choose stays in the binary leftover. That is how skipping comes back. The decision: ✅ Still on STRING plus from_json? Move to VARIANT. Clear win. ✅ Already have typed columns in your gold tables? Leave them alone. ✅ Putting VARIANT where people run queries? Shred it, then verify. If the value column still holds binary data for that field, it never got shredded and you are scanning blobs. VARIANT did not delete the cost of JSON. Shredding moves it out of your query path. #ApacheSpark #DataEngineering #Lakehouse
- EMARKSince 24 Sept 2026
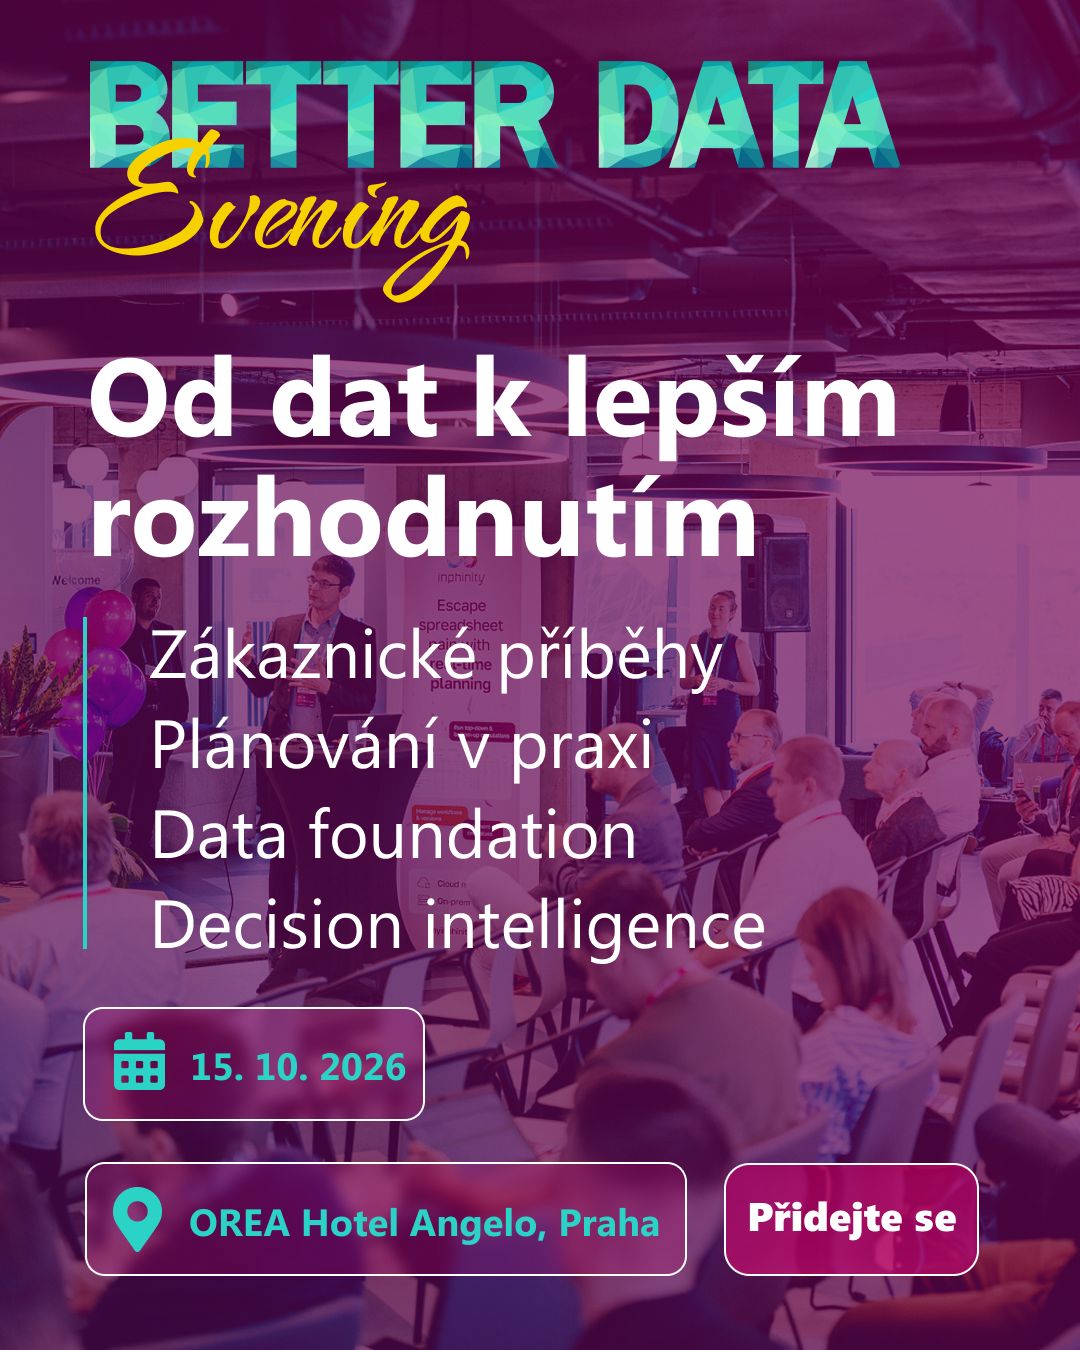
Pokud řešíte, jak z dat vytěžit zlato pro byznys, potkejme se 15. října v Praze na Better Data Evening!🤖 Letos jsme připravili program postavený hlavně na zkušenostech z praxe. Potkáte se s našimi experty i datovými lídry z firem, kde řeší data, plánování a AI v každodenním provozu. Dozvíte se například jak: - jak Národná banka Slovenska staví Open Data platformu - jak PPA Controll využívá AI chatbot nad interními daty a dokumentací - proč AI nad firemními daty někdy selhává a co s tím - jak přední světová antivirová značka dál rozvíjí Business Planning - jak v RS Group probíhá přestavba data foundation za plného provozu Po odborném programu budeme mít prostor pro otevřenou diskusi a networking během společné večeře. 📅 15. 10. 2026 📍 OREA Hotel Angelo, Praha Akce je určena pro: CEOs, CFOs, COOs, CIOs, CDOs, Head of Data, BI a další business, finance, planning a operations leadery. Budu rád, když se na místě potkáme! ☺️ Registrace je zdarma: https://lnkd.in/dNKPxRsh
- EMARKSince 24 Sept 2026
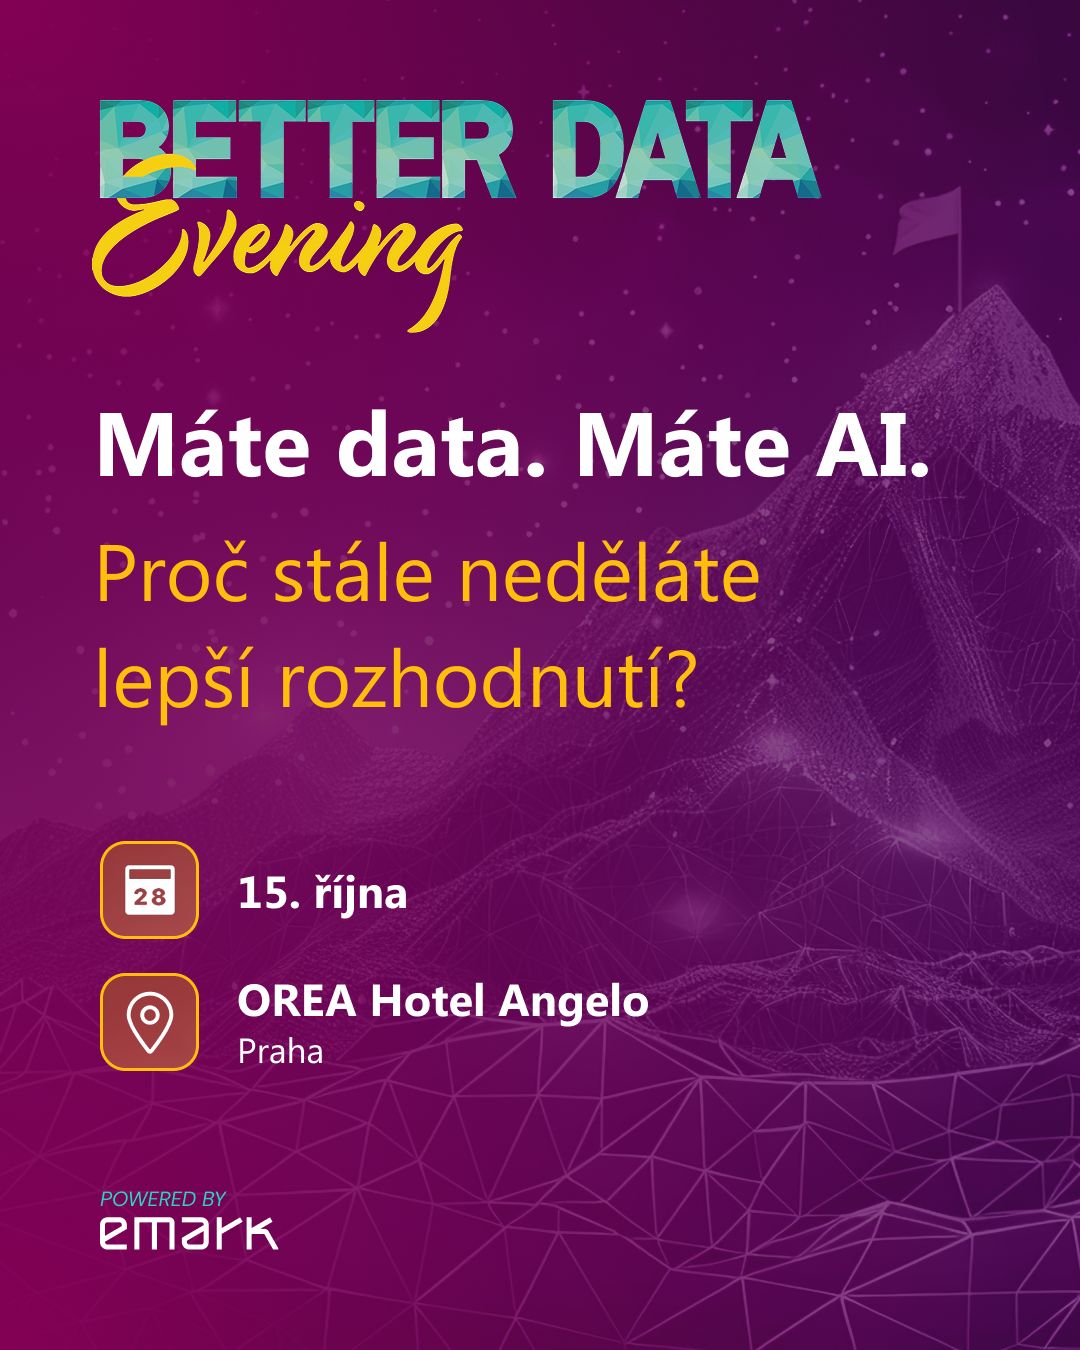
Máte data. Máte AI. Proč stále neděláte lepší rozhodnutí? To je otázka, kterou otevřeme na konferenci Better Data Evening, 15. října v Praze. Čekají vás konkrétní projekty z praxe, pohledy lidí z vedení firem i diskuse o tom, kde technologie pomáhá a kde samotná technologie nestačí. A nebudeme zůstávat jen u diskuse. Ukážeme čtyři konkrétní projekty z praxe: 👉 Národní banka Slovenska – připravovaná otevřená datová platforma 👉 PPA Controll – AI chatbot v Microsoft Teams nad interními daty 👉 přední světová antivirová značka – další rozvoj plánování a jeho role v řízení firmy 👉 Sellier & Bellot – propojení obchodního a finančního plánování Kromě panelové diskuse Better Decisions tak uvidíte, jak se data, plánování a AI řeší v různých typech firem a situacích. Better Data Evening 15. 10. 2026 | OREA Hotel Angelo, Praha Pokud řešíte data, plánování, AI nebo digitální transformaci, potkejme se v Praze. Podívejte se na celý program 👉 https://lnkd.in/dZ_c2RMr
- C&FSince 14 Sept 2026
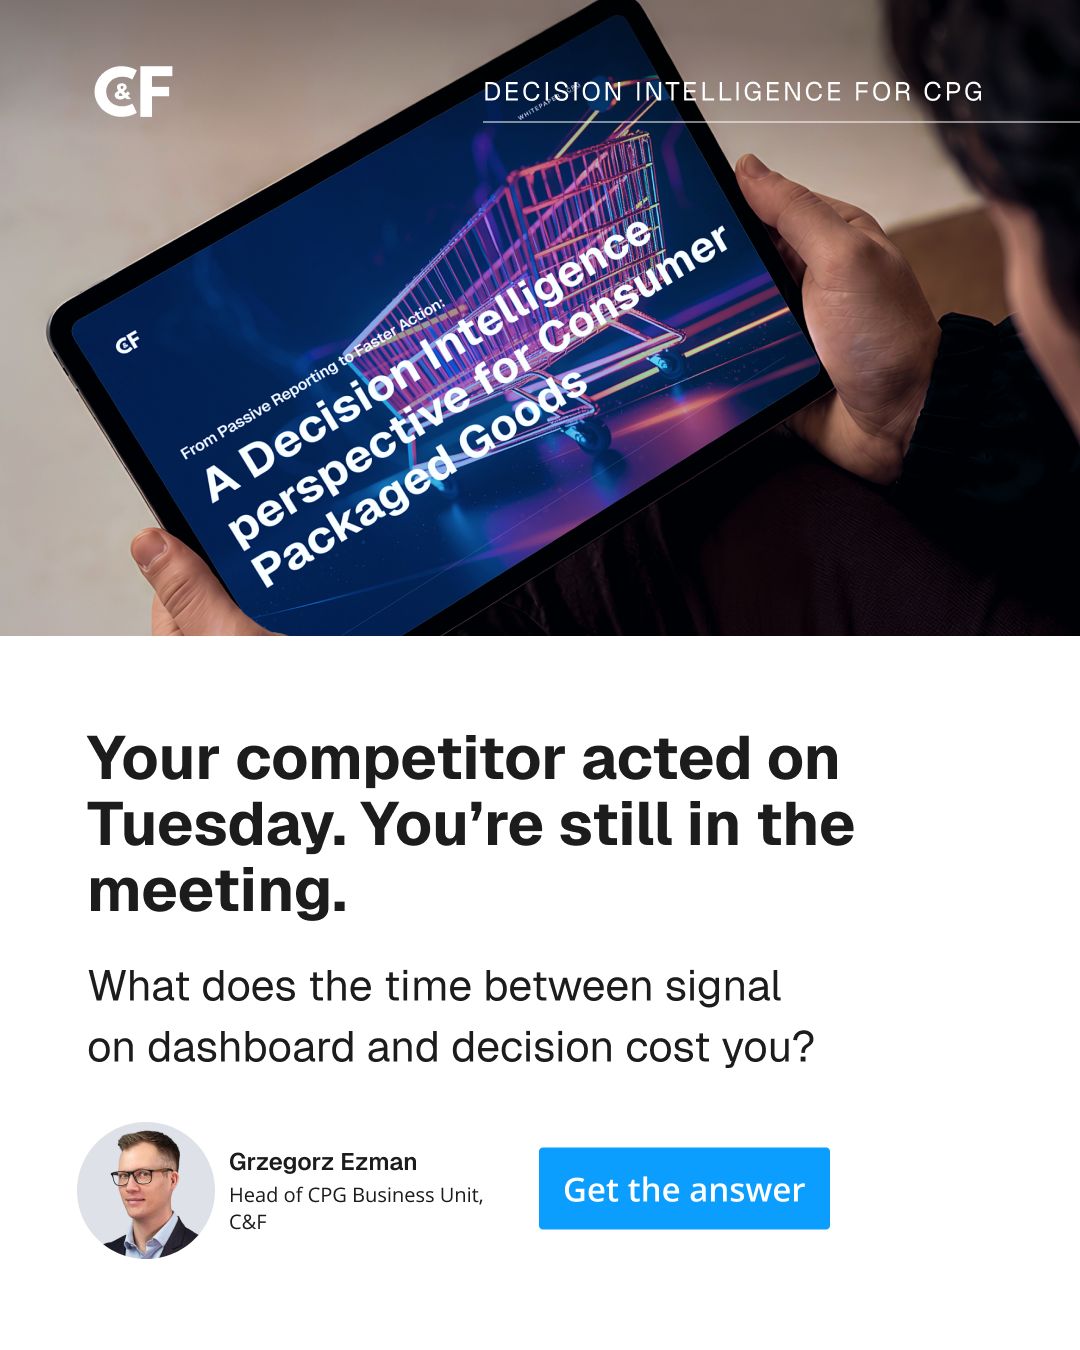
One of the first things I would look at in a CPG Decision Intelligence initiative is a simple decision inventory: what decisions are made repeatedly, who owns them, what data supports them, and what is the business impact of getting them wrong. In CPG, many of these decisions sit around pricing, promotions and short-term supply. But before getting excited about AI or recommendations, the basics need to work: governed data, consistent KPI definitions across functions, and enough traceability to understand how a recommendation was produced and why. For me, this is where the real value of Decision Intelligence starts. Not with another dashboard, but with reducing the time between a signal, a decision and an action. In our new white paper, we look at how to approach this step by step, what to assess first, and where Decision Intelligence can start creating value in CPG: https://lnkd.in/dkYNNRFr
- InfodeskSince 30 Sept 2026
Quality intelligence in life sciences is going through a major shift! Earlier this week I shared a article relating to our thoughts surrounding this above statement. As several of you asked for a Post Summary here you go. Historically, most quality intelligence programs were heavily focused on inspection readiness, enforcement monitoring, and reactive compliance activities. Important work, of course. But that definition is starting to feel too narrow for the complexity organizations are managing today. What’s emerging instead is a broader view of quality intelligence as a strategic operational capability, one that connects regulatory signals directly to risk management, governance, and enterprise decision-making. And I think that evolution matters. Because regulatory change only creates value when organizations can actually operationalize it. Not just monitor it. At a recent industry discussion with leaders including UCB, one theme came up repeatedly: The organizations building mature quality intelligence programs are moving beyond surveillance toward full lifecycle management of regulatory change. That includes: ➡️ Monitoring signals ➡️ Assessing impact ➡️ Assigning ownership ➡️ Coordinating implementation ➡️ Tracking decisions and outcomes In other words, intelligence is becoming tightly connected to execution. A few other observations stood out: • Quality intelligence and regulatory intelligence are increasingly converging, even if they still serve different operational purposes. • Governance and cross-functional coordination are becoming critical differentiators. • AI is helping reduce noise and accelerate monitoring, but human expertise remains central for interpretation and risk assessment. • Many organizations are still operating with surprisingly lean teams, which makes structured workflows and strong SME networks even more important. One point I found especially relevant: The biggest risk often isn’t the signal itself. It’s the organizational handoff failures that happen afterward. Missed ownership. Delayed assessments. Lack of accountability. Disconnected workflows. That’s where strong intelligence activation processes become essential. We explored this evolution in more detail here, including key takeaways from leaders actively building modern quality intelligence programs: https://hubs.li/Q04yjx7B0 Curious how others are seeing this evolve inside their organizations. Is quality intelligence still primarily reactive and inspection-focused? Or is it becoming more integrated into strategic decision-making and operational governance? #QualityIntelligence #RegulatoryIntelligence #LifeSciences #Compliance #AI #Pharma #QualityAssurance
- CollibraSince 1 Oct 2026
Cisco, Intuit, Workday, and ServiceNow are all building versions of the same thing: a control layer for AI agents. And they're building it in from the start. But for most enterprises, the bigger risk isn't an agent going rogue. It's an agent doing exactly what was asked, confidently, on data and context nobody governed. The agent isn't going rogue. It's guessing, and it has no way to know it's guessing. Our latest research with The Harris Poll found that more than half of data and AI decision-makers spend significant staff hours manually reviewing and correcting agent output before it goes live. That's the hallucination tax. And it grows with every agent you put in production. Monitoring isn't enough. Enterprises need visibility into what agents are doing, governed context for the decisions they're making, and controls that can be enforced at runtime. https://lnkd.in/egddh4KA
- DepositPhotosSince 21 Sept 2026
🦾 AI teams shouldn’t have to spend more time fixing their data pipeline than building their AI systems. Yet I keep seeing teams dealing with fragmented datasets, outdated exports, inconsistent formats, and manual data preparation. The result is predictable: More time spent cleaning and organizing data. Less time spent building and improving AI models. AI-ready data should be structured, scalable, and aligned with the specific requirements of the model and use case. There’s a better way to approach data sourcing. 💬 If your team is working on AI development and looking for reliable, customized training data, feel free to reach out.
- FraymSince 21 Sept 2026
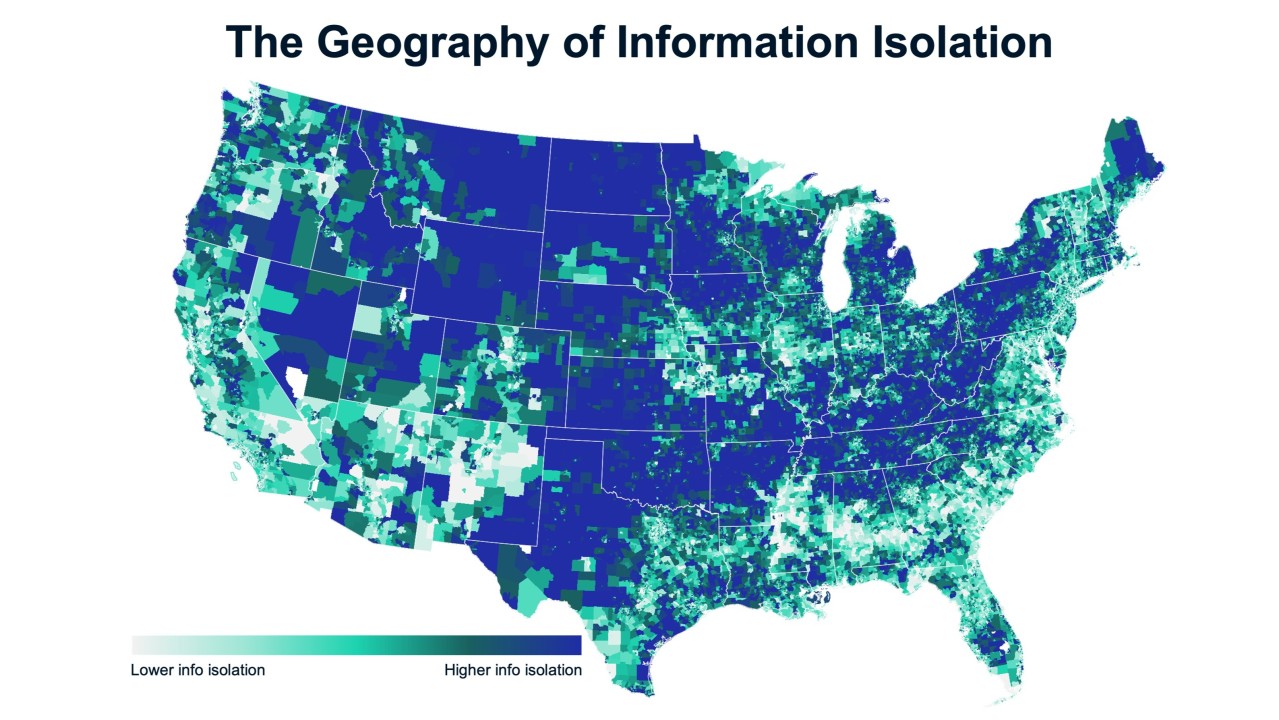
People blame politics for vaccine resistance, but data show an older American’s media diet predicts refusal just as strongly. #PublicHealth #VaccineHesitancy #DataAnalytics #HealthcareMarketing #HealthData




Other LinkedIn formats
Watch the companies you care about.
Filter every ad by industry, country, format and network, and get alerts when a company you watch starts running new ads.