LinkedIn image ad examples
0 image ads are live on LinkedIn right now, from 406 companies. Browse real ones, filtered by industry.
- KlusterSince 3 Jul 2026
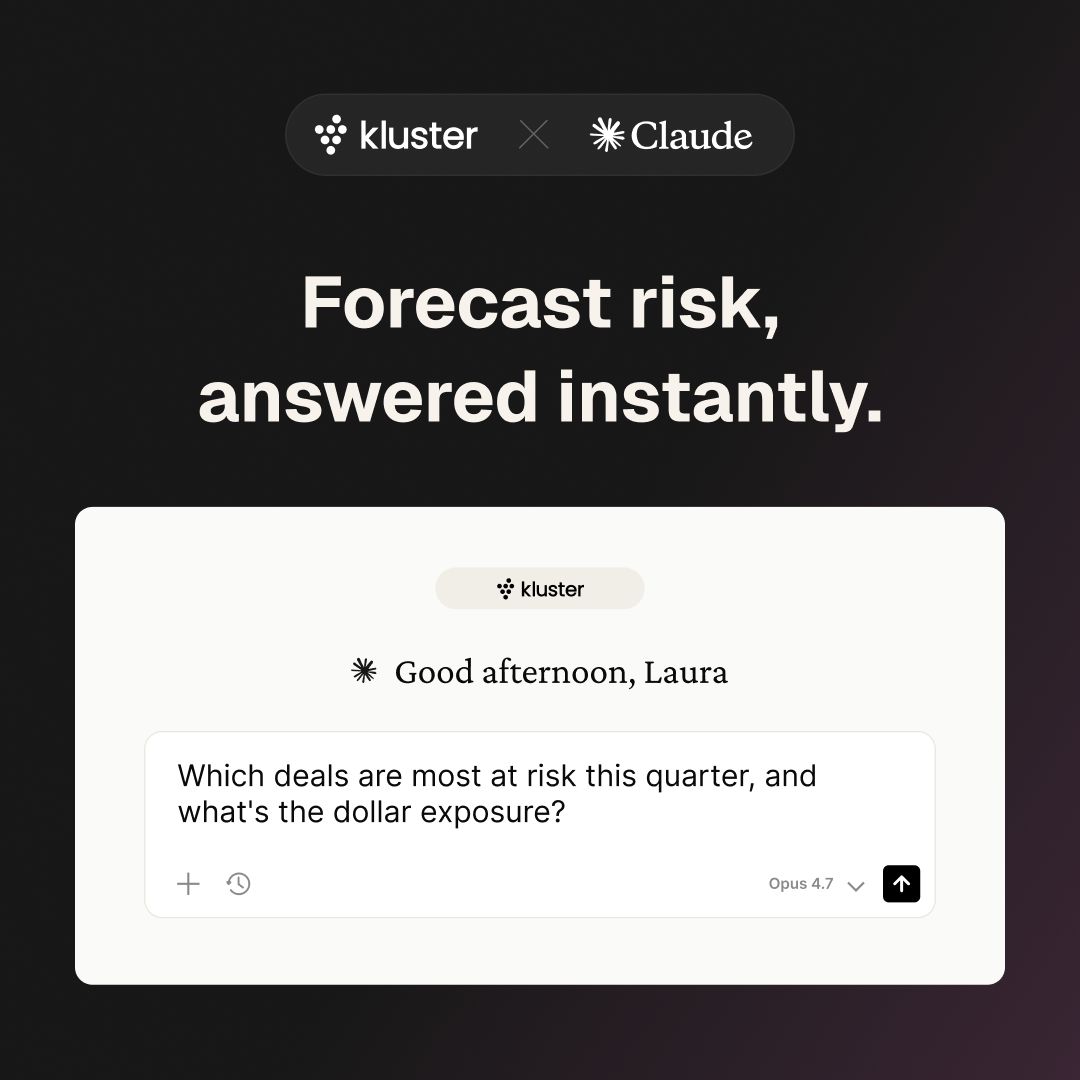
What's the biggest risk to your forecast this quarter, and which deals is it sitting on? Ask Claude. Get the answer in seconds, grounded in your own pipeline. Kluster maps your CRM into a revenue data layer Claude can reason over, so you walk into your next board meeting with the answer already in hand.
- Consumer EdgeRecorded 20 Sept 2026
When leadership asks "what changed this quarter?", the teams with Consumer Edge already know. They benchmark against competitors weekly: market share, wallet shifts, retention. They see who's staying, who's switching, and where spend is moving. And when a board question or market event demands a deep dive, the data is already there. Investors use it to forecast results ahead of earnings. Brands use it to track share, size markets, and spot shifts before competitors do. Smarter strategy. From accurate, real-time consumer spending insights. Get to know Consumer Edge.
- GableSince 17 Jul 2026
Meet Dave. His one line of code is still costing your bank money.
- GalileoSince 1 Sept 2026
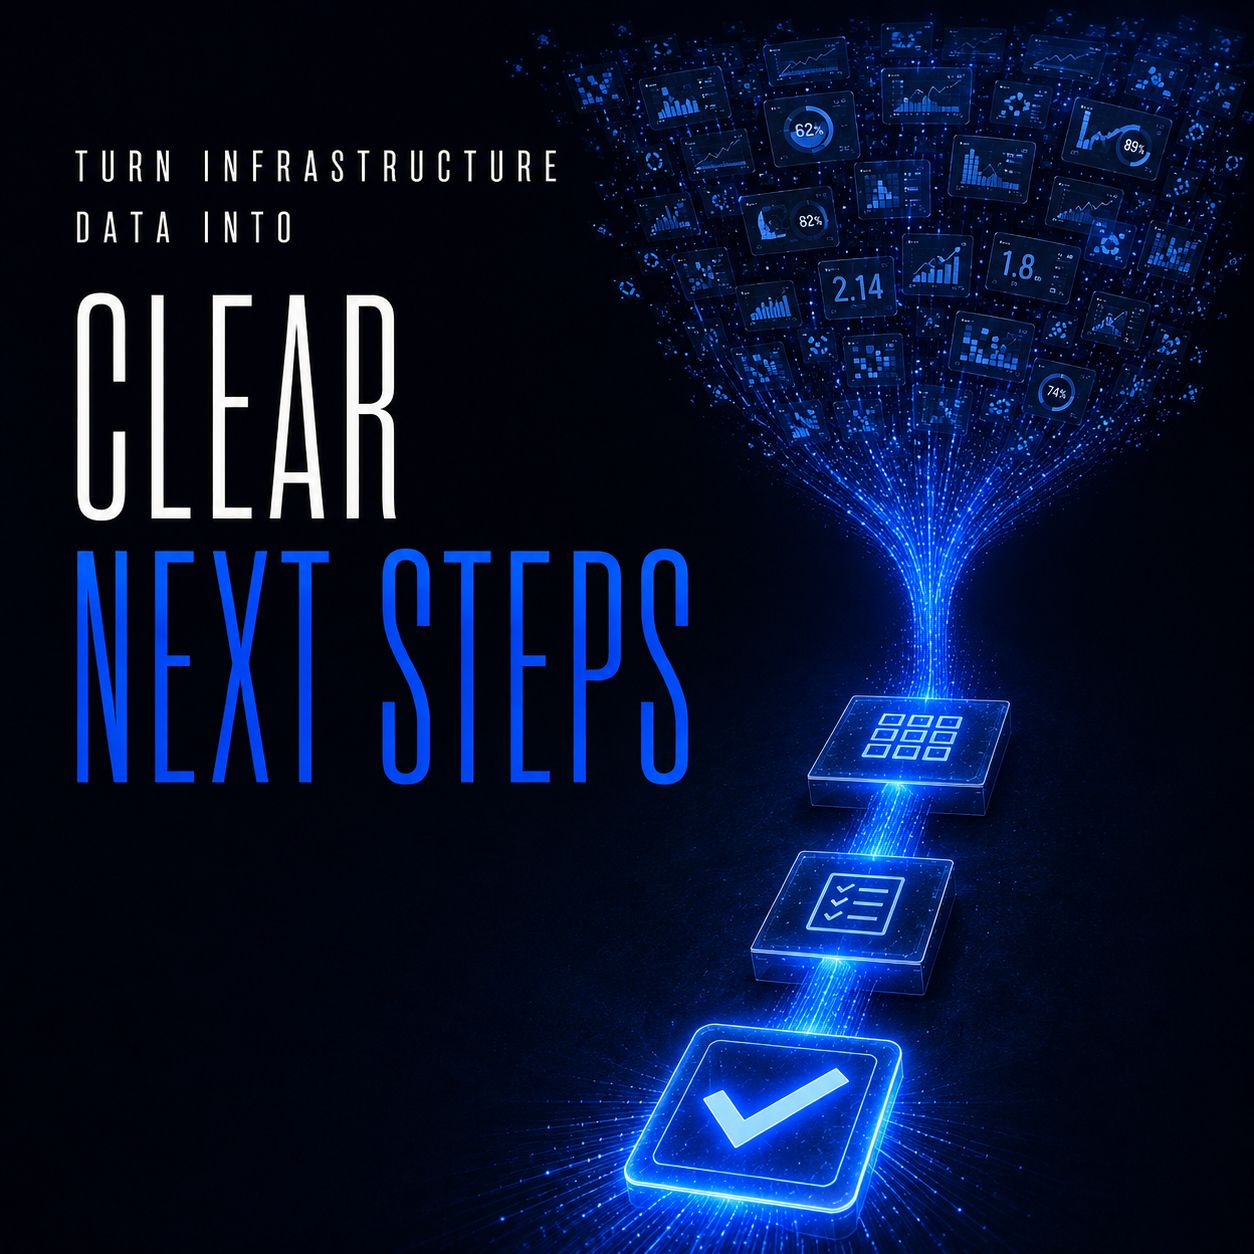
At Info-Tech LIVE, many IT teams told us they struggle with fragmented monitoring tools and limited historical visibility across their environments. When performance issues occur, teams are often forced to jump between multiple dashboards, alerts, and reporting tools just to identify the root cause. Galileo brings infrastructure, storage, virtualization, cloud, and application visibility together in a single platform, helping teams troubleshoot faster, reduce complexity, and spend less time chasing alerts. See everything. Solve ANYTHING.
- GalileoSince 1 Sept 2026
At Info-Tech LIVE, we spoke with IT leaders looking for better ways to understand performance trends, forecast capacity needs, and eliminate infrastructure blind spots. Galileo combines real-time observability with unlimited historical visibility, helping teams move from reactive monitoring to proactive decision-making.
- Eppo by DatadogSince 14 May 2025
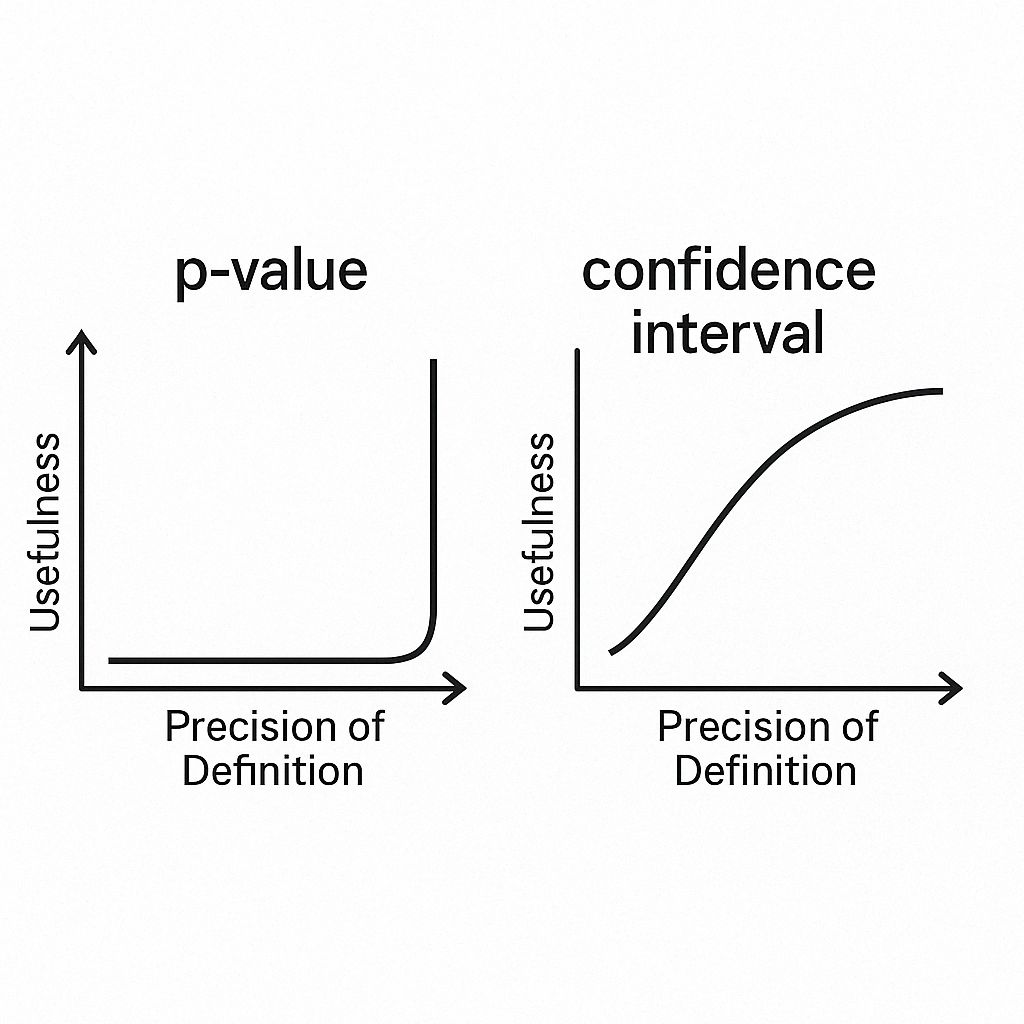
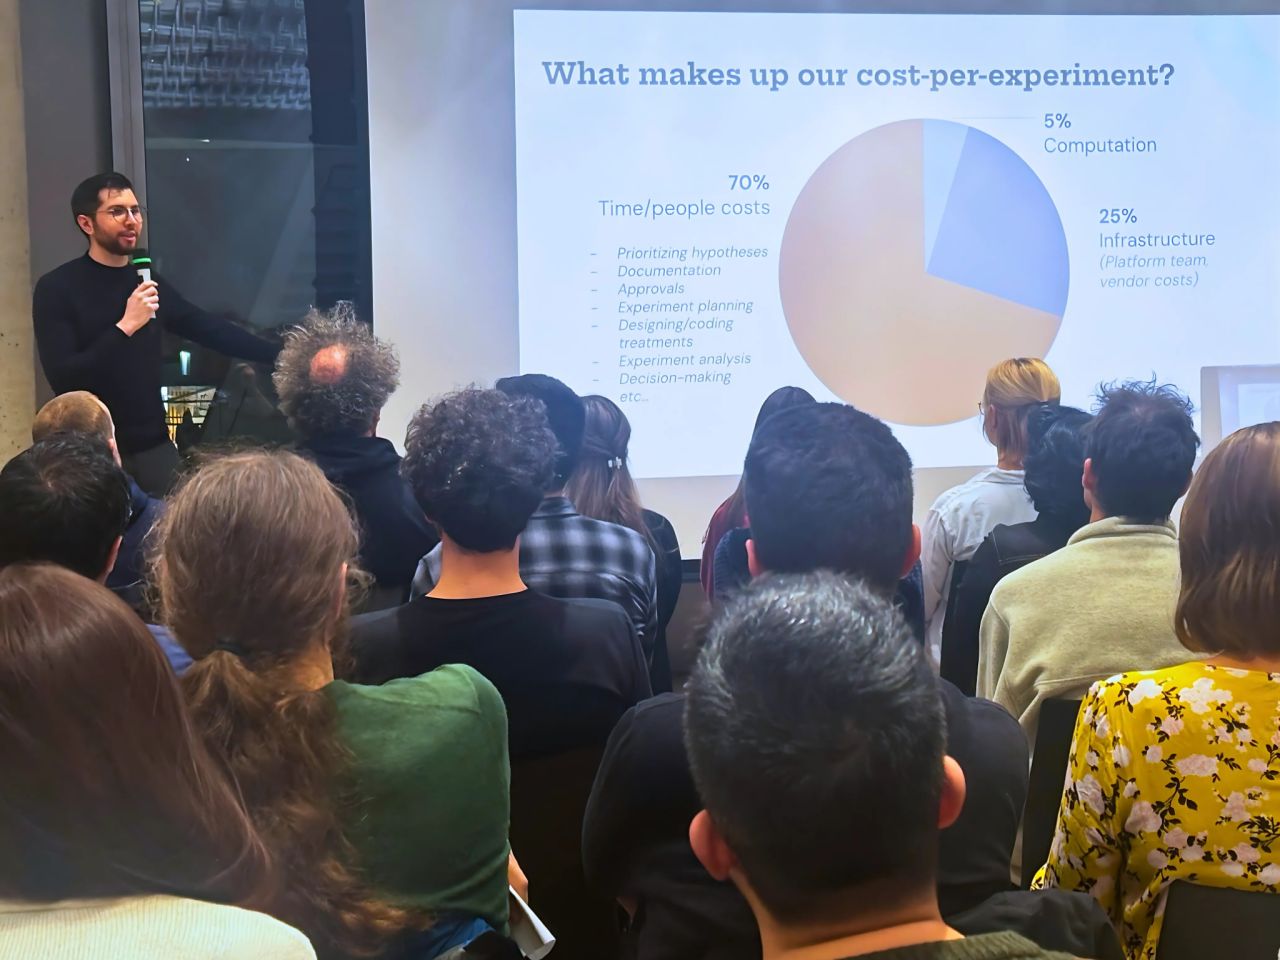
We don't show p-values on the main experiment results screen in Eppo. (They're ever-so-slightly hidden in a more advanced "statistical details" tab) The "problem" with p-values, insofar as most businesses have plenty of non-statisticians running experiments, is that they have a very nuanced and precise definition. Academic researchers get the definition wrong all the time. (There are several quite embarrassing studies demonstrating this) And once you are even a little bit incorrect in your definition, assessing the p-value itself is a totally useless exercise at best. Sometimes it's downright harmful. If you want to evaluate which statistical concepts are worth explaining to your coworkers, imagine drawing a "precision-usefulness curve" for each - as Giorgio Martini once suggested to me. I.E., how much usefulness does this [concept/statistic] lose once your definition is no longer 100% correct? The p-value has a quite unforgiving one, in my experience. Confidence intervals, on the other hand, seem far kinder. Yes, they also have a nuanced definition that very few get right. (although they are maybe one step easier since we don't have to explain them being conditioned on the null) But even with a naive interpretation (usually a probablistic one that sounds more like a Bayesian credible interval - e.g. "there is a 95% chance the true value is in this range"), stakeholders can still walk away with reasonable intuition about what their experiment results suggest. Even a simple three-word intuition like "range of uncertainty" or "the experiment's precision" will likely guide sound decision-making. I've been taken with this as a simple little "precision-usefulness" mental model ever since Giorgio mentioned it - a good consideration for folks who care about making experimentation more accessible to teams throughout our orgs. (graphs are illustrative/made up by ChatGPT and not necessarily my exact opinions 😆)
- Eppo by DatadogSince 14 May 2025
Had a fantastic time last night speaking at the Berlin Experimentation Meetup - well over 100 experimentation pros joined us (several flew in from all around Europe!) and packed the room. A few highlights from my talk: 💡 Presented a framework that distills the job of an experimentation leader into 3 main objectives 💡 Made the case for platforms and processes that enable self-service for the end users in our orgs 💡 Shared about a dozen ideas from Eppo and beyond on how to accomplish this by giving users empowerment, guidance, and time back As I said multiple times over the course of the day, I'm not sure that there's a US city where we could get 130 registrants for an experimentation meetup, especially with only light promotion. There's a very real energy and enthusiasm for experimentation here in Berlin and I appreciate everyone in that room for helping lead the charge! It was such a pleasure getting to meet so many of you. Many thanks to Marcel Toben and Patrick Gunia, PhD for the invite and for what you've organized here, and to Nils Stotz on the photo credit and helping host me yesterday. ⏩ Want to hear some hot takes and practical ideas on scaling your experimentation program at your next event? I think this talk is crazy ready for an encore... DM me and let's make it happen :)
- FusionChartsSince 22 Sept 2025
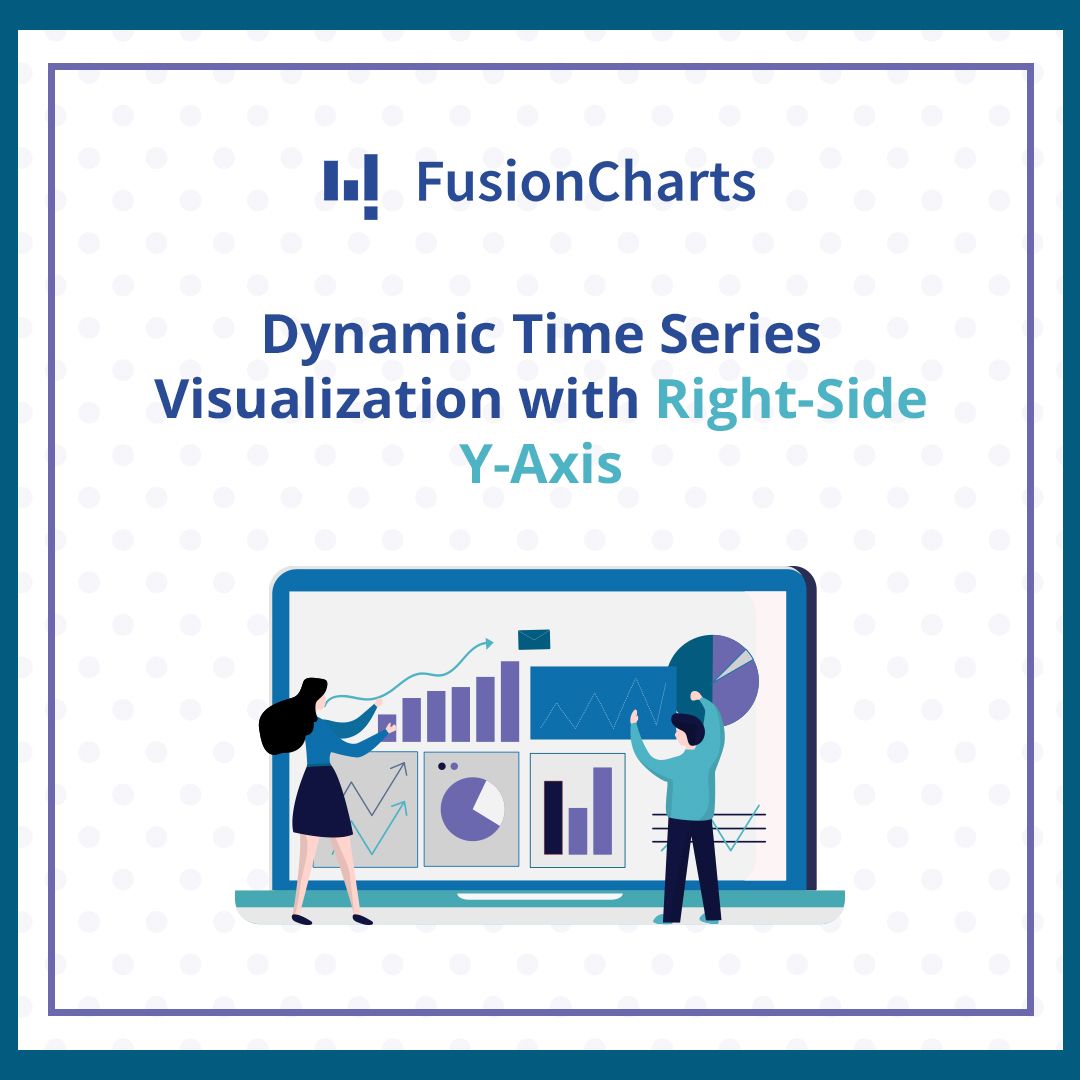
Gain new perspectives on data visualization with FusionTime's ability to place the Y-axis on the right side of a canvas. Explore how this feature can enhance your data clarity!👉 https://bit.ly/3XmcvtO #DataVisualization #JavaScript #WebDevelopment #DataAnalytics
- FusionChartsSince 22 Sept 2025
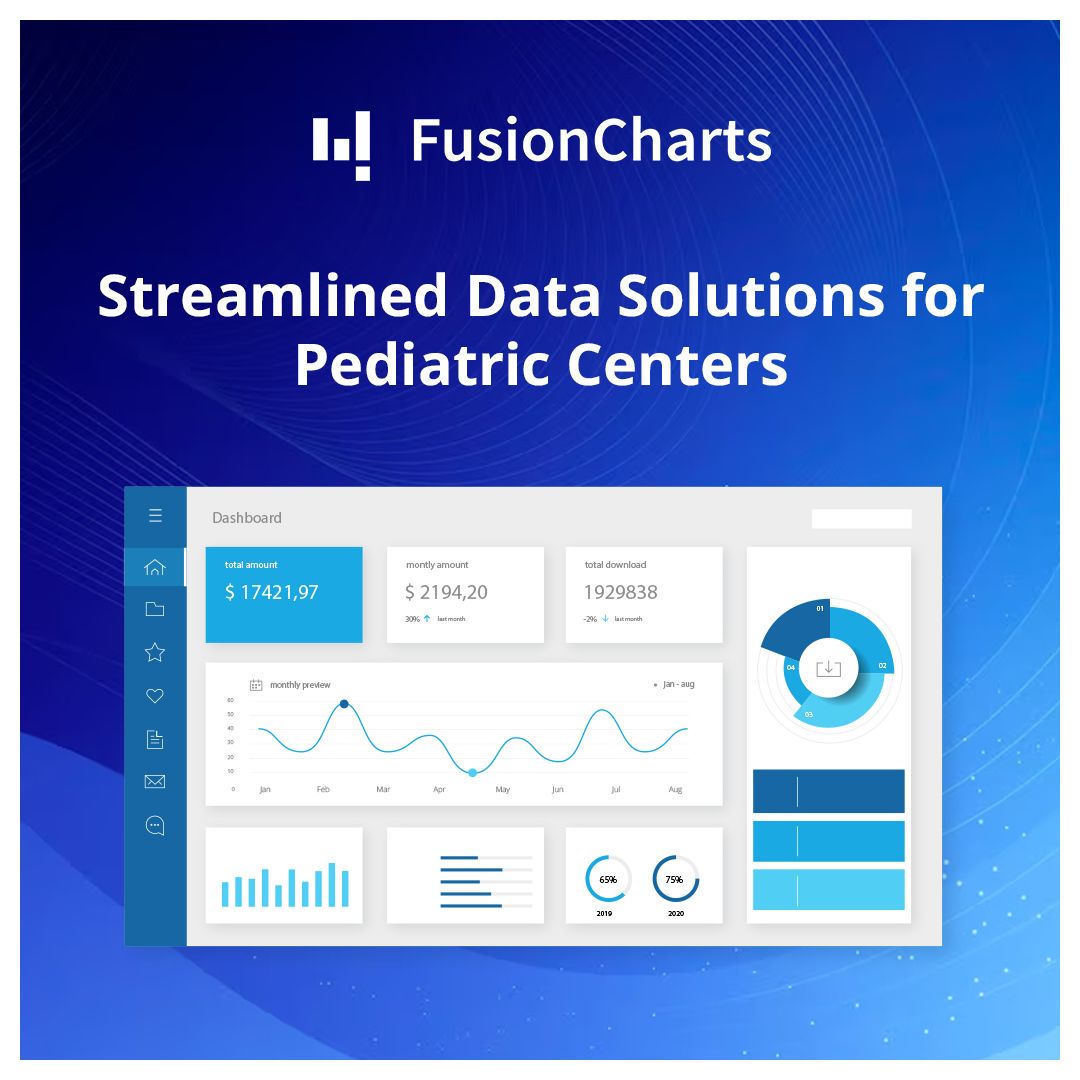
Transform pediatric care with our pediatrics center dashboard! Access real-time data and powerful visuals to make better decisions for patient outcomes. Learn more about its features and benefits.👉 https://bit.ly/3XnPwNA #FusionCharts #Pediatrics #HealthcareDashboard #ChildHealth #MedicalAnalytics #HealthTech
- Genesis ComputingRecorded 20 Sept 2026
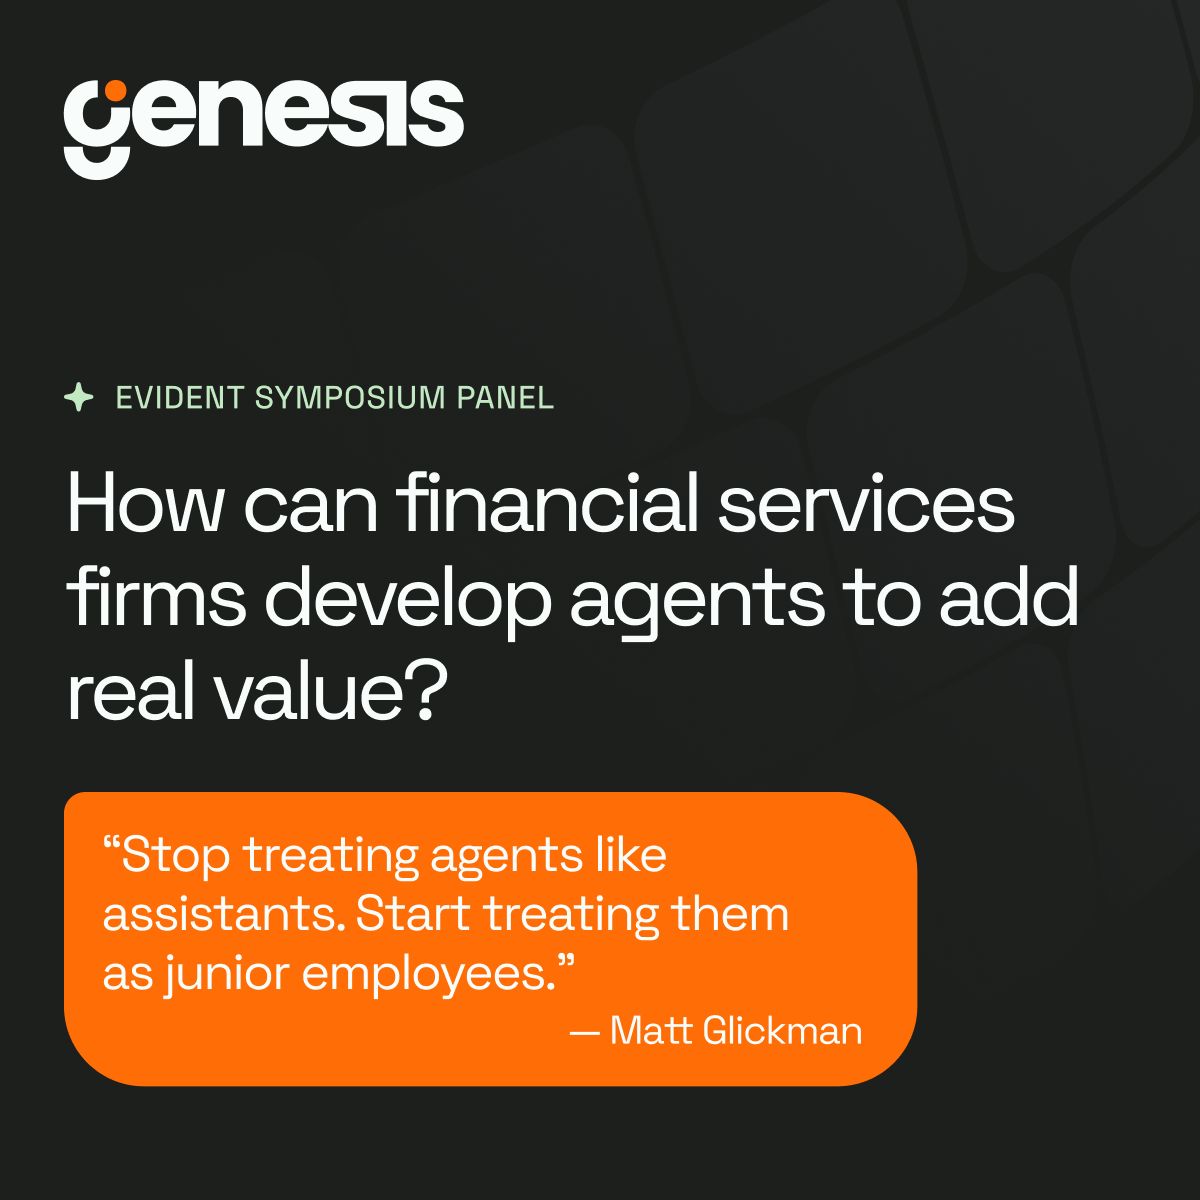
Most institutions treat agentic AI like a coding assistant, generating scripts that humans review and deploy. That's incrementally faster, not transformational. 𝗚𝗲𝗻𝗲𝘀𝗶𝘀 𝗮𝗴𝗲𝗻𝘁𝘀 𝗼𝗽𝗲𝗿𝗮𝘁𝗲 𝗺𝗼𝗿𝗲 𝗮𝘂𝘁𝗼𝗻𝗼𝗺𝗼𝘂𝘀𝗹𝘆: they ingest data, reconcile discrepancies, maintain pipelines, detect failures, and implement fixes, with human intervention only when necessary for routine operations. At Evident Symposium, hear Matt discuss this operational model alongside executives from BNY, JPMorgan Chase, Rogo, and BMO who are navigating similar transformations. Learn more here 👉 https://bit.ly/48VQY12
- FT LocationsSince 7 Oct 2025
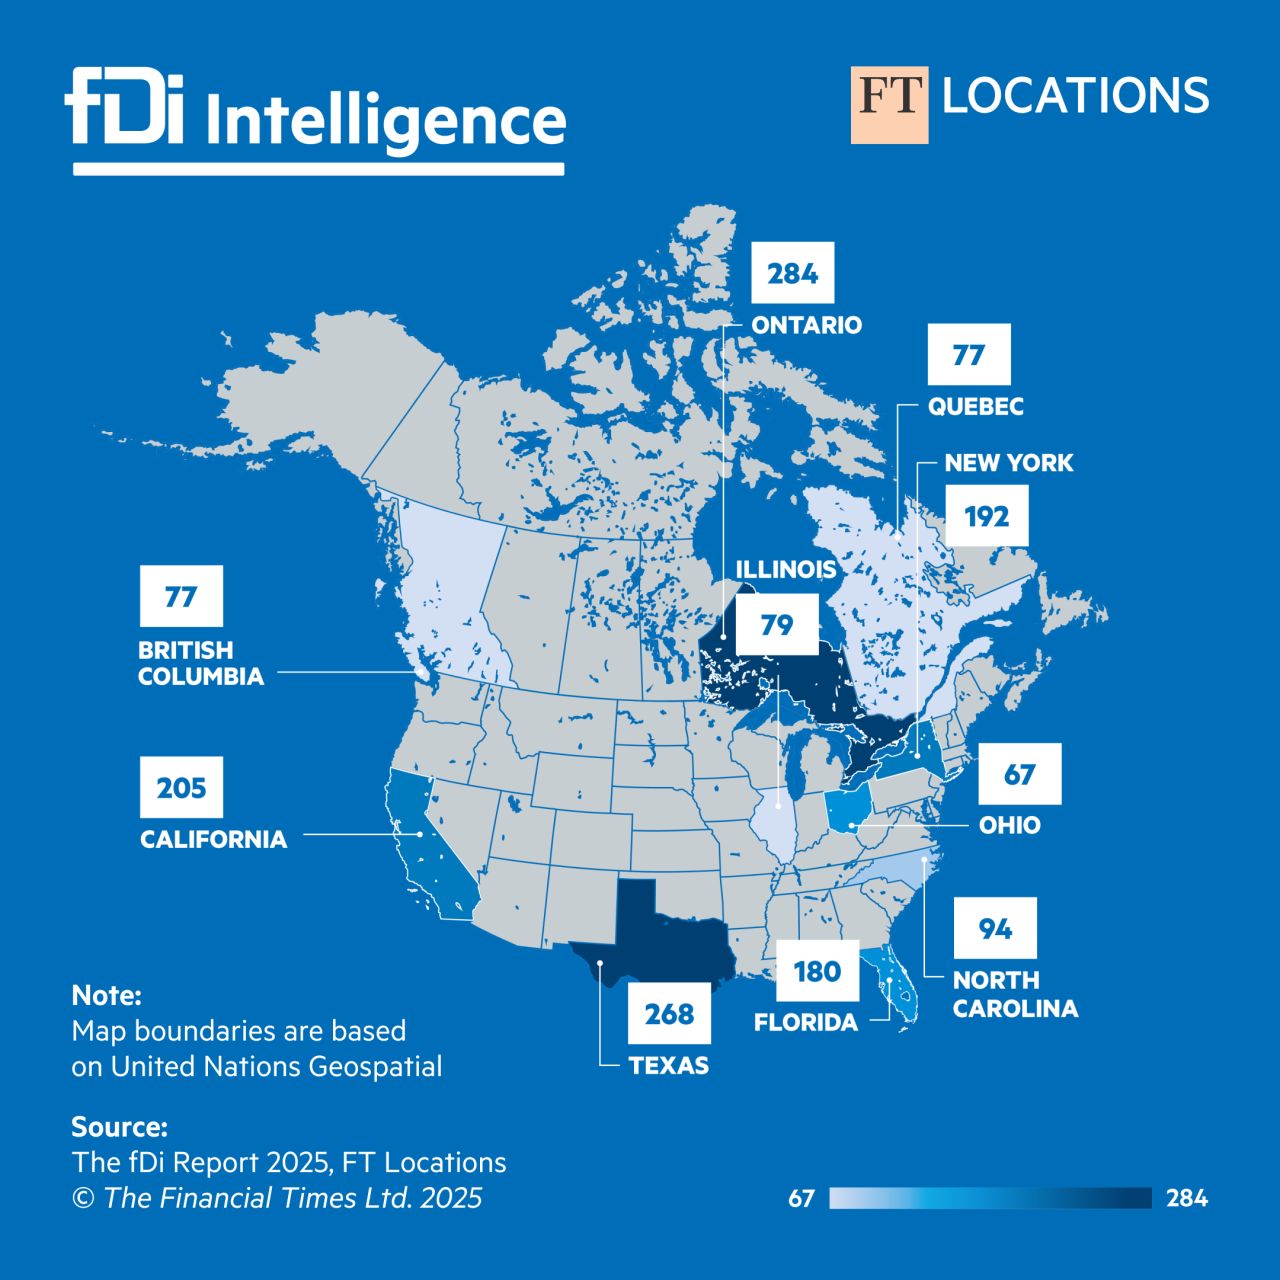
🗽 US Regions Power North America's Record FDI Boom Texas. California. New York. US states are dominating the foreign direct investment (FDI) landscape in 2024—and they’re just getting started. ➡️ Texas locked in 268 announced FDI projects, a close second to Canada's leading province. ➡️ California secured 205, holding strong as a global innovation magnet. 🚀 Wisconsin is the breakout story of the year—49 projects and gaining momentum. But the top spot? 🍁 Ontario led the entire continent with 284 announced FDI projects in 2024. Across North America, FDI is in full acceleration mode: 📈 +21.5% in project count year-on-year 💰 $268.2bn in capital investment (+61.1%) ⚙️ Semiconductors alone drew $74.6bn—that’s 27.8% of all pledged capital. 📥 Download your copy of The fDi Report 2025 now. #FDI #EconomicDevelopment #Texas #California #Wisconsin #NewYork #Ontario #Semiconductors #fDiReport2025 #InvestmentTrends #USA #NorthAmerica
- FT LocationsSince 7 Oct 2025
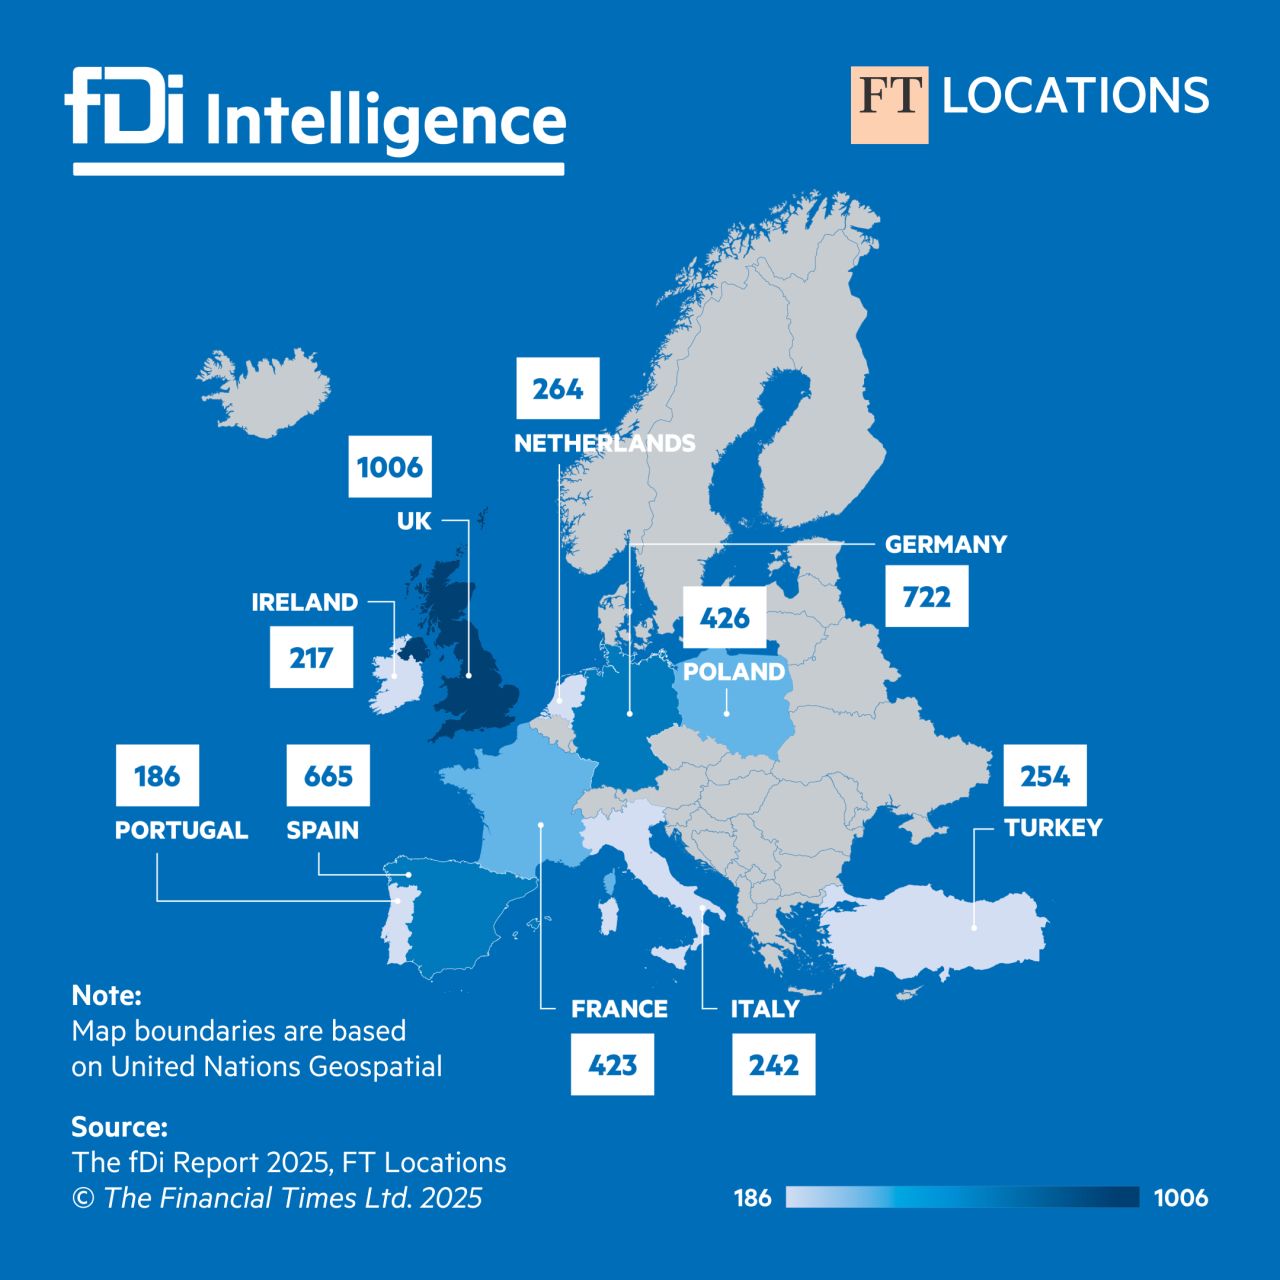
🌍Europe’s FDI Powerhouses in 2024: The UK Leads the Charge Foreign direct investment (FDI) in Europe surged in 2024—and the UK is at the forefront of this transformation. 📍 UK: ➡️ 1,006 announced projects 💼 Headlined by Amazon Web Services’ £8bn data centre investment 💰 $89.1bn in capital investment — 28.6% of all FDI into Europe - Germany followed with 722 projects - Spain ranked third with 665 projects - Poland continued its rise as a regional tech and manufacturing hub with 426 projects 💡 The UK’s rise is powered by a wave of mega-projects, making it the continent’s top FDI destination and a bellwether for global investor confidence. 📊 From digital infrastructure to advanced manufacturing, Europe is regaining momentum as a global investment magnet. 📥 Get the full picture in The fDi Report 2025—with sector trends, market rankings, and regional breakdowns across Europe. #FDI #Europe #UK #Germany #Spain #Poland #fDiReport2025 #InvestmentTrends #ForeignInvestment #EconomicDevelopment #GlobalBusiness
- Fujitsu SoftwareRecorded 20 Sept 2026
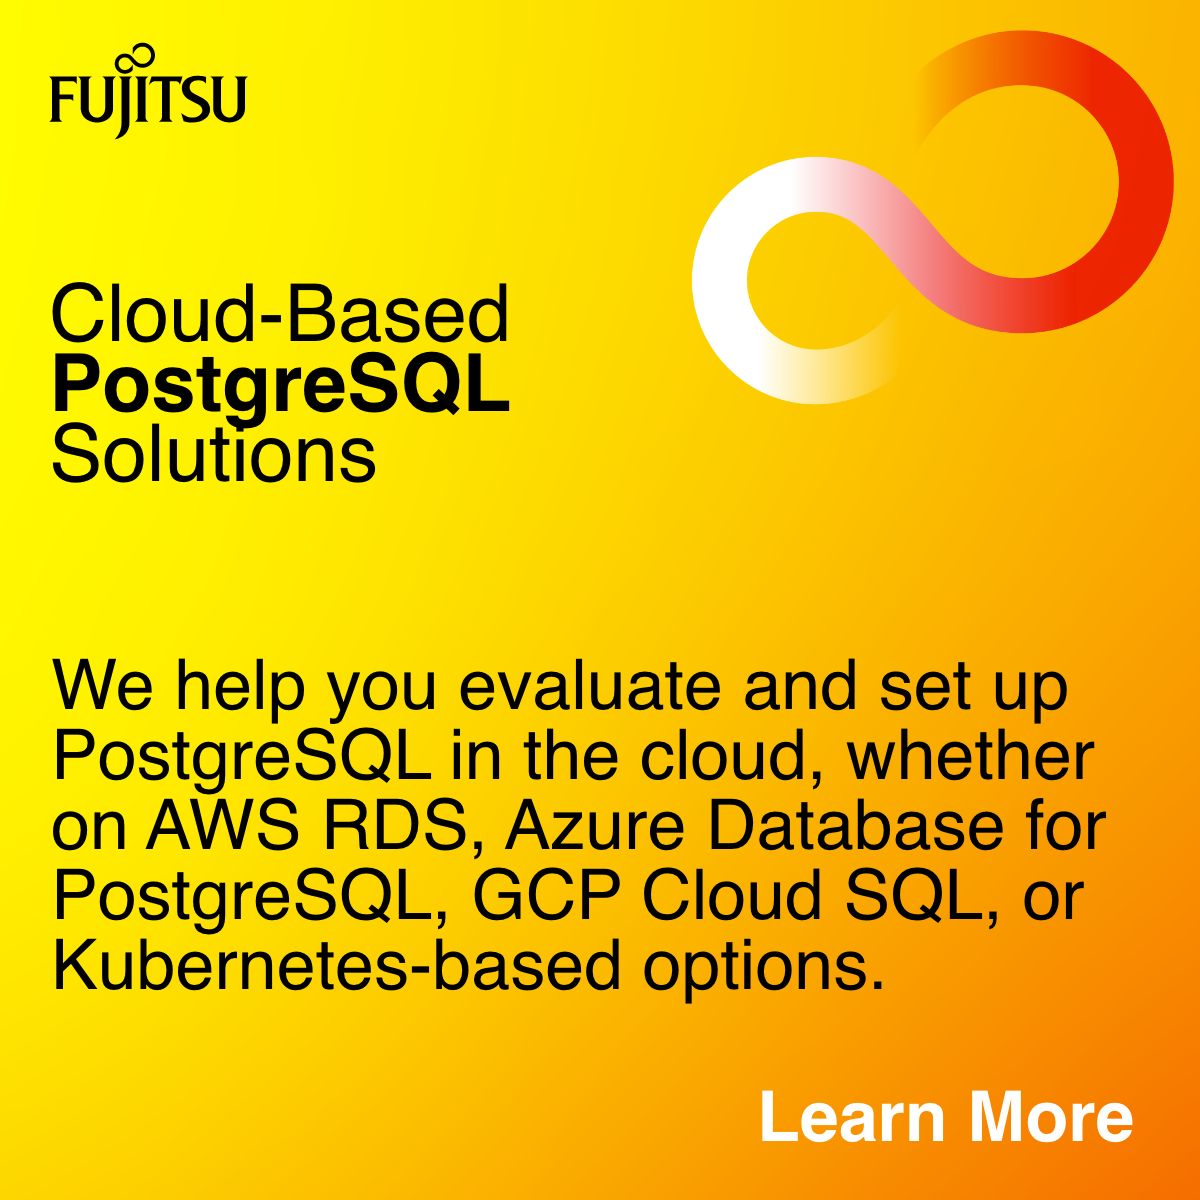
We help you evaluate and set up PostgreSQL in the cloud, whether on AWS RDS, Azure Database for PostgreSQL, GCP Cloud SQL, or Kubernetes-based options. Covers cost-efficiency, availability planning, and vendor feature comparisons so you don’t overcommit.
- Fujitsu SoftwareRecorded 20 Sept 2026
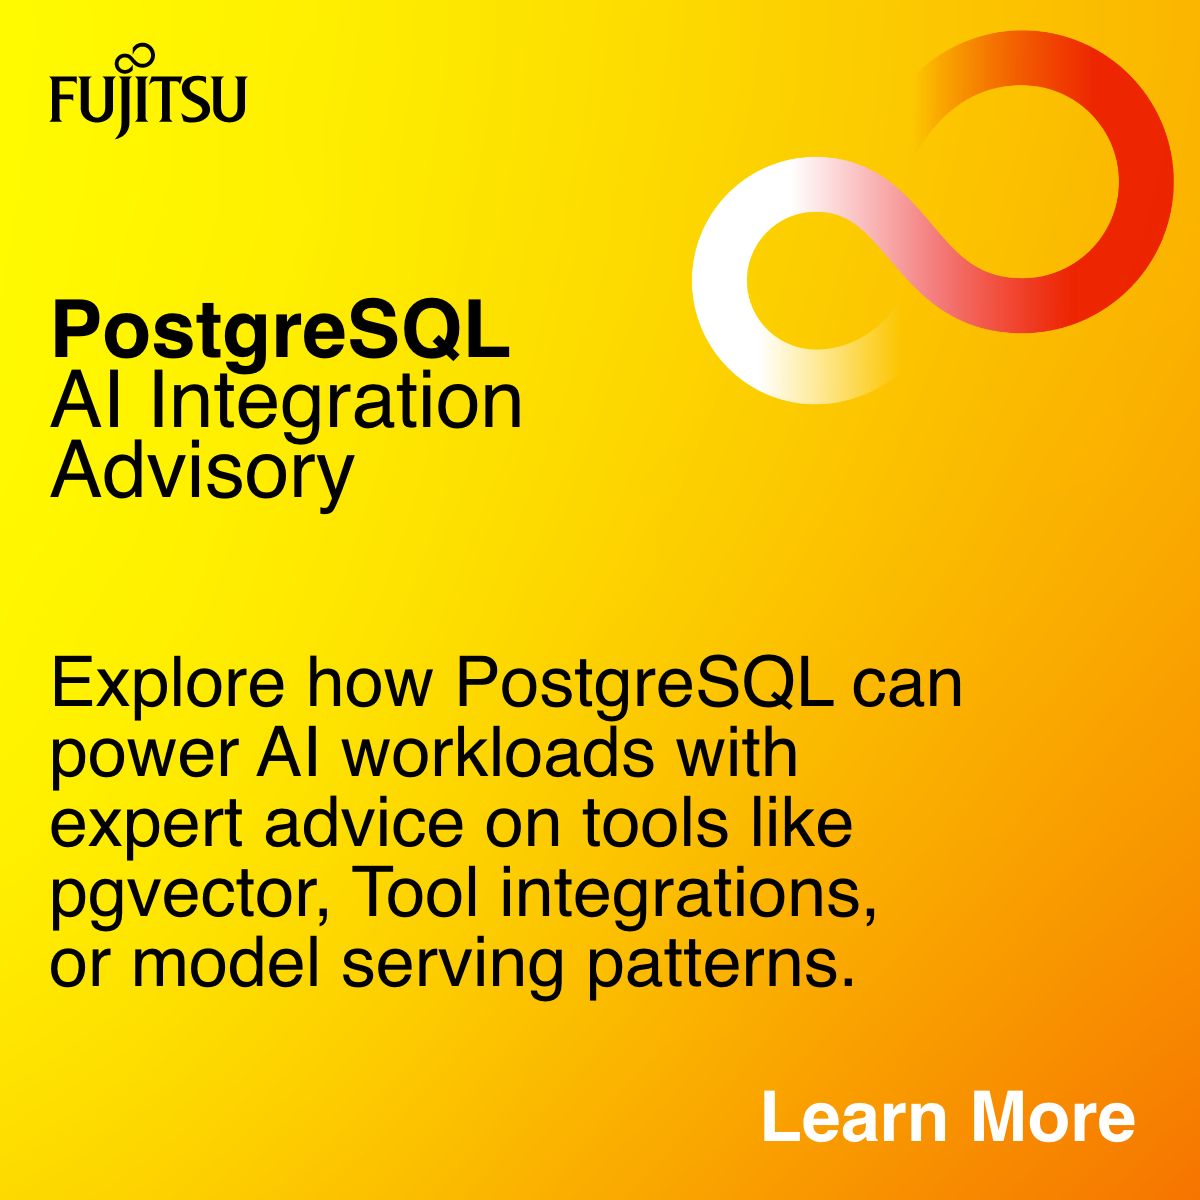
Explore how PostgreSQL can power AI workloads with expert advice on tools like pgvector, Tool integrations, or model serving patterns. Ideal for teams exploring search, recommendation, or predictive analytics features inside PostgreSQL without full AI data pipelines.
- Geoscape AustraliaRecorded 20 Sept 2026
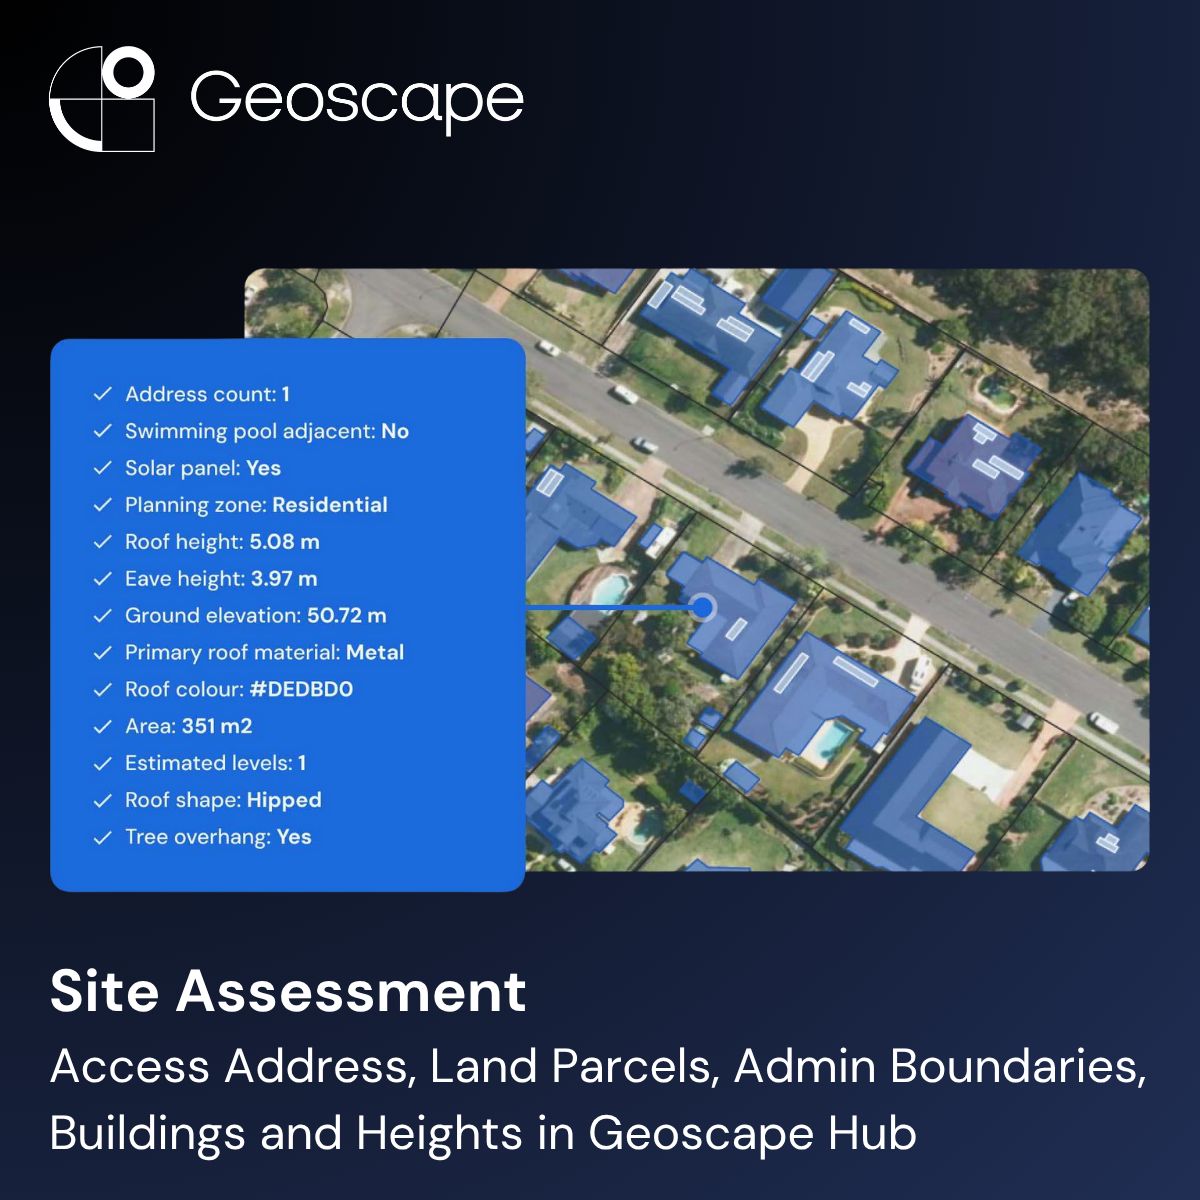
Access building footprints and heights, land parcels and planning layers in Geoscape Hub. Assess sites faster. Get started free.
- Geoscape AustraliaRecorded 20 Sept 2026
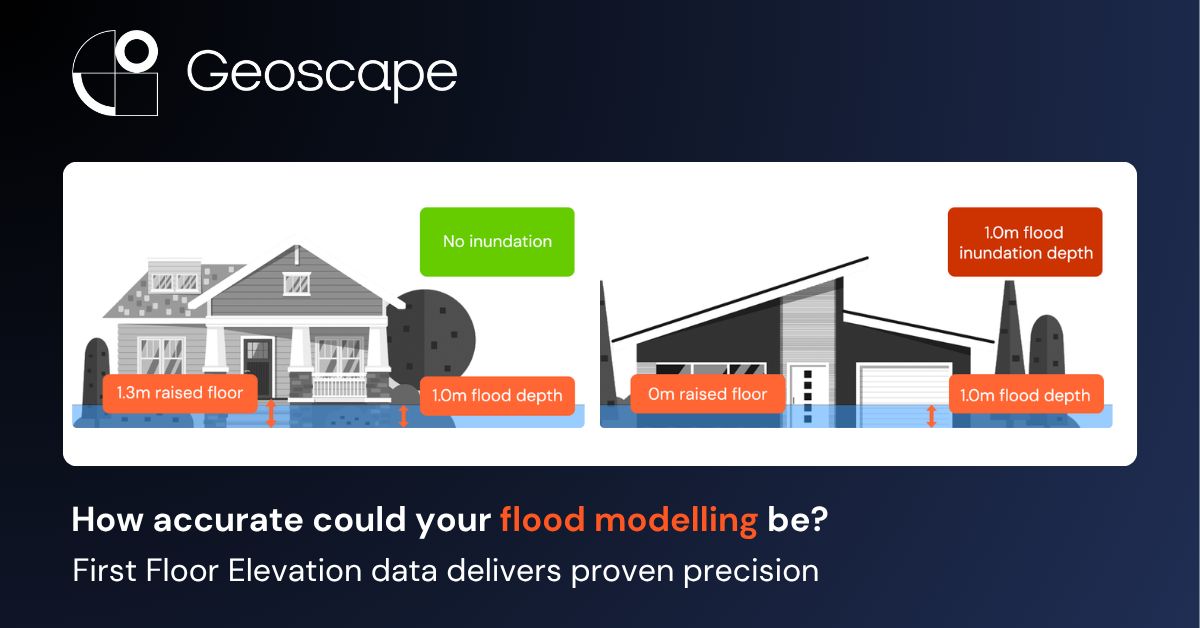
Know exactly what’s at risk – with First Floor Elevation data
- Genesis ComputingRecorded 20 Sept 2026
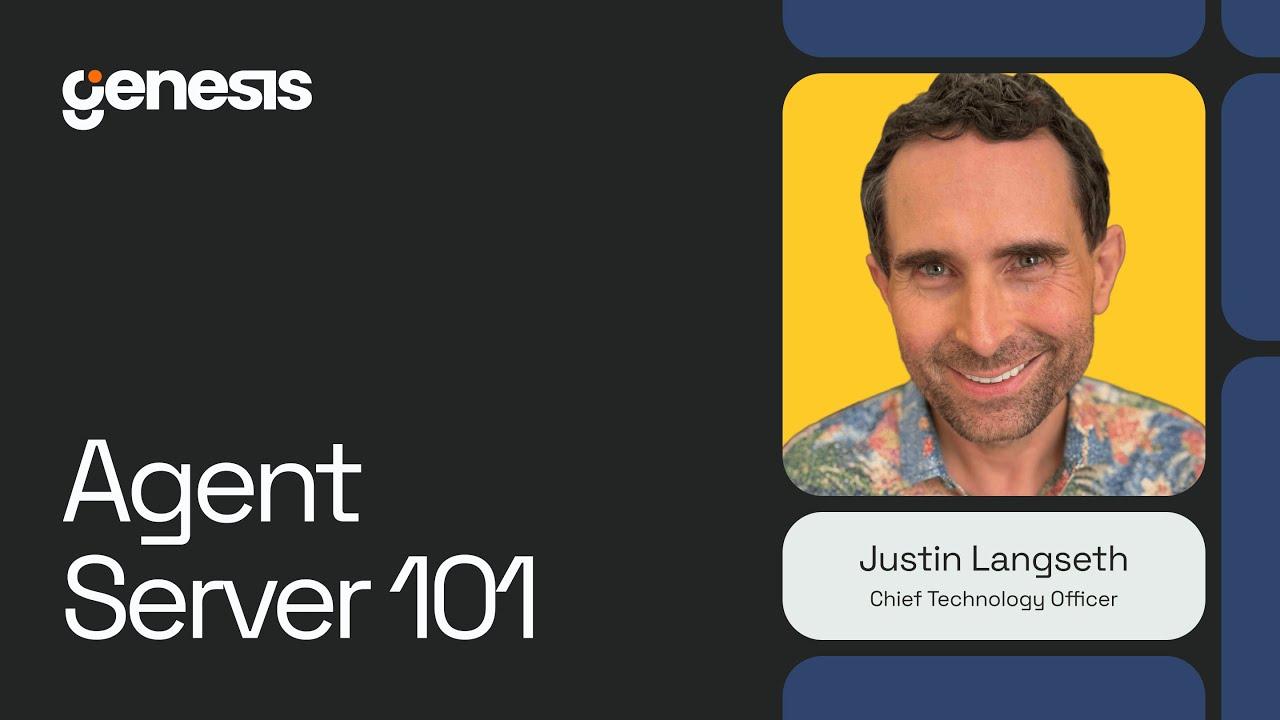
🎥 𝗣𝗔𝗥𝗧 𝟭 𝗢𝗙 𝟯: 𝗪𝗛𝗔𝗧 𝗜𝗦 𝗔𝗡 𝗔𝗚𝗘𝗡𝗧 𝗦𝗘𝗥𝗩𝗘𝗥? | Deep Dive with 𝗝𝘂𝘀𝘁𝗶𝗻 𝗟𝗮𝗻𝗴𝘀𝗲𝘁𝗵 In the first installment of our Agent Server series, Justin Langseth, Co-Founder & CTO of Genesis Computing, breaks down one of the most fundamental yet often misunderstood components of production agentic AI: 𝘁𝗵𝗲 𝗔𝗴𝗲𝗻𝘁 𝗦𝗲𝗿𝘃𝗲𝗿. 𝗪𝗵𝗮𝘁 𝗘𝘅𝗮𝗰𝘁𝗹𝘆 𝗜𝘀 𝗮𝗻 𝗔𝗴𝗲𝗻𝘁 𝗦𝗲𝗿𝘃𝗲𝗿? Think of it as 𝘁𝗵𝗲 𝗼𝗽𝗲𝗿𝗮𝘁𝗶𝗻𝗴 𝘀𝘆𝘀𝘁𝗲𝗺 𝗳𝗼𝗿 𝘆𝗼𝘂𝗿 𝗔𝗜 𝗮𝗴𝗲𝗻𝘁𝘀. Just like you can’t run applications without an OS, production agents can’t exist as just a set of files somewhere, they need a 𝘀𝗲𝗿𝘃𝗲𝗿 𝗼𝗿𝗰𝗵𝗲𝘀𝘁𝗿𝗮𝘁𝗶𝗻𝗴 𝗲𝘃𝗲𝗿𝘆𝘁𝗵𝗶𝗻𝗴 behind the scenes. 💡 𝗞𝗲𝘆 𝗜𝗻𝘀𝗶𝗴𝗵𝘁𝘀 𝗳𝗿𝗼𝗺 𝗝𝘂𝘀𝘁𝗶𝗻: 𝗧𝗵𝗲 𝗖𝗼𝗻𝘁𝗿𝗼𝗹 𝗖𝗲𝗻𝘁𝗲𝗿 An agent server is where agents “live”, handling all inbound requests from Slack, Teams, APIs, or custom interfaces, and managing all outbound tool calls and actions. It runs 𝟮𝟰/𝟳, must be 𝘀𝗲𝗰𝘂𝗿𝗲, and needs to 𝘀𝗰𝗮𝗹𝗲 𝗱𝘆𝗻𝗮𝗺𝗶𝗰𝗮𝗹𝗹𝘆 as request volumes fluctuate. 𝗪𝗵𝗮𝘁 𝗟𝗶𝘃𝗲𝘀 𝗜𝗻𝘀𝗶𝗱𝗲 ✅ 𝗔𝗴𝗲𝗻𝘁 𝗽𝗲𝗿𝘀𝗼𝗻𝗮𝘀 - System prompts and capabilities (𝗚𝗲𝗻𝗲𝘀𝗶𝘀 𝗵𝗮𝘀 𝗯𝘂𝗶𝗹𝘁 𝟭𝟬𝟬+ 𝗯𝗲𝘀𝗽𝗼𝗸𝗲 𝘁𝗼𝗼𝗹𝘀 for data engineering) ✅ 𝗔𝗰𝗰𝗲𝘀𝘀 𝗰𝗼𝗻𝘁𝗿𝗼𝗹 - What each agent can access in enterprise systems and what users can do with each agent ✅ 𝗦𝗰𝗵𝗲𝗱𝘂𝗹𝗶𝗻𝗴 𝗲𝗻𝗴𝗶𝗻𝗲 - Managing periodic tasks (checking Snowflake jobs every 15 seconds, Jira tickets every 15 minutes, daily reports every morning) ✅ 𝗦𝗲𝗰𝘂𝗿𝗶𝘁𝘆 & 𝗴𝗼𝘃𝗲𝗿𝗻𝗮𝗻𝗰𝗲 - Complete logging, observability, and compliance management ✅ 𝗟𝗟𝗠 𝗰𝗼𝗻𝗻𝗲𝗰𝘁𝗶𝗼𝗻𝘀 - Rate limiting and connection management to underlying language models 𝗧𝗵𝗲 𝗛𝘂𝗺𝗮𝗻 𝗣𝗮𝗿𝗮𝗹𝗹𝗲𝗹 Just like humans have to-do lists with immediate tasks and recurring responsibilities, agents maintain short-term work queues alongside periodic activities. The agent server 𝗸𝗲𝗲𝗽𝘀 𝘁𝗵𝗲𝗺 𝗼𝗻 𝘀𝗰𝗵𝗲𝗱𝘂𝗹𝗲, 𝗿𝗲𝘀𝗽𝗼𝗻𝘀𝗶𝘃𝗲, 𝗮𝗻𝗱 𝗮𝗰𝗰𝗼𝘂𝗻𝘁𝗮𝗯𝗹𝗲. 🎯 𝗧𝗵𝗲 𝗕𝗼𝘁𝘁𝗼𝗺 𝗟𝗶𝗻𝗲 𝗬𝗼𝘂 𝗰𝗮𝗻’𝘁 𝗵𝗮𝘃𝗲 𝗽𝗿𝗼𝗱𝘂𝗰𝘁𝗶𝗼𝗻 𝗮𝗴𝗲𝗻𝘁𝘀 𝘄𝗶𝘁𝗵𝗼𝘂𝘁 𝗮𝗻 𝗮𝗴𝗲𝗻𝘁 𝘀𝗲𝗿𝘃𝗲𝗿. 𝗣𝗲𝗿𝗶𝗼𝗱. It’s not optional, it’s the foundation that makes agents 𝗿𝗲𝗹𝗶𝗮𝗯𝗹𝗲, 𝘀𝗲𝗰𝘂𝗿𝗲, 𝗴𝗼𝘃𝗲𝗿𝗻𝗮𝗯𝗹𝗲, 𝗮𝗻𝗱 𝗲𝗻𝘁𝗲𝗿𝗽𝗿𝗶𝘀𝗲-𝗿𝗲𝗮𝗱𝘆. 👀 𝗪𝗮𝘁𝗰𝗵 𝗣𝗮𝗿𝘁 𝟭 👉 https://lnkd.in/e3qUkwxU Coming Next: 𝗪𝗵𝗲𝗿𝗲 𝘀𝗵𝗼𝘂𝗹𝗱 𝘆𝗼𝘂𝗿 𝗮𝗴𝗲𝗻𝘁 𝘀𝗲𝗿𝘃𝗲𝗿 𝗮𝗰𝘁𝘂𝗮𝗹𝗹𝘆 𝗿𝘂𝗻? #AgenticAI #AI #EnterpriseAI #DataEngineering #AIInfrastructure #ProductionAI #TechArchitecture #AIAgents #Genesis
- FullEnrichSince 1 Dec 2025
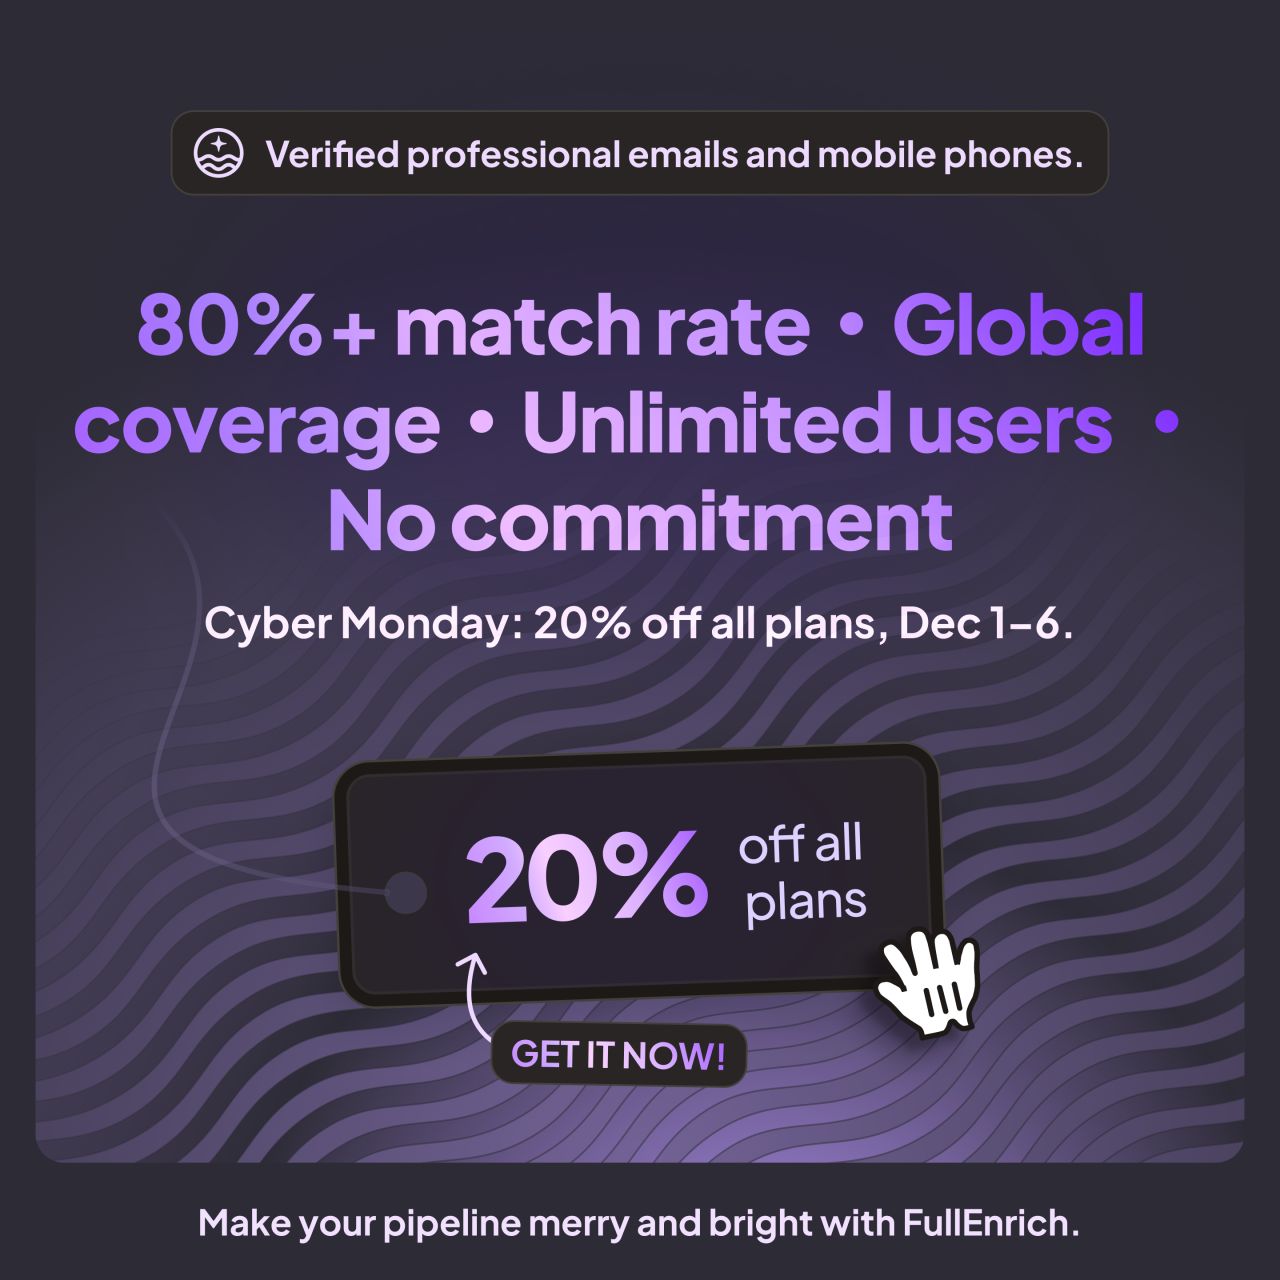
Reach more prospects with verified emails & mobile phones. 80%+ match rate. Get 20% off all FullEnrich plans this Cyber Monday.
- FullEnrichSince 3 Dec 2025
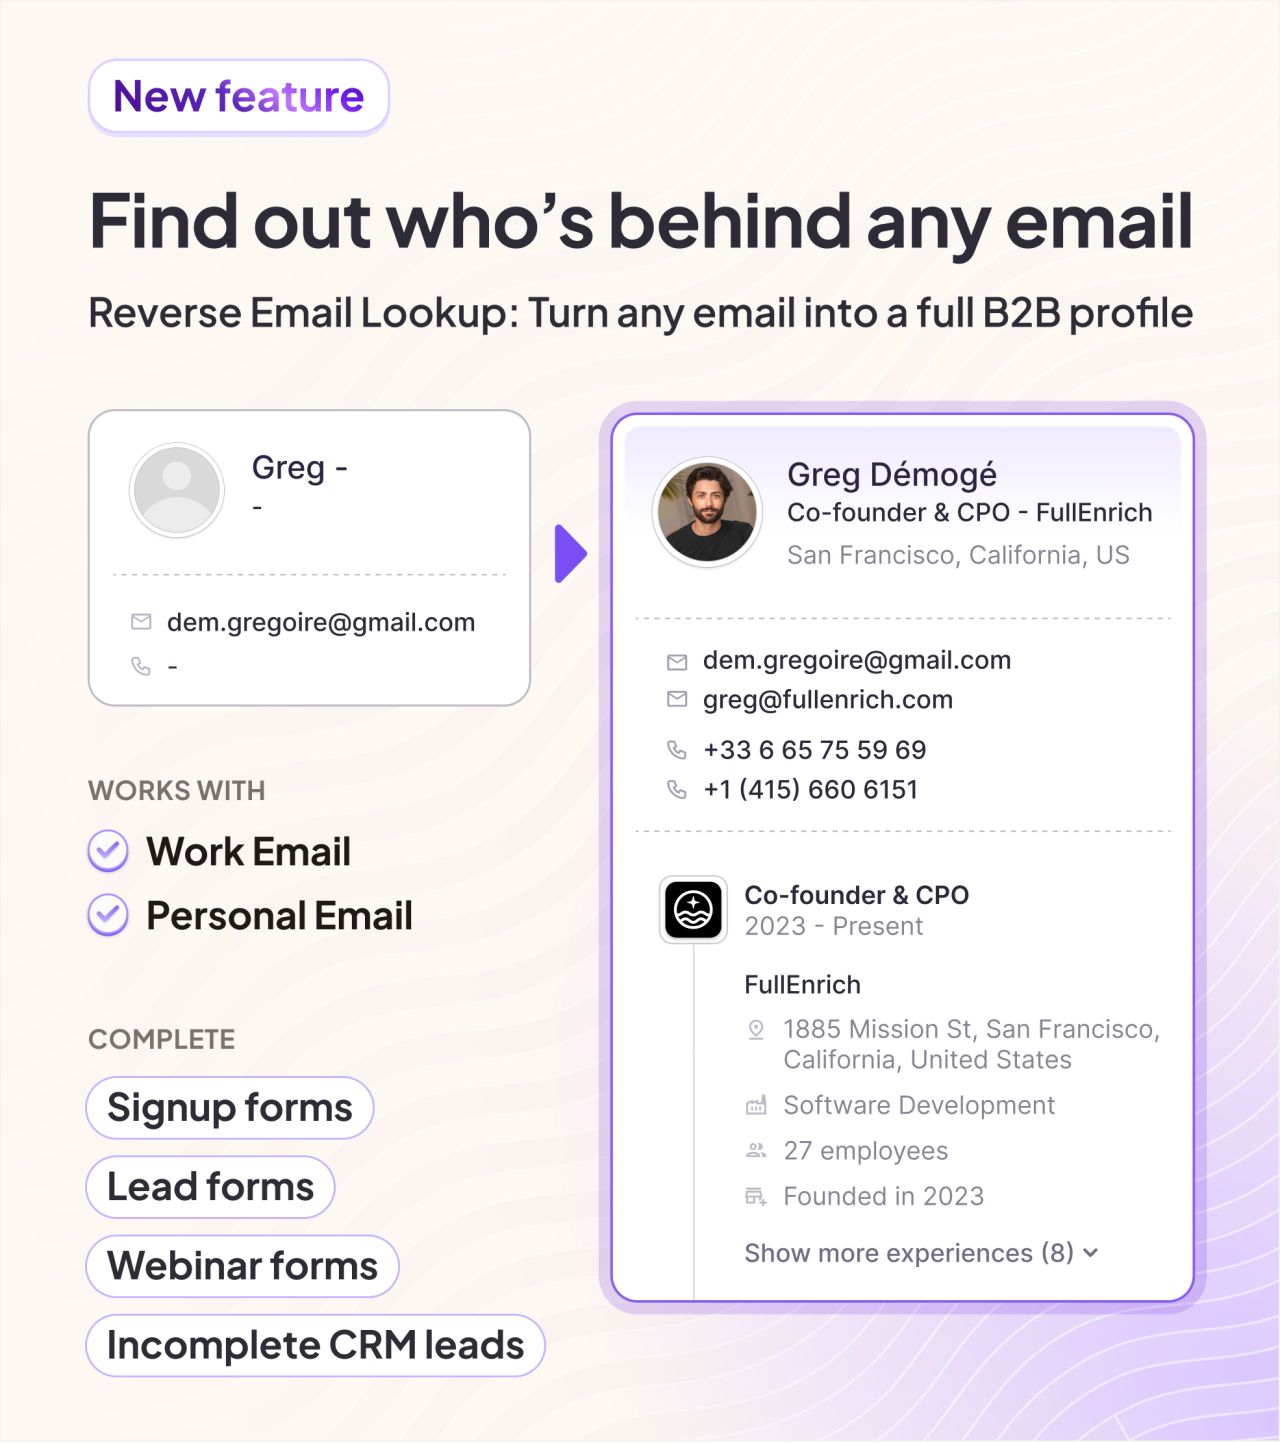
New feature: Reverse Email Lookup. Drop any email. Get the full B2B profile behind it: → Name → Job title → Location → Firmographics Everything you need to qualify a lead. Works with both: Work emails. Personal emails. Same waterfall approach. Same verification layer. 10+ data providers for the highest possible coverage. Use cases: → Enrich signups → Complete ad forms → Identify webinar attendees → Qualify gated content leads → Clean incomplete CRM records → Reveal who's behind GitHub signups (for devtool companies) One email in. Full profile out. Standardized data across your entire stack. WHY WE BUILT IT? We have +10 000 sign-ups every month. But we were leaving millions on the table. Why? We couldn't identify who was behind those emails. Sales missed gold buried in the noise. Marketing sent one-size-fits-all nurturing. CS walked past expansion opportunities sitting right there. Sure, we tested other platforms. Best we got: 40% match rate on work emails. 20% on personal emails. Worse, Sometimes the data was plain wrong. People had changed jobs 6 months ago. Still showing the old company. So we built it for ourselves first. Now, we use it on every signup. Results from early pilots (11 companies): 65-80% reveal rate on personal emails. 90-98% on work emails. If you're a PLG company; run marketing campaigns; or have incomplete CRM data; this is for you. Available now for all FullEnrich users. Credits used only on a successful match. https://lnkd.in/e8UwAkwr
- FreshBIRecorded 20 Sept 2026
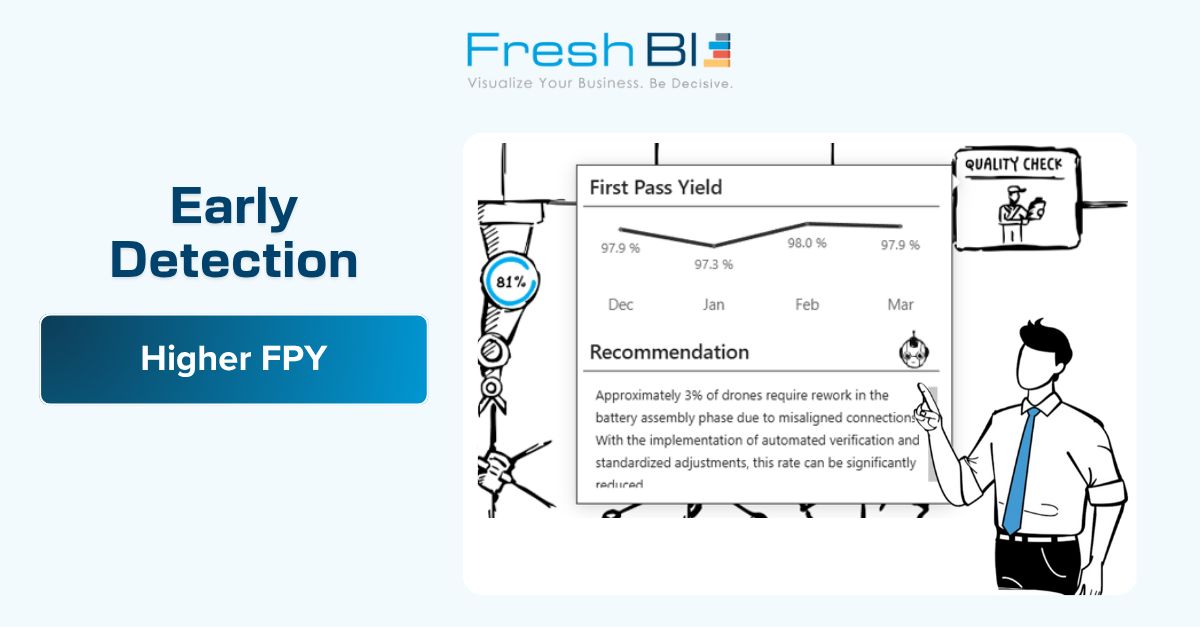
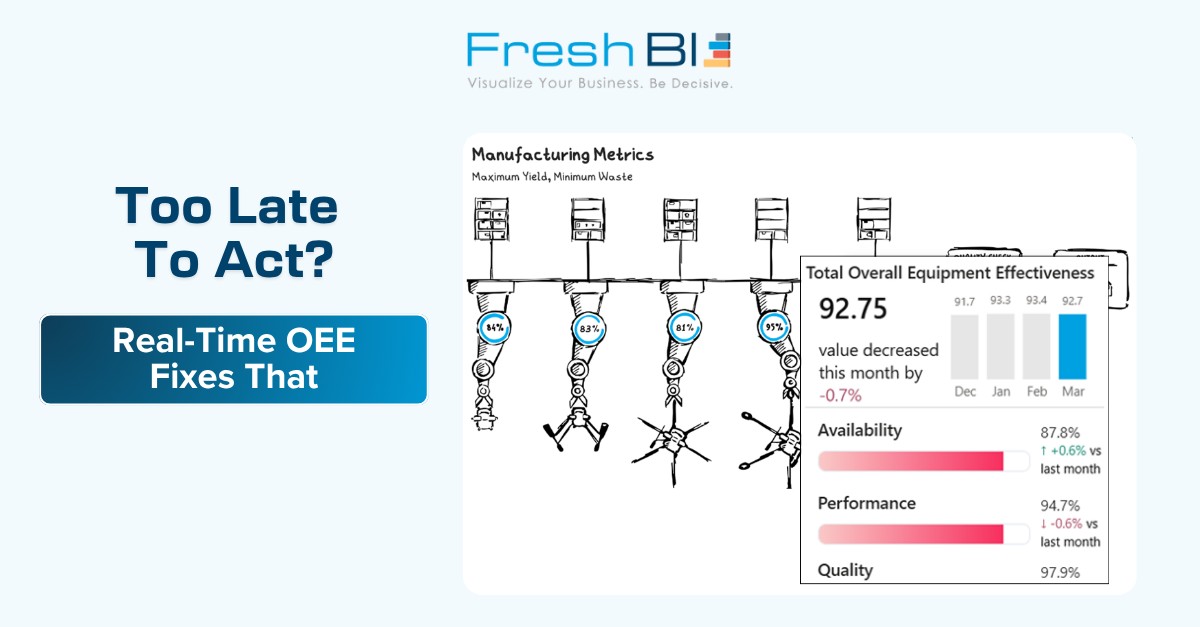
Most manufacturing dashboards just report the past. FreshBI’s Manufacturing Intelligence AI Dashboard predicts the future. AI doesn't just show you that OEE dropped. It tells you: → Which machine is about to fail → Why defect rates are climbing on Line 3 → When to reorder components before you run out → How to adjust machine speed to optimize throughput This isn't descriptive BI. This is predictive intelligence, beautifully designed. What makes FreshBI different: ✓ 20-Day Deployment – Live dashboards in three weeks, not three quarters ✓ No Contracts – Month-to-month engagement, cancel anytime, you own the IP ✓ Forward-Deployed Engineers – We embed with your team and learn your operations ✓ Agile Sprints – Your priorities shift, we adapt, no bureaucracy ✓ Free AI Infrastructure – Complete data platform, ML models, automation included ✓ Beautiful Dashboards – Designed for decisions, not decoration Interactive. Real-time. AI-enhanced. Built in 20 days. Your production floor. Visualized. Optimized. Controlled. See how it works. Schedule your demo today!
- FreshBIRecorded 20 Sept 2026
Your OEE just dropped to 68%. By the time you figure out why, you've already lost the shift, $47,000 in throughput, and your delivery schedule. FreshBI’s Manufacturing Intelligence AI Dashboard predicts problems 72 hours before they shut down your line. AI monitors every sensor, 24/7: → Vibration spikes on Machine #12 were detected 48 hours before failure → Quality trend analysis flags defect risk before scrap rate climbs → Supply chain delays spotted before raw materials run out → Performance drops tracked across every production step Why manufacturers switch to FreshBI: ✓ 20-Day Deployment – Three weeks from kickoff to live dashboard ✓ No Contracts – Month-to-month. Cancel anytime. You own all IP. ✓ Forward-Deployed Engineers – Our team embeds with yours, learns your operations from the inside ✓ Agile Sprints – Your priorities shift, we adapt. Zero bureaucracy. ✓ Free AI Infrastructure – Complete data platform, ML models, automation layer included ✓ Beautiful Dashboards – Designed for clarity, powered by intelligence, built for action Beautiful visualization. Functional intelligence. Predictive control. Your competitors are still reacting. You'll prevent. Book a demo today!
- FoodDataLab (by Doubledata)Since 10 Jan 2026
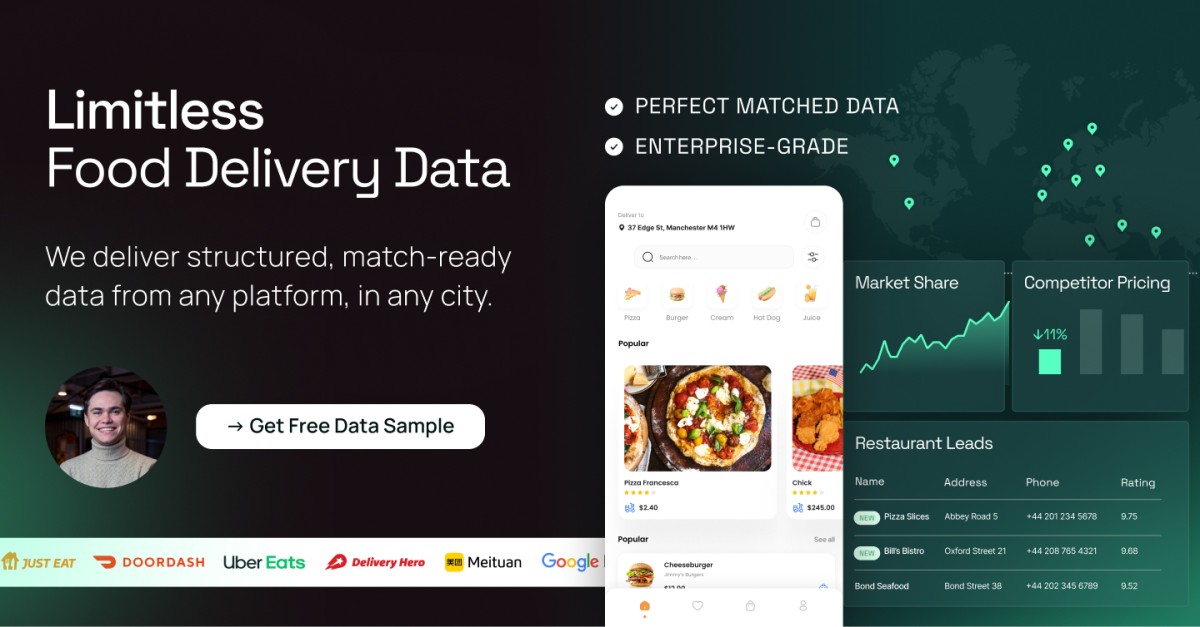
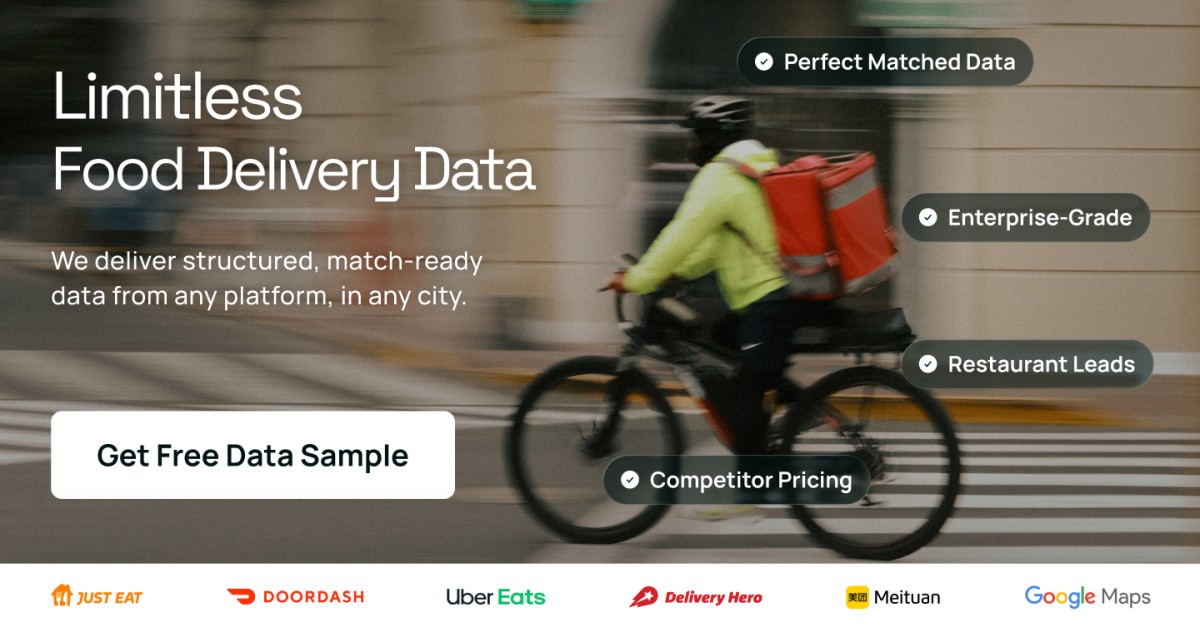
Raw scraping creates a mess. You need clean data you can actually use. We track Food, Grocery, and Retail. But the main thing? We structure and match it all so every department wins: 📊 Strategy: Track true TAM, and opportunities before anyone else. 🎯 Sales: Arm your team with high-intent leads. 💸 Marketing & Pricing: Optimize fees in real-time. ⚙️ Data & BI: Clean data, zero hassle. Want to test it? Pick a city and an app. We’ll build a custom sample for you to check out. https://lnkd.in/gFPryKSa
- FoodDataLab (by Doubledata)Since 12 Jan 2026
Raw scraping creates a mess. You need clean data you can actually use. We track Food, Grocery, and Retail. But the main thing? We structure and match it all so every department wins: 📊 Strategy: Track true TAM, and opportunities before anyone else. 🎯 Sales: Arm your team with high-intent leads. 💸 Marketing & Pricing: Optimize fees in real-time. ⚙️ Data & BI: Clean data, zero hassle. Want to test it? Pick a city and an app. We’ll build a custom sample for you to check out.
- FireboltSince 6 Jan 2026
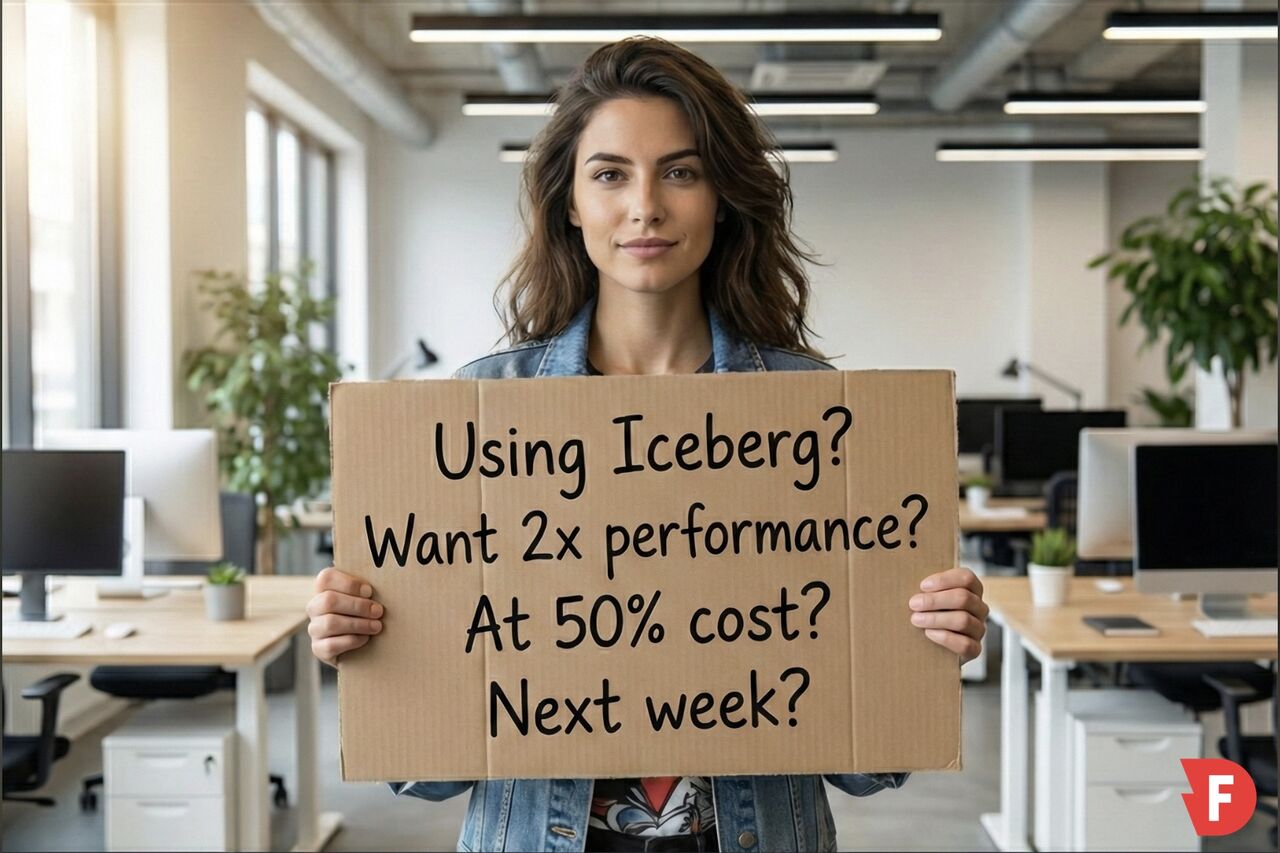
You migrated to Iceberg. So why are your queries still slow?


Other LinkedIn formats
Watch the companies you care about.
Filter every ad by industry, country, format and network, and get alerts when a company you watch starts running new ads.