On air · 2 of 3 networks
FusionCharts
- fusioncharts.com
- Data
- US
- 32 employees
FusionCharts’s ads on LinkedIn, Meta and Google, recorded by adsrunning. Browse the latest here for free. Sign up free to see all 24. Watch FusionCharts with Starter to get each new one in your feed.
Watchlist with Starter · $49/mo
| Network | Status | Live ads | Nov 2025LinkedIn activity · 52 weeksOct 2026 | Checked | Next step |
|---|---|---|---|---|---|
| None recorded | 0 | Checked 31 Oct 2026 | See all 24 ads → | ||
| Meta | Running | 3 | Active ads on the Meta Ad Library, all countries | Checked 28 Oct 2026 | Collect them with the API → |
| Running | 48 | Ads on the Google Ads Transparency Center | Checked 30 Oct 2026 | Collect them with the API → |
FusionCharts has no live LinkedIn ads. Its Facebook page had 3 active ads on 28 Oct 2026, and we recorded 48 Google ads on 30 Oct 2026.
Latest ads
- LINKEDIN · IMAGESince 4 Mar 2026
🚀 Transform Data into Insights with Column & Bar Charts FusionCharts brings you dynamic column and bar charts designed for impactful data visualization. Highlight trends, compare categories, and make your dashboards stand out! Why choose FusionCharts? ✅ Highly customizable and responsive ✅ Easy integration with your tech stack ✅ Professional-grade visuals for any data Check out our column and bar chart collection: 👉 https://bit.ly/4gvw5L5 #DataVisualization #BusinessIntelligence #ColumnCharts #BarCharts #FusionCharts
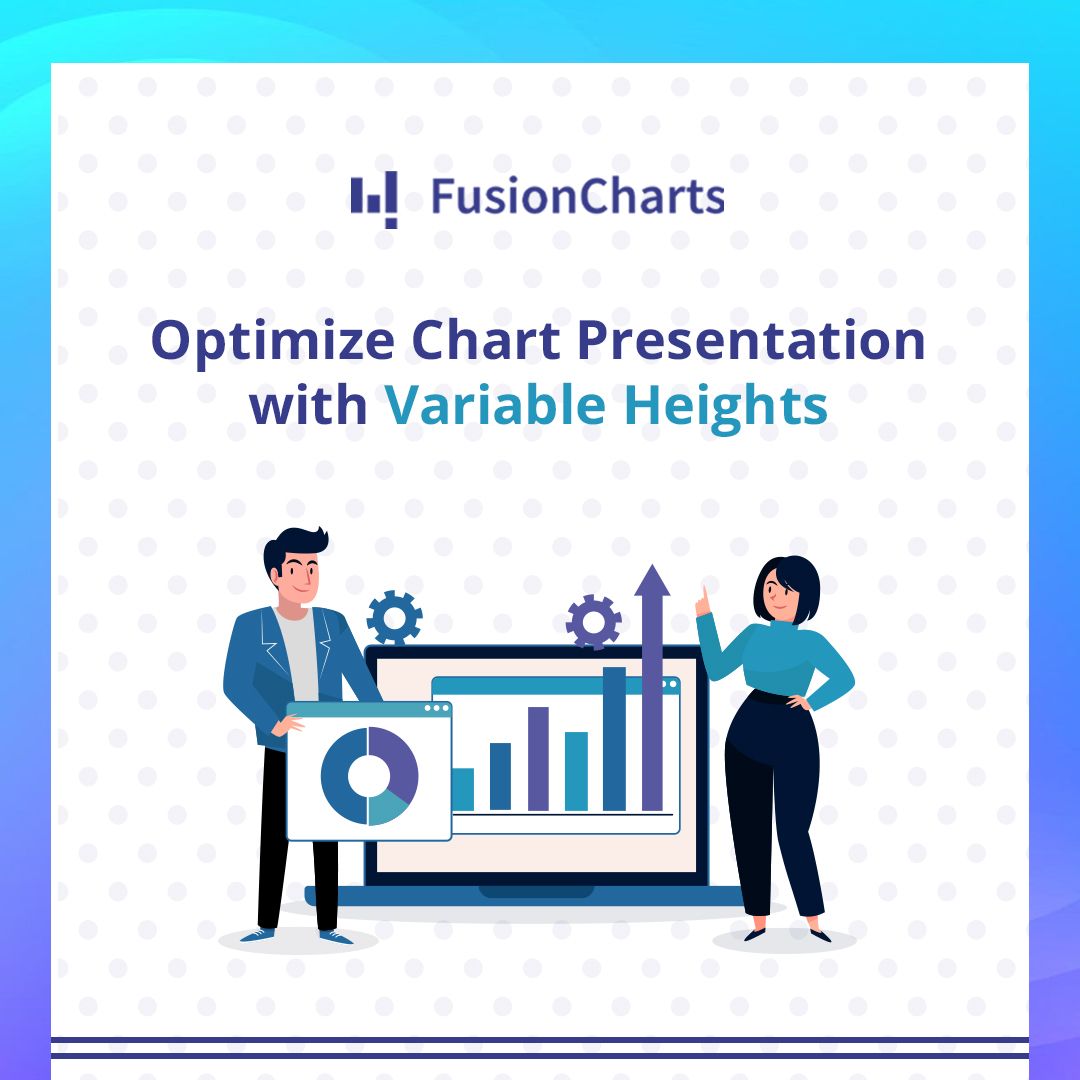
- LINKEDIN · IMAGESince 22 Sept 2025
📉Customize your charts with variable canvas heights in FusionTime! See how adjusting the canvas can improve data presentation. Check out the example: https://bit.ly/3z4ecT6 #DataVisualization #WebDevelopment #ChartingLibraries
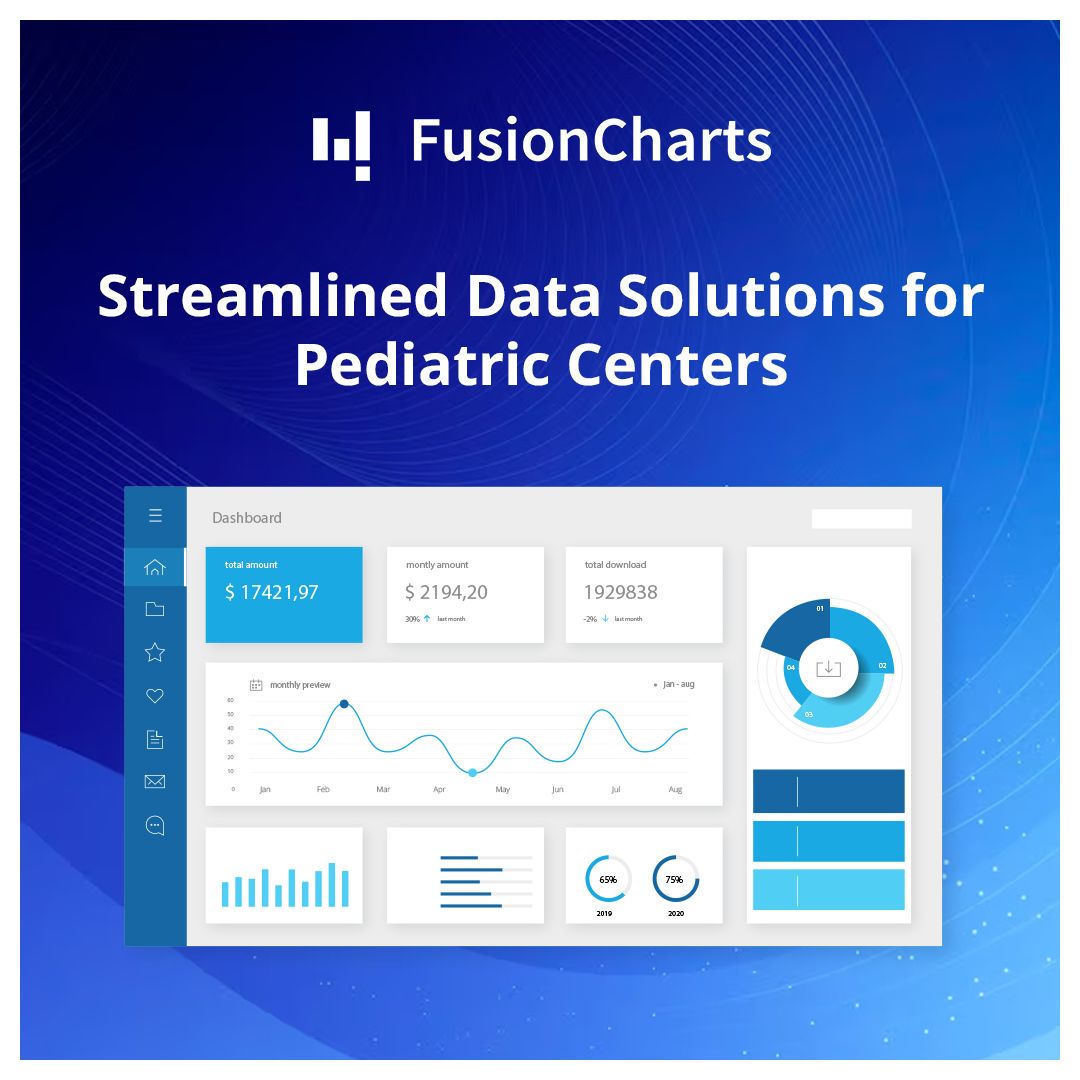
- LINKEDIN · IMAGESince 22 Sept 2025
Transform pediatric care with our pediatrics center dashboard! Access real-time data and powerful visuals to make better decisions for patient outcomes. Learn more about its features and benefits.👉 https://bit.ly/3XnPwNA #FusionCharts #Pediatrics #HealthcareDashboard #ChildHealth #MedicalAnalytics #HealthTech
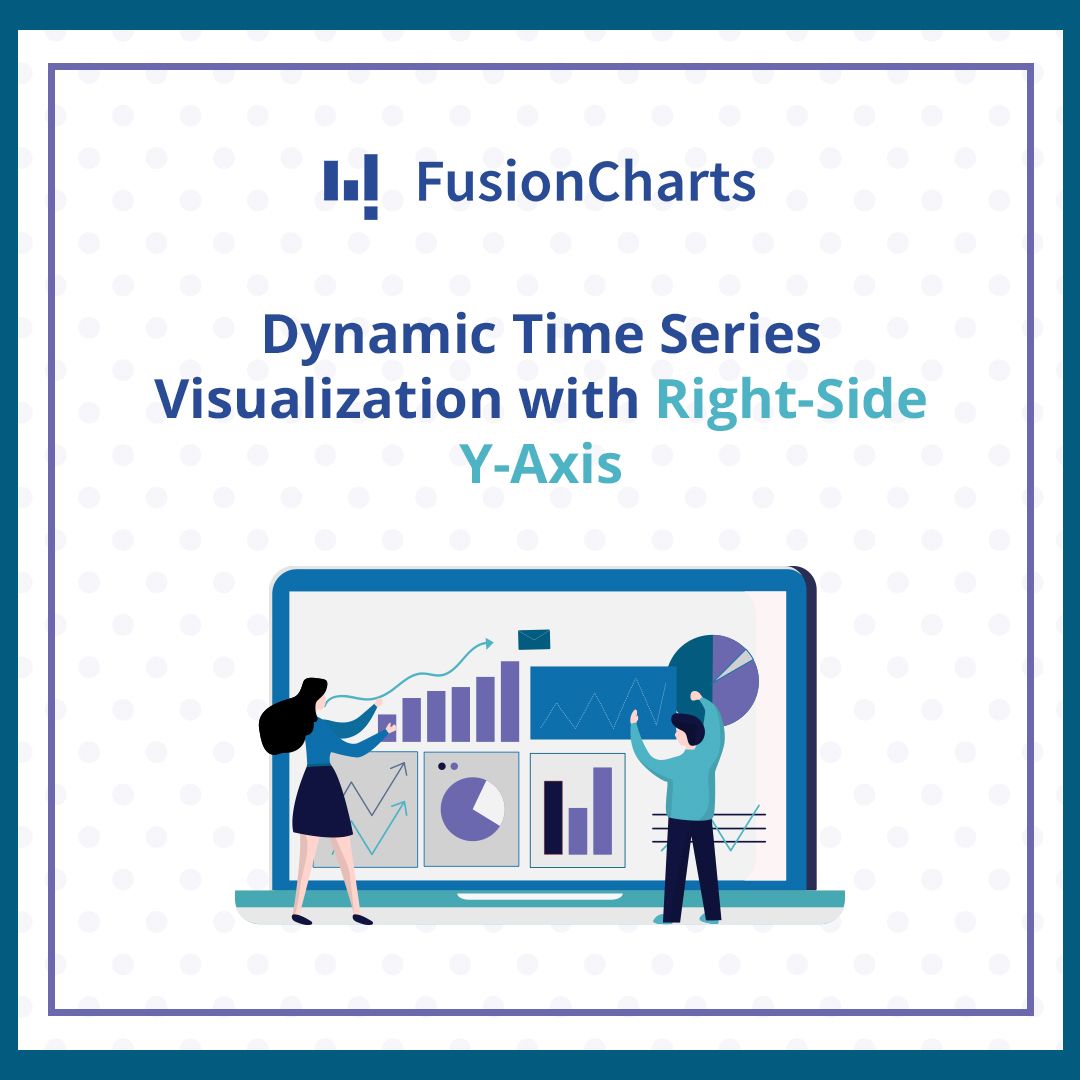
- LINKEDIN · IMAGESince 22 Sept 2025
Gain new perspectives on data visualization with FusionTime's ability to place the Y-axis on the right side of a canvas. Explore how this feature can enhance your data clarity!👉 https://bit.ly/3XmcvtO #DataVisualization #JavaScript #WebDevelopment #DataAnalytics
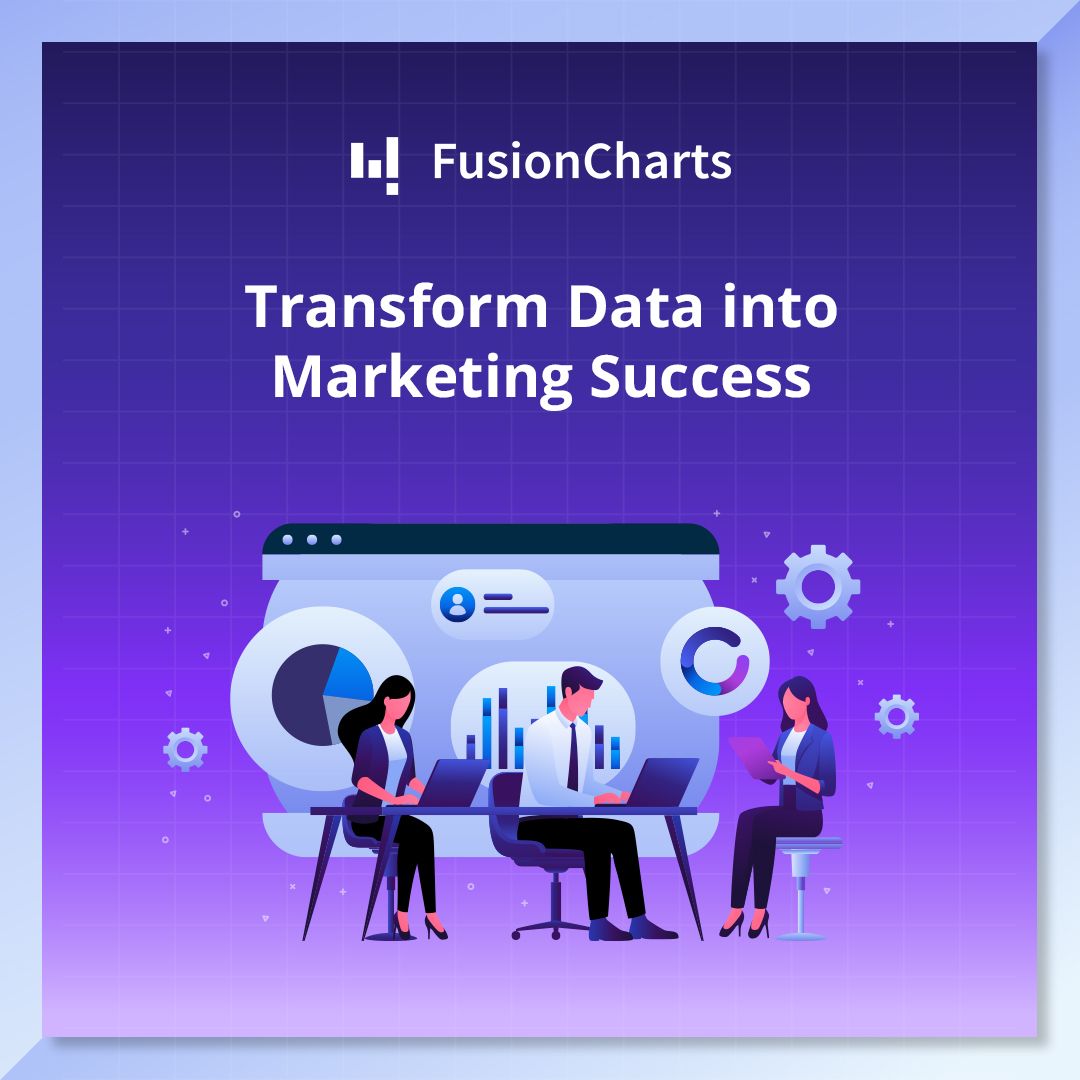
- LINKEDIN · IMAGESince 22 Sept 2025
Revolutionize your marketing analytics with our advanced Marketing Dashboard. This tool provides a comprehensive view of your campaigns, helping you track performance and optimize strategies with real-time data. Explore Now:👉 https://bit.ly/3XCiquN #fusioncharts #MarketingStrategy #DataVisualization #BusinessIntelligence #MarketingAnalytics #DashboardDesign
- LINKEDIN · IMAGESince 22 Sept 2025
AI is making data visualization smarter and more intuitive! Discover how AI-powered documentation is changing the game in analytics and data visualization. Read all about it and stay ahead in the field!👉 https://bit.ly/3AEtQFt #FusionCharts #DataTech #AIAssistant #developertools

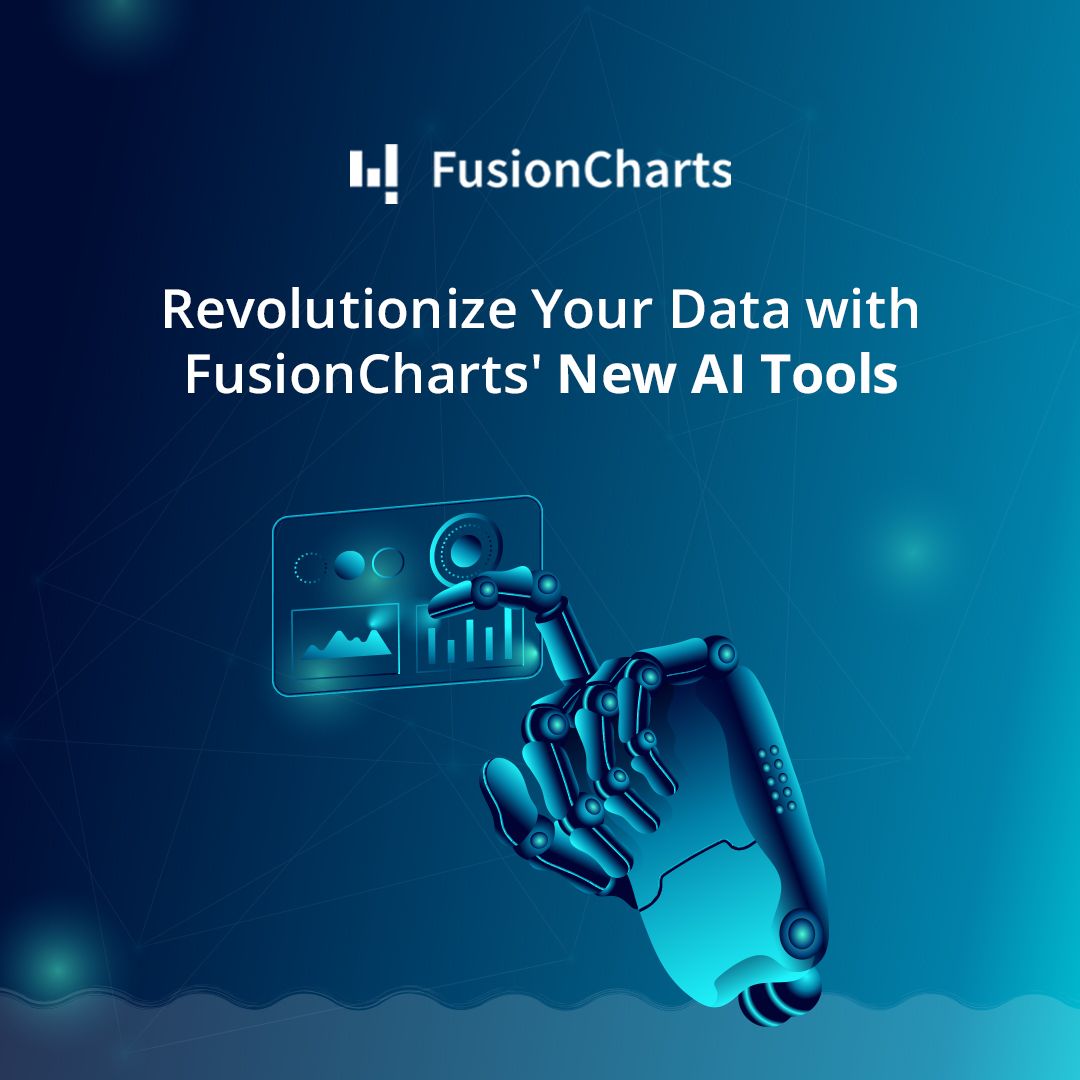
6 of 24 adsSign up to see every FusionCharts ad, filter by format and date, and get alerts on new ones.
See all 24 adsWatch the companies you care about.
Filter every ad by industry, country, format and network, and get alerts when a company you watch starts running new ads.