LinkedIn image ad examples
519 image ads are live on LinkedIn right now, from 406 companies. Browse real ones, filtered by industry.
- DeepnoteSince 16 Oct 2026
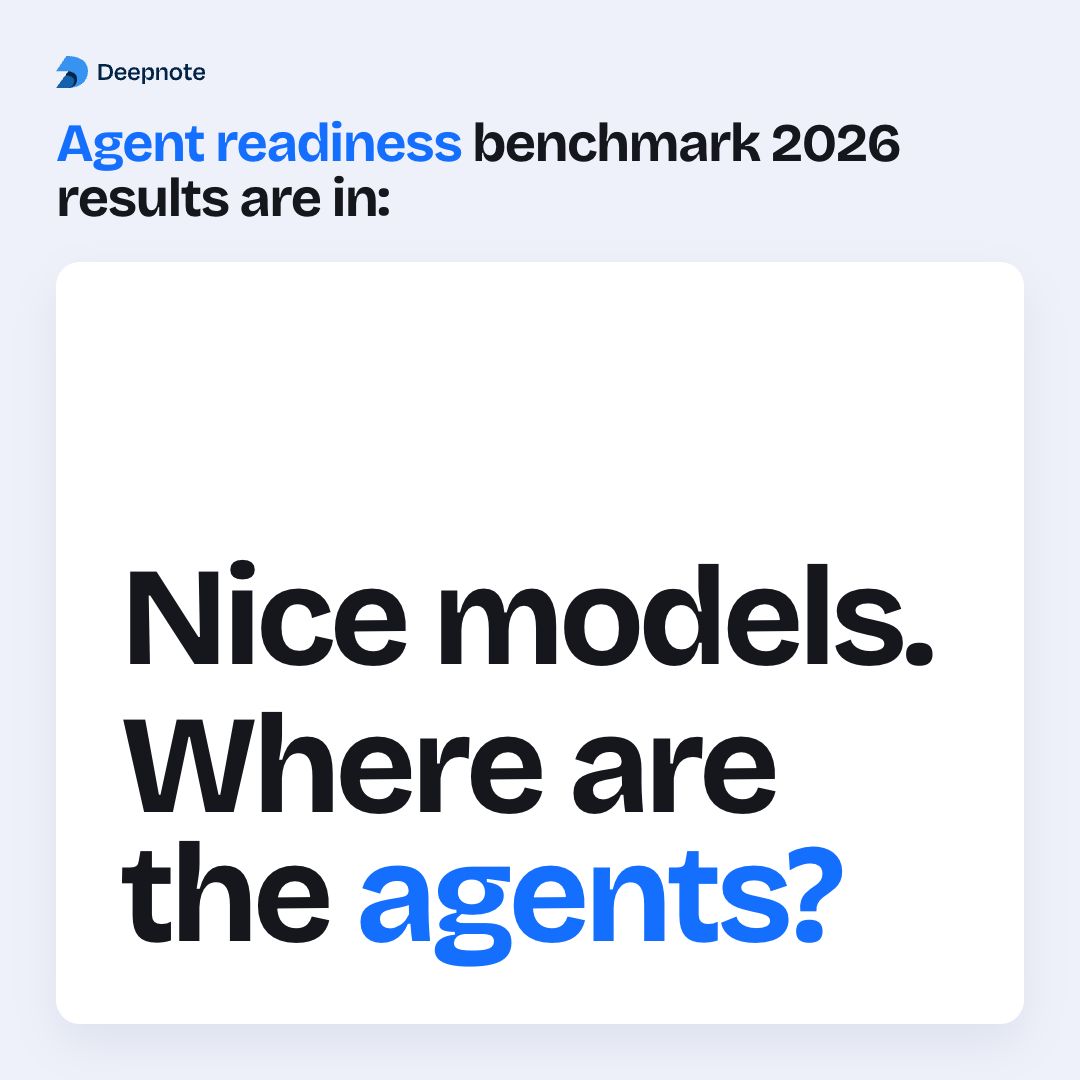
Your company is ahead of its industry, but weak on pushing agents to production. Find out what's holding you back in our free report today.
- DeepnoteSince 16 Oct 2026
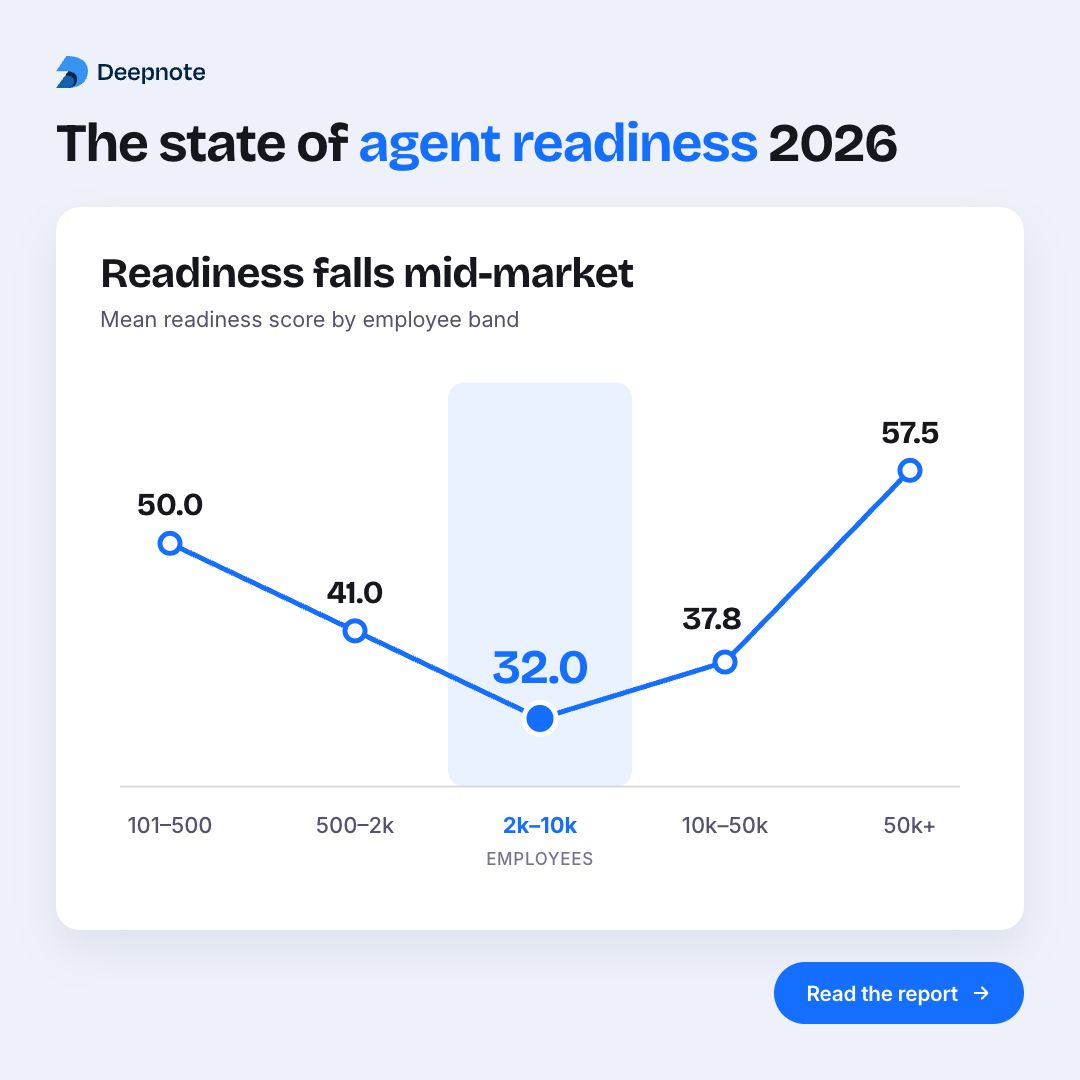
We scored 4,350 companies, including your company. Those with 2,000–10,000 employees have the lowest average agent-readiness score in nearly every industry. See what your segment is missing in our free report today.
- bitdriftSince 16 Oct 2026
Still getting snagged? Every question about production turns into a release, a quota conversation, or a shrug. Your team is not the bottleneck here.
- bitdriftSince 16 Oct 2026
A bad release costs you. Twice. Once when it breaks. Again when the error spike burns through the event quota. Enjoy the bill.
- IRBsearchRecorded 20 Oct 2026
Your report already has the answer. It’s just buried on page 37. The Intelligence Brief from IRBsearch surfaces red flags, aliases, associate links and asset hits as soon as your report runs, ranked by priority so you know your next move.
- HarmonumSince 16 Oct 2026
Kůň vás taky dostane, kam potřebujete. Jen vás všichni předjedou. S ruční uzávěrkou je to stejné: dojede, ale konkurence už má čísla dávno na stole. Harmonum automatizuje párování plateb, faktury i reporty, takže uzávěrku máte hotovou první den. Pořád jezdíte s povozem?
- HarmonumSince 16 Oct 2026
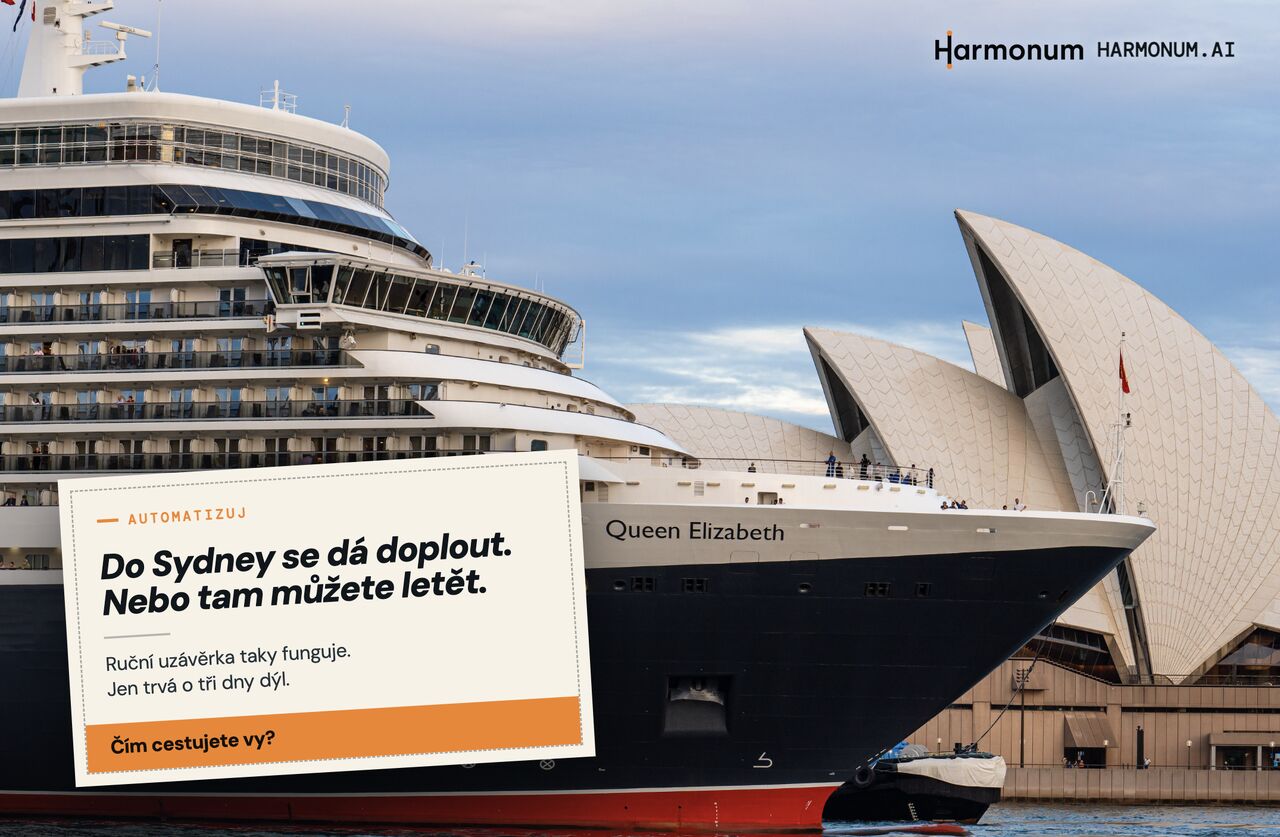
Do Sydney se dá doplout. Cesta trvá týdny, ale nakonec tam dorazíte. S ruční uzávěrkou je to stejné: funguje, jen trvá o tři týdny déle. Harmonum páruje platby, faktury a reporty automaticky, takže čísla máte hned po konci měsíce. Čím cestujete vy?
- DTNSince 15 Oct 2026
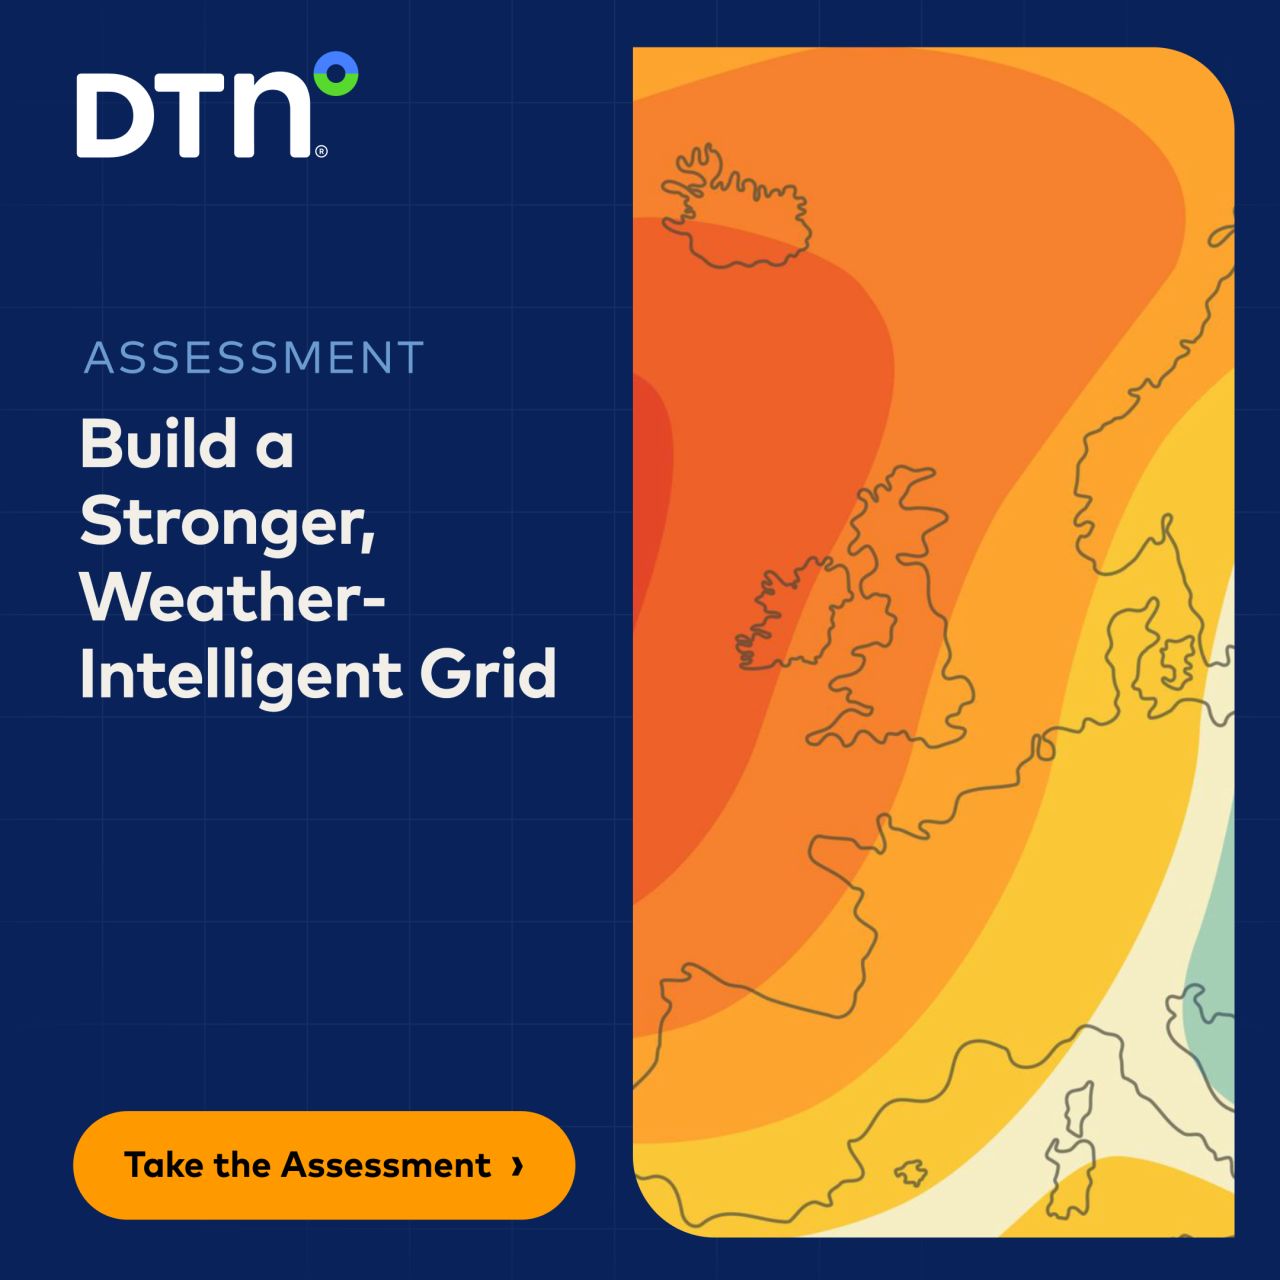
Discover how leading TSOs align weather intelligence with operational workflows, decision thresholds, and cross-functional coordination to strengthen resilience and improve decision-making.
- DTNSince 15 Oct 2026
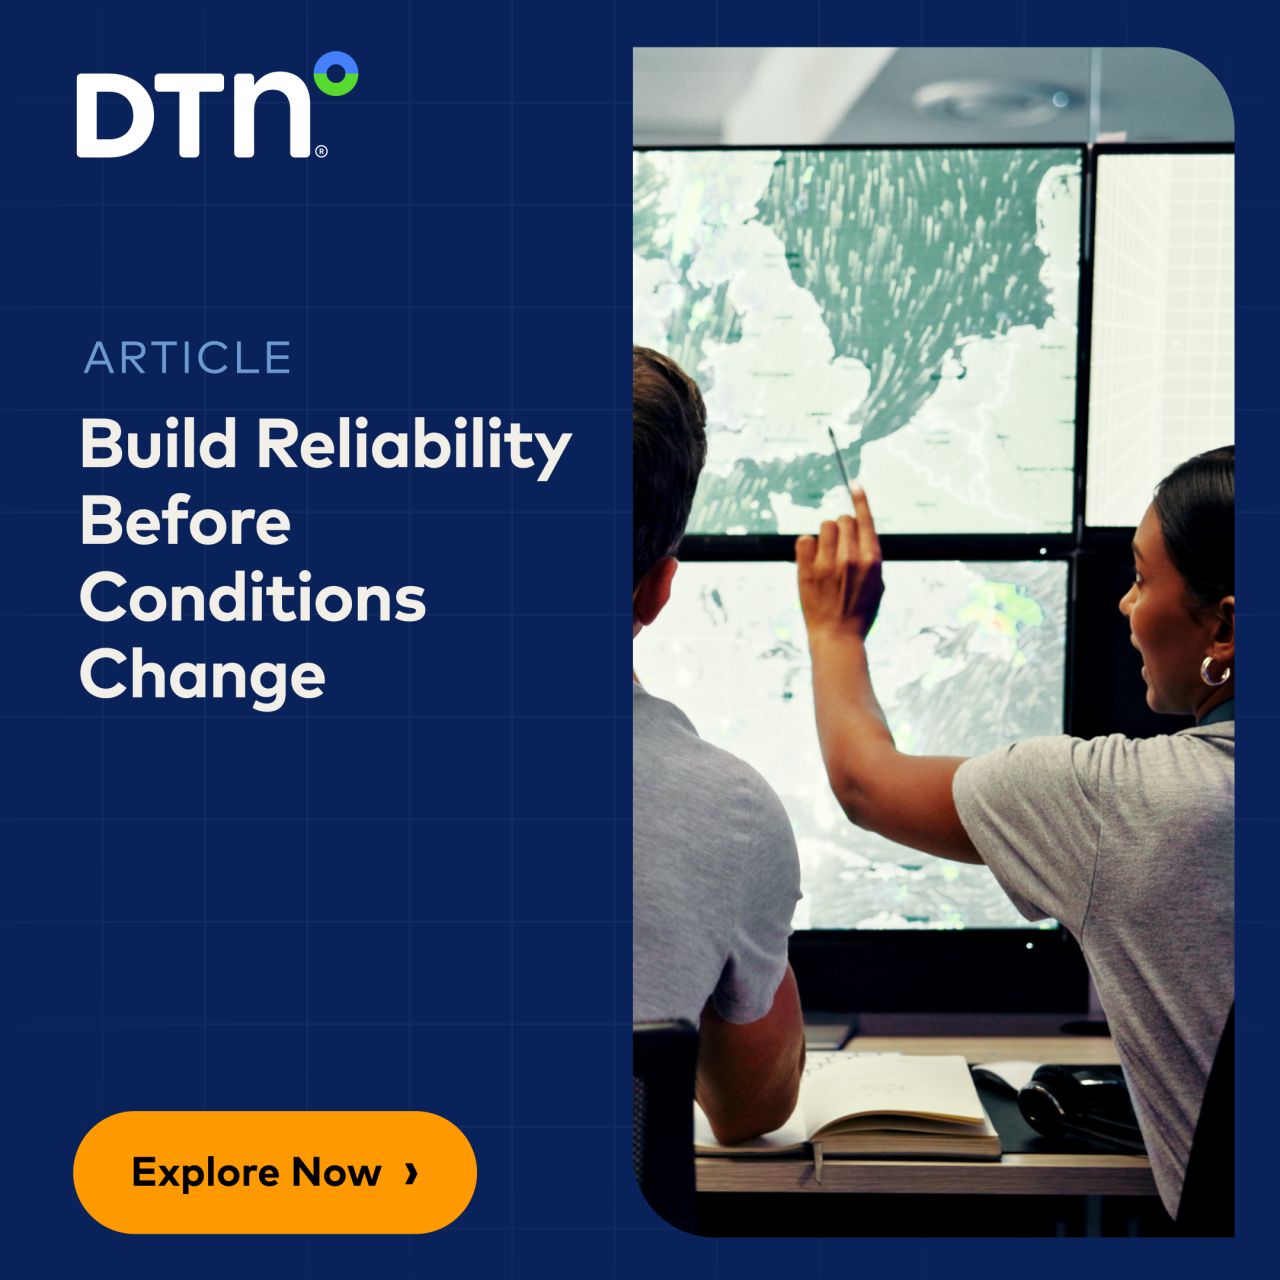
Discover how Operational Weather Intelligence helps transmission operators anticipate operational impacts, preserve decision options, and improve grid reliability—even when uncertainty is high.
- DomoSince 16 Oct 2026
Getting answers from your data shouldn't always require an analyst. Give your teams the power to explore data, uncover insights, and find answers faster with self-service BI and AI.
- DomoSince 16 Oct 2026
Give your customers more than a static dashboard. Embed interactive analytics directly into your product or portal, empowering customers to explore data and uncover insights on their own.
- FlashGridSince 15 Oct 2026
Better uptime for Oracle Database on Azure. Avoid fatal architecture flaws when you design HA with Data Guard.
- FlashGridSince 15 Oct 2026
Maximize Oracle Database uptime with proven failover clustering across multiple cloud availability zones.
- honeycomb.ioSince 16 Oct 2026
Trustworthy AI requires more than accurate outputs. Teams need visibility into how decisions happen and the ability to trace results back to their source. Explore how telemetry and provenance can support more explainable AI systems in Chapter 17 of Observability Engineering.
- honeycomb.ioSince 16 Oct 2026
More dashboards won't solve growing debugging complexity. Explore wide events, OpenTelemetry, and observability-driven development in the second edition of the book that helped shape modern observability. Get your free copy today.
- FullstorySince 21 Sept 2026
Great conversation with Klarna about how they're using Fullstory behavioral data to build a Buy Now, Pay Later (BNPL) checkout experience people trust. Fullstory's new survey shows why that matters: → 48% of consumers use BNPL at least once a week → 79% say they abandon a BNPL checkout at least sometimes → The #1 reason is hidden fees and unclear payment terms 81% of consumers call BNPL convenient. Most of them also abandon it. That gap isn't a payments problem; it's a UX problem, and you only close it if you can see how people actually experience your checkout, not by guessing. 🎥 https://lnkd.in/ejrWrMyp
- SELECTSince 15 Oct 2026
Databricks can run OPTIMIZE, VACUUM, and ANALYZE on your Unity Catalog tables automatically, using serverless compute you're billed for. This is predictive optimization, and its usage shows up in your billing under its own product. Take a look at SELECT's Guide to Databricks Unity Catalog and learn where to find that usage before it surprises you.
- SELECTSince 15 Oct 2026
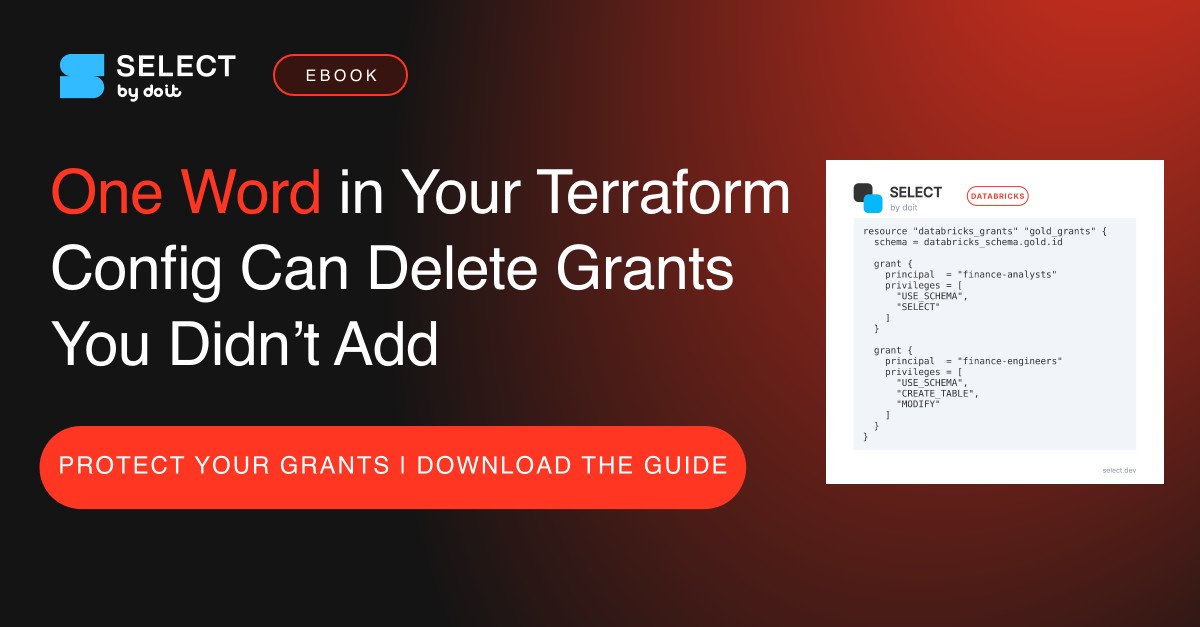
Did you know that the MANAGE privilege in Unity Catalog controls permissions, not data access, so it doesn't grant SELECT or MODIFY on its own?
- Cambridge IntelligenceSince 15 Oct 2026
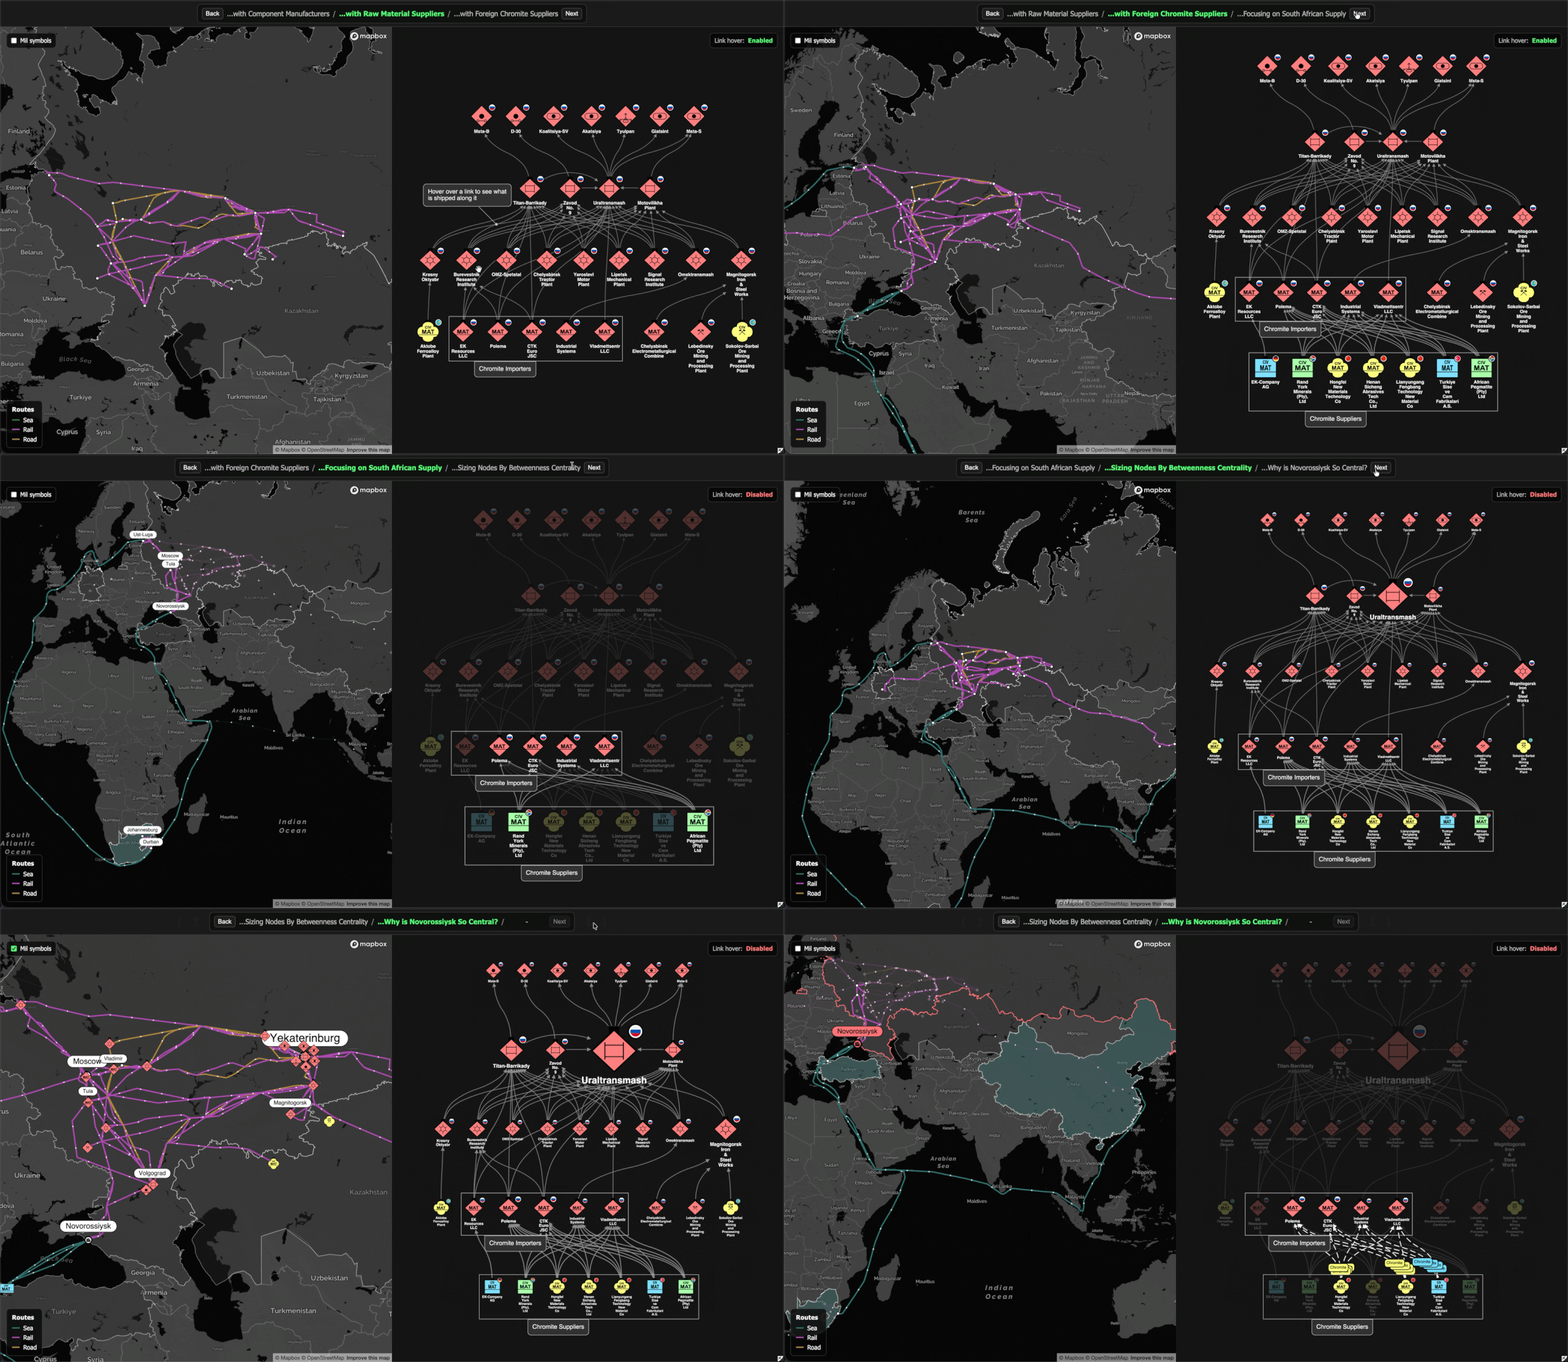
Graphs on maps just got real... Abstract graphs help you understand connectivity, bottlenecks and the importance of nodes in a network. But links in the real world aren't as simple as that. They follow train routes, or coastlines; they pass through real world geographic pinch points and conflict zones. MapWeave 1.9 is out, with a new hybrid approach. Treat a graph as an abstract concept for analysis, but give it real world path routing to understand the true geospatial meaning of those links and flows in your data. More examples at https://lnkd.in/ejQMT-_4
- Cambridge IntelligenceSince 15 Oct 2026
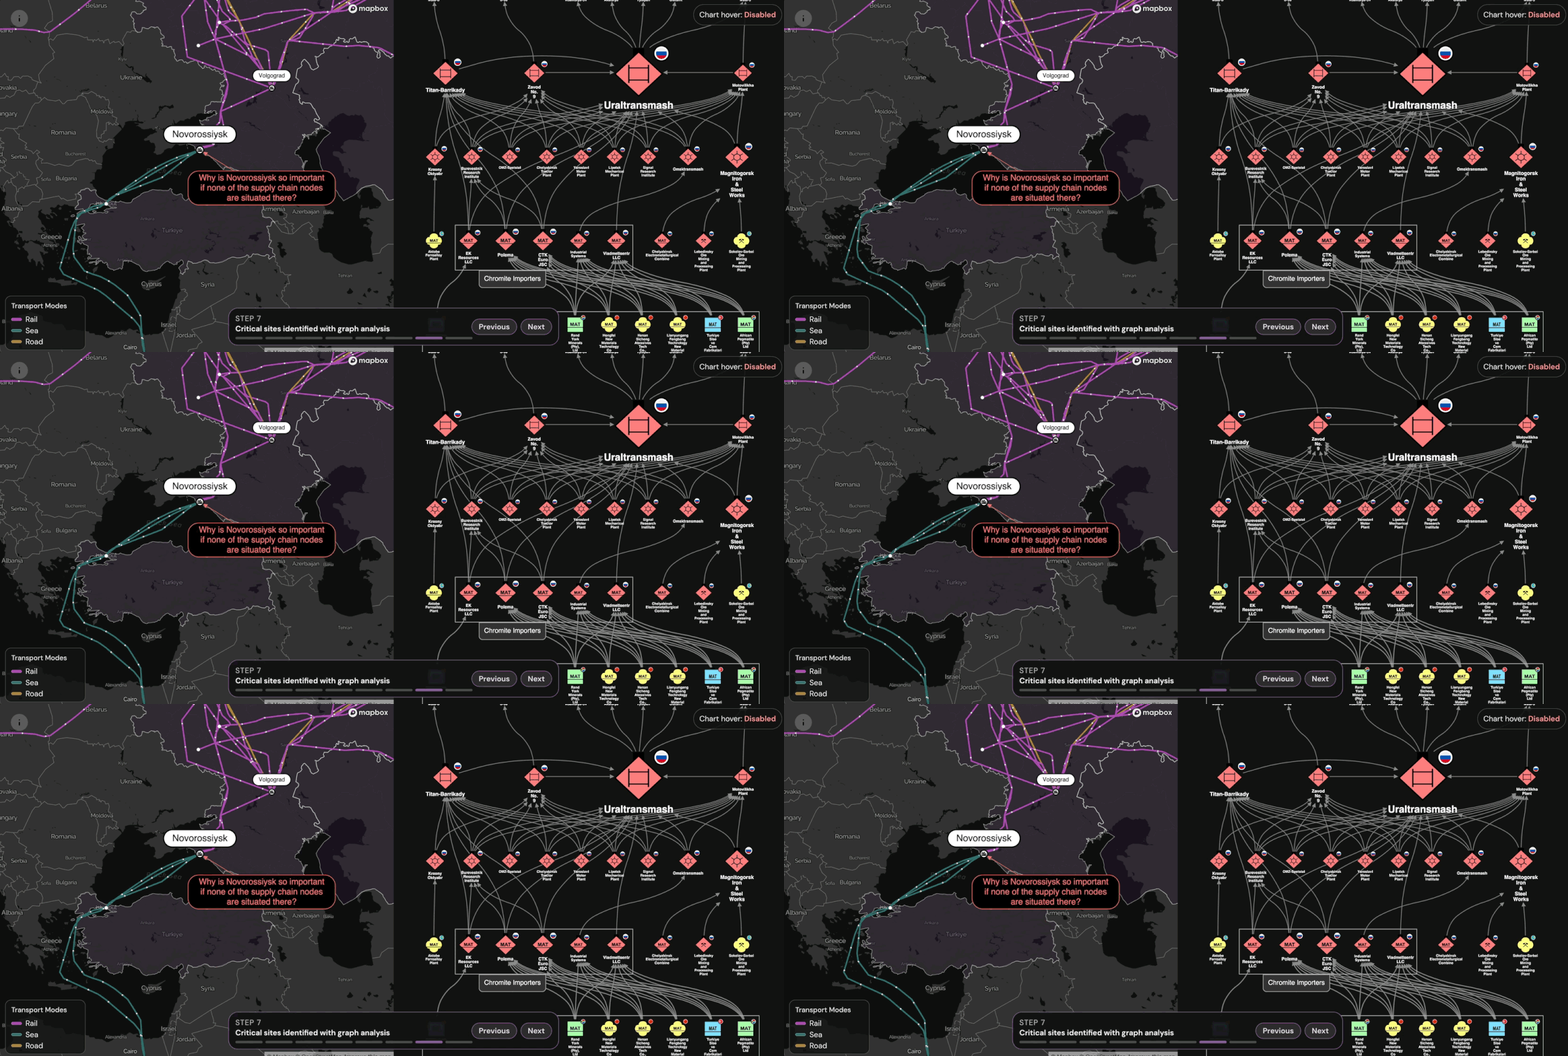
Who doesn't love a sneak preview? :) Last year, I built a little visualisation of the russian artillery supply chain based on RUSI's "Ore to Ordnance" paper and we published a blog on it back in December (can't believe that's 4 months ago - WTF?!). But basically since I built it, it bothered me... It received great feedback for the graph network visualisation part, and for the bit where you could see the potential impact of a typhoon on the map (I'll pop a link to the blog in the chat if you didn't see it before). But the rest of the geospatial visualisation didn't really add more value - it kind of just showed the same thing as the chart... So I've been working on a new version (in the gif) which is all about why its valuable to have complementary graph AND geospatial visualisations for supply chain applications, especially for assessing centrality, risk and impact of disruptions (Strait of Hormuz anyone?). More on this soon but hope you enjoy the gif for now :)
- BECUAIRecorded 17 Oct 2026
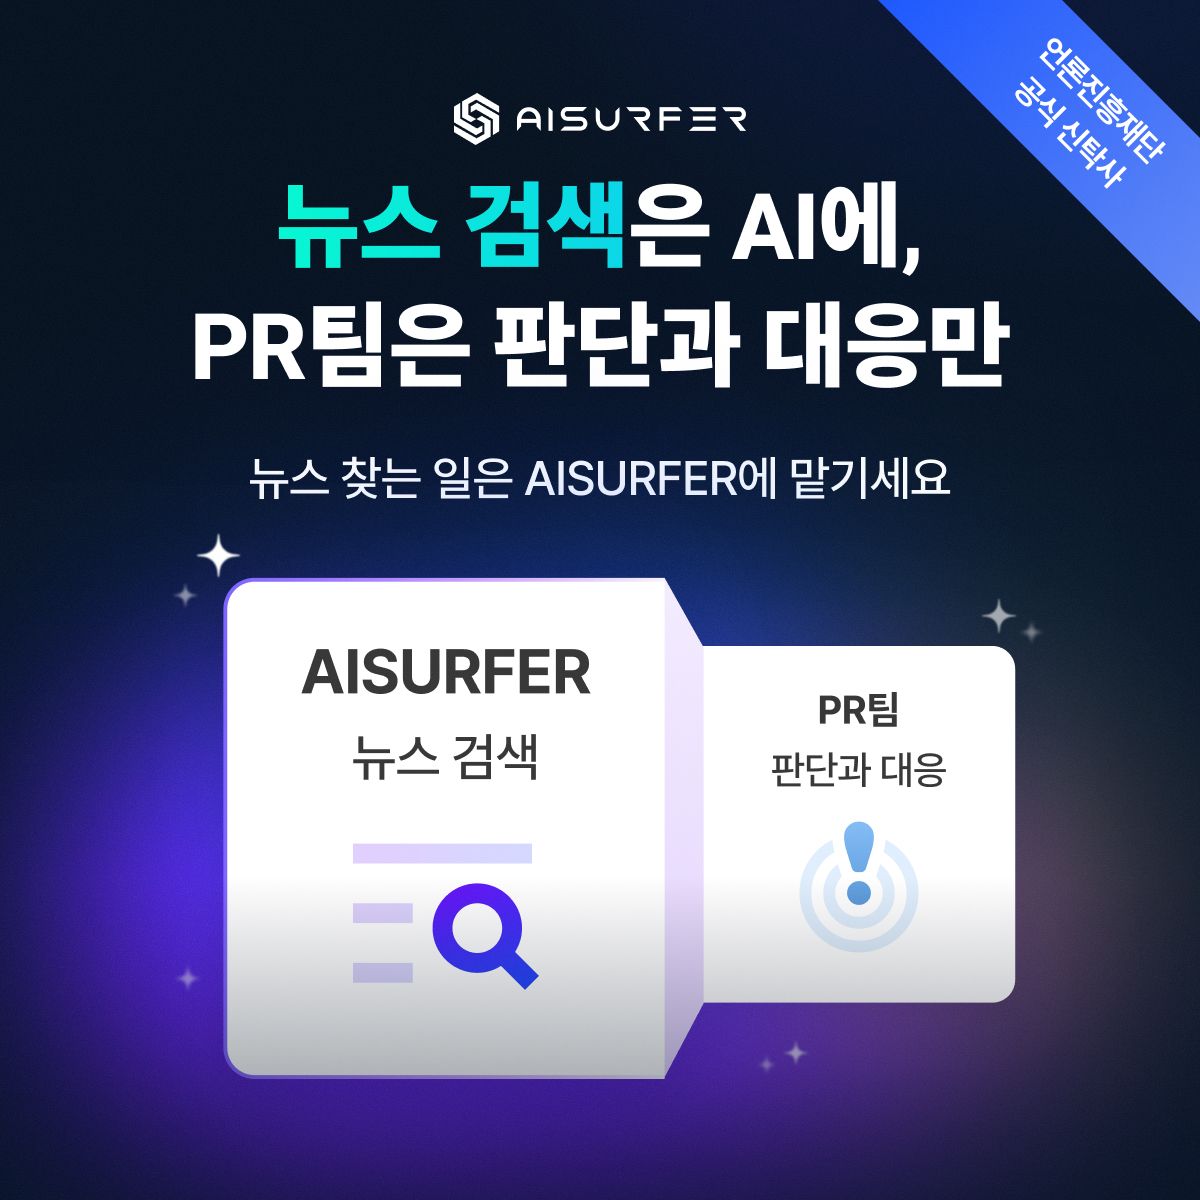
뉴스를 찾는 일은 AISURFER에 맡기고, PR팀은 판단과 대응에 집중하세요. 3,000여 개 매체를 AI가 대신 읽고 필요한 기사를 찾아드립니다. 문의를 남겨주시면 도입 방법을 빠르게 안내해 드리겠습니다.
- BECUAIRecorded 17 Oct 2026
뉴스를 찾는 일은 AISURFER에 맡기고, PR팀은 판단과 대응에 집중하세요. 3,000여 개 매체를 AI가 대신 읽고 필요한 기사를 찾아드립니다. 문의를 남겨주시면 도입 방법을 빠르게 안내해 드립니다.
- DataboxSince 15 Oct 2026
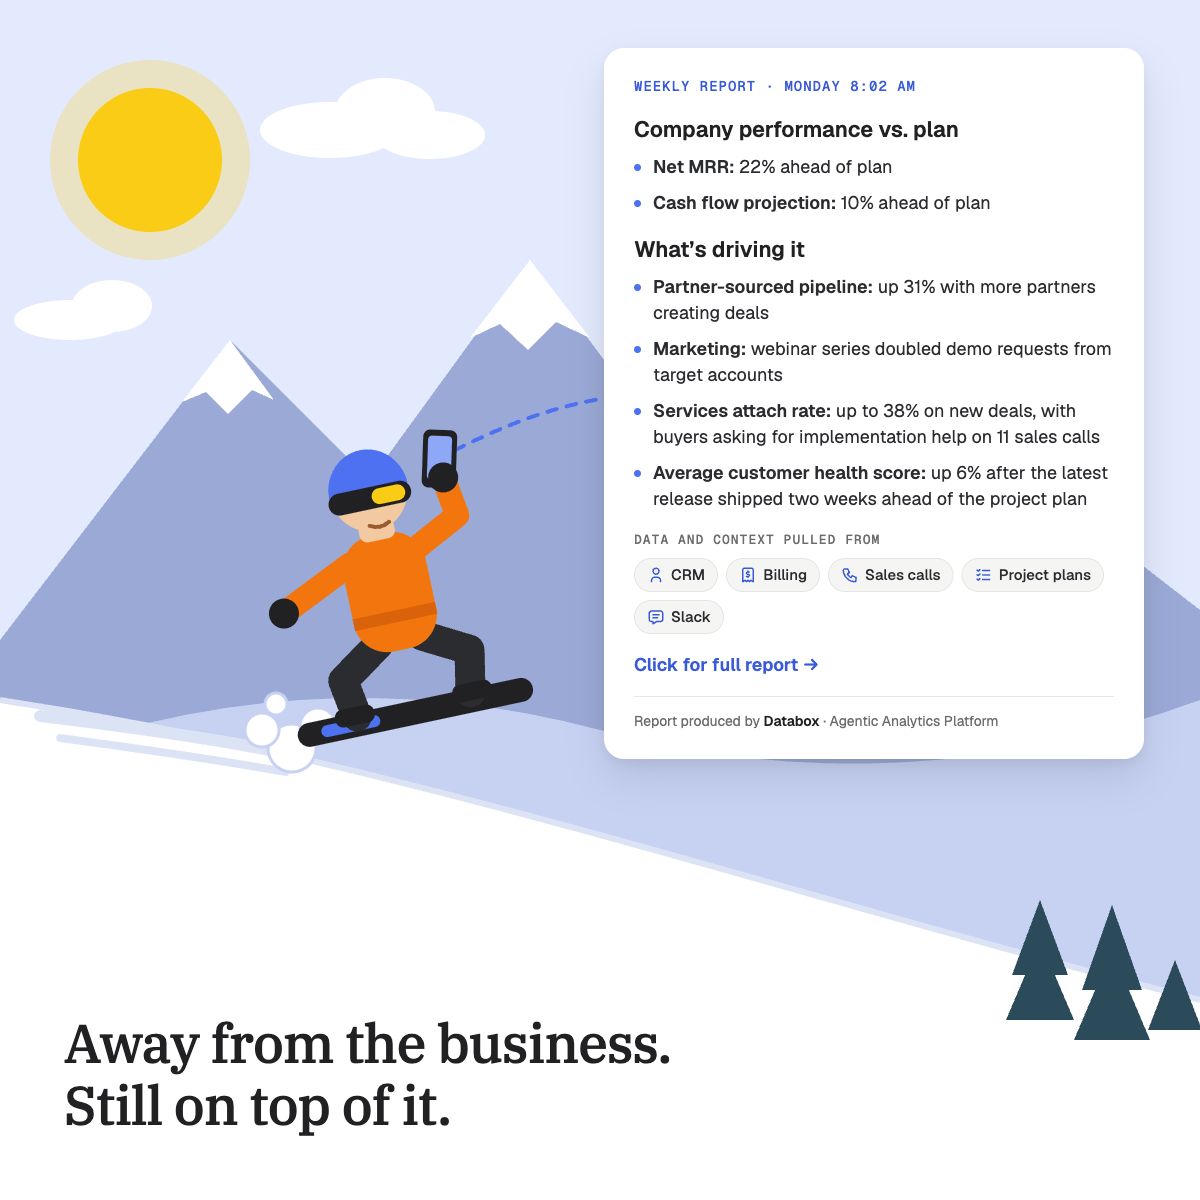
If I were the CEO of a mid-sized company and wanted to step away from the week-to-week running of the business without losing track of anything, I'd snap my fingers and build an operating system that does three things for me: ✅ A weekly brief showing how every team is tracking against plan and why, drawing on what was said in sales calls and Slack along with the numbers. ✅ An alert the moment something drifts off course, with the likely cause already diagnosed before anyone has to escalate it. ✅ An answer to any question I have about the business, grounded in both the data and the context, without pulling anyone into a meeting. This is how I'd build it, with each step depending on the one before it: 1️⃣ Get full visibility: connect every data source across the business, from the CRM and finance system to marketing, product and support, and pull in the context behind the numbers, including documented processes, sales call and meeting transcripts, Slack and project management. 2️⃣ Make everything measurable: build a semantic layer so every metric means the same thing to everyone and can be traced back to its source, define the metrics that matter for every team, and cascade goals down the entire org so every team and person has a number that ladders up to the company's. 3️⃣ Build a prediction model: map how those metrics drive each other, so anyone on the team can see which levers move revenue and profit and test how a change would affect them before making it. 4️⃣ Run autonomously: build skills that analyze every part of the business against its goals using both the numbers and the context, and run them on a schedule so the analysis happens every week on its own, with alerts that fire the moment something drifts. Execute as many activities as possible with AI that either initiates or facilitates work for the team, or does it completely autonomously. Oh wait, I don't need to snap my fingers. Everything on this list can already be built in Databox. Seriously, though. This is the operating system we've built to run Databox for 2027. Our software does all of this, and anyone can try it, for free, I might add: https://databox.com/signup But we're also rolling up our sleeves to help up to 10 companies build it, hands-on, pulling in our own people from across the business through our custom services (databox.com/services) and specialized partners, when needed. The 1st of 10 signed on this week. If it's something you want for your company, you know how to reach me. ⬇️ ⬇️ ⬇️
- DataboxSince 15 Oct 2026
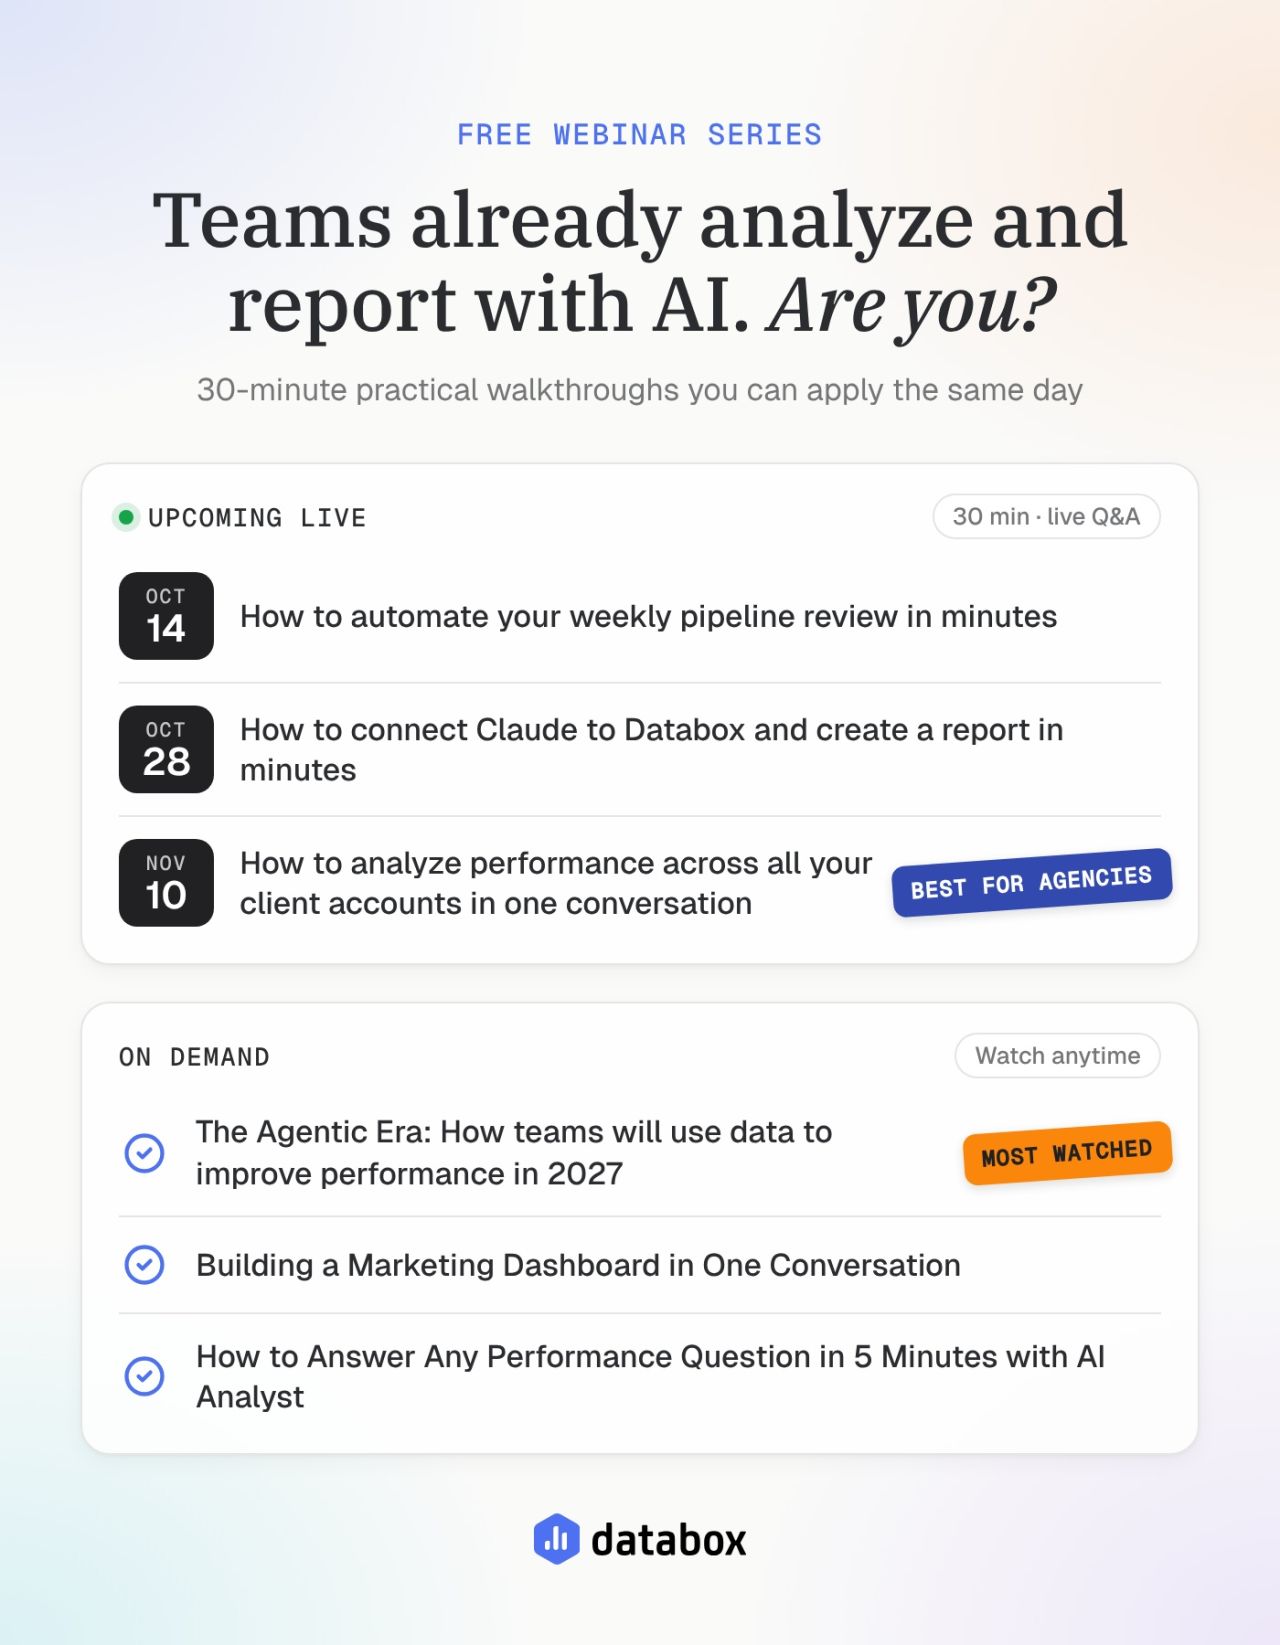
Fastest-growing teams are already handing analysis and reporting to AI, on data they trust. Learn how to do the same in practical 30-minute sessions. Each session in the Databox webinar series walks you through a specific reporting or analysis task with AI Analyst, so you leave with something you can apply that same day. Upcoming live: → Oct 28: How to connect Claude to Databox and create a report in minutes → Nov 10: How to analyze performance across all your client accounts in one conversation Watch on demand: ✓ The Agentic Era: How teams will use data to improve performance in 2027 ✓ Building a Marketing Dashboard in One Conversation ✓ How to Answer Any Performance Question in 5 Minutes with AI Analyst Register once for the whole series: https://lnkd.in/duZ4sxpJ/?utm_campaign=WinboxFullFunnelAds%255BAgency%255D&utm_source=linkedin&utm_medium=paid&utm_id=731734533&hsa_acc=513446957&hsa_cam=731734533&hsa_grp=361908443&hsa_ad=1584522183&hsa_net=linkedin&hsa_ver=3




Other LinkedIn formats
Watch the companies you care about.
Filter every ad by industry, country, format and network, and get alerts when a company you watch starts running new ads.