0 new LinkedIn ads in 30 days · 3 of 3 networks checked

SciChart ads
- scichart.com
- Software Development
- GB
- 12 employees
SciChart’s ads on LinkedIn, Meta and Google, recorded by adsrunning. Browse the latest here for free. Sign up free to browse our full recording. Watch SciChart on any plan to get each new one in your feed.
Watchlist included in every plan
What SciChart runs
- Single image · LinkedIn
- 2
- Video · LinkedIn
- 3
- Google ads on 8 Nov 2026
- 62
| Network | Status | Last 30 days | Total ads found | Ad activity | Checked | Next step |
|---|---|---|---|---|---|---|
| None recorded | 0 | 78+ | 11/11/2026 | View ads → | ||
| Meta | None recorded | — | — | 10/25/2026 | View ads → | |
| Ads recorded | 0 | 42 | 11/08/2026 | View ads → |
SciChart has no new LinkedIn ads in the last 30 days. Its Facebook page had no active ads on 25 Oct 2026, and we recorded 62 Google ads on 8 Nov 2026.
Latest ads
- LINKEDIN · VIDEOSince 1 Jun 2026
Rendering one chart is easy ... the real challenge is when everything has to run at once: ~30 synchronised charts, updating at 60Hz, in the browser. Solution: we built an 𝗙𝟭 𝘁𝗲𝗹𝗲𝗺𝗲𝘁𝗿𝘆 𝗱𝗮𝘀𝗵𝗯𝗼𝗮𝗿𝗱 in React using 𝗦𝗰𝗶𝗖𝗵𝗮𝗿𝘁.𝗷𝘀 (beta v6) with WebGPU support - the kind of real‑world workload where most charting systems start to struggle. Watch for more - coming soon. Discover why SciChart is the no. 1 choice for 𝗔𝘂𝘁𝗼𝗺𝗼𝘁𝗶𝘃𝗲 & 𝗠𝗼𝘁𝗼𝗿𝘀𝗽𝗼𝗿𝘁: https://lnkd.in/dxtrR8kq. #F1 #motorsport #telemetry #JavaScript #React #chartlibrary #bigdata
- LINKEDIN · VIDEOSince 1 Jun 2026
Normally our demo videos do pretty well, so I was surprised when this one got almost no engagement 😄 So here’s the dashboard again - this time without the racing simulator. This is an F1 telemetry dashboard built in React using beta v6 of SciChart.js with WebGPU support. The screen is rendering ~30 synchronized realtime visualizations simultaneously: * gauges * track maps * heatmaps * 3D charts * live telemetry traces * streaming timeseries data …all updating at 60Hz directly in the browser. What makes this kind of application difficult isn’t drawing one chart - it’s maintaining low latency and smooth interaction when everything updates continuously at the same time. This is the kind of workload we built SciChart for: F1 telemetry, aerospace & defence, medical monitoring, industrial systems, and high-performance finance/trading applications. If your application has a “this probably can’t run in a browser” requirement, that’s usually where SciChart comes in. #ReactJS #WebGPU #WebGL #DataVisualization #JavaScript #WebAssembly #F1 #Telemetry #Engineering
- LINKEDIN · IMAGESince 8 Apr 2026
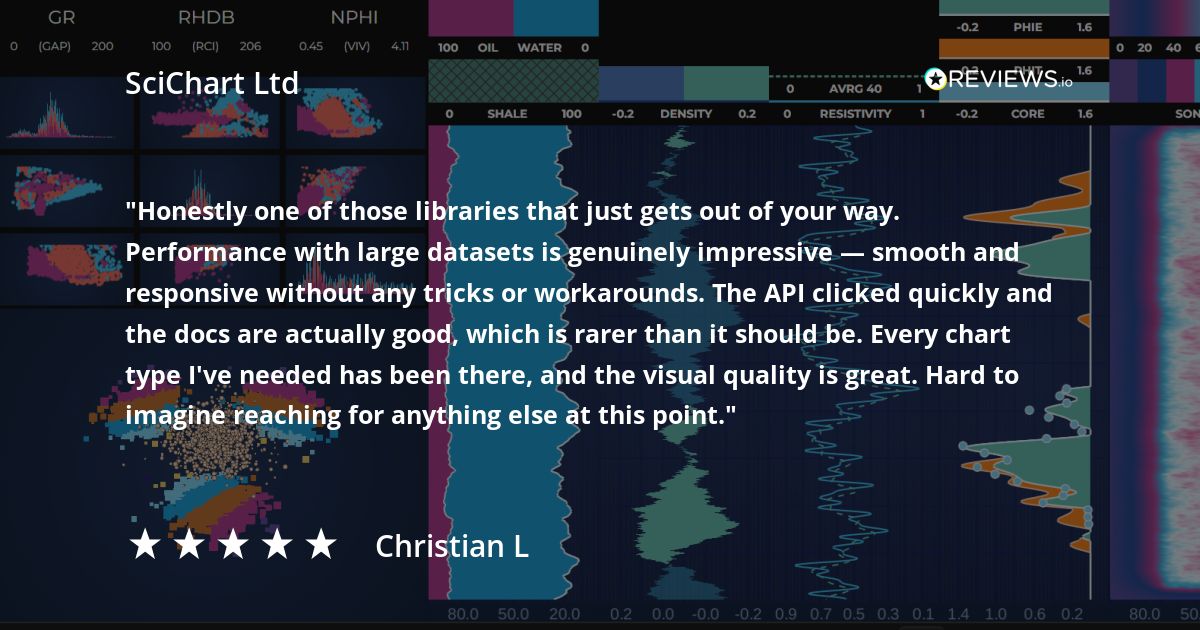
Thank you to Christian for this verified review on REVIEWS.io (https://lnkd.in/ezTcFUe), where SciChart has a consistent recommendation rating of 𝟵𝟳%. On 𝘱𝘦𝘳𝘧𝘰𝘳𝘮𝘢𝘯𝘤𝘦 𝘸𝘪𝘵𝘩 𝘭𝘢𝘳𝘨𝘦 𝘥𝘢𝘵𝘢𝘴𝘦𝘵𝘴, this demo showcases that SciChart is capable of rendering 𝟭 𝗯𝗶𝗹𝗹𝗶𝗼𝗻 (𝟭,𝟬𝟬𝟬,𝟬𝟬𝟬,𝟬𝟬𝟬) 𝗽𝗼𝗶𝗻𝘁𝘀 in real-time, at 60 fps: https://lnkd.in/ddyHxHRQ. It uses FIFO series to discard old data-points, once a predefined number of points is met. Get started with SciChart today in 𝗝𝗮𝘃𝗮𝗦𝗰𝗿𝗶𝗽𝘁, 𝗪𝗣𝗙, 𝗶𝗢𝗦 & 𝗺𝗮𝗰𝗢𝗦, 𝗔𝗻𝗱𝗿𝗼𝗶𝗱 and 𝗔𝘃𝗮𝗹𝗼𝗻𝗶𝗮 - with SciChart for 𝗕𝗹𝗮𝘇𝗼𝗿 now in Alpha: https://lnkd.in/dHRkU6aU. #bigdata #datavisualization #chartlibrary #SciChart #highperformancedata #telemetry #dataengineering #softwarereviews
- LINKEDIN · IMAGESince 2 Apr 2026
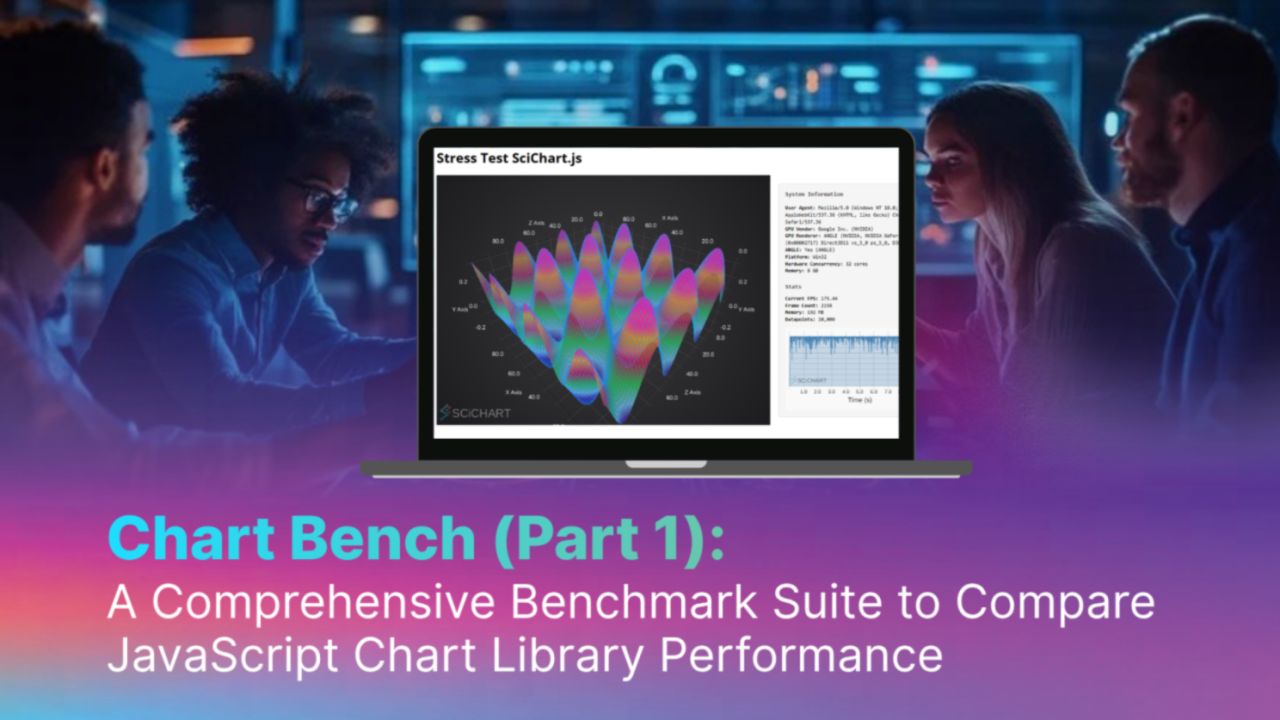
Which 𝗝𝗮𝘃𝗮𝗦𝗰𝗿𝗶𝗽𝘁 𝗰𝗵𝗮𝗿𝘁𝗶𝗻𝗴 𝗹𝗶𝗯𝗿𝗮𝗿𝘆 is actually the 𝘧𝘢𝘴𝘵𝘦𝘴𝘵, right now? We really wanted to know, so we ran this in-depth performance comparison: https://lnkd.in/d6W8U737. Everyone says “performance matters” - but actually comparing chart libraries properly can be a pain: different setups; different datasets, different claims … not exactly apples to apples. But our engineers managed to do it, and the result is 𝘊𝘩𝘢𝘳𝘵 𝘉𝘦𝘯𝘤𝘩 - an open-source benchmarking suite for JS chart libraries. Across multiple chart types and scenarios, it looks at things like: • 𝗙𝗣𝗦 𝘂𝗻𝗱𝗲𝗿 𝗹𝗼𝗮𝗱 • 𝗧𝗶𝗺𝗲 𝘁𝗼 𝗳𝗶𝗿𝘀𝘁 𝗿𝗲𝗻𝗱𝗲𝗿 • 𝗠𝗲𝗺𝗼𝗿𝘆 𝘂𝘀𝗮𝗴𝗲 • 𝗗𝗮𝘁𝗮 𝗶𝗻𝗴𝗲𝘀𝘁𝗶𝗼𝗻 𝗿𝗮𝘁𝗲𝘀 The idea is pretty solid: instead of trusting vendor benchmarks, you can run it yourself and see what holds up on your machine. We're curious to get your feedback here: • Have you run proper benchmarks before choosing a charting library? • If yes, what mattered most in your case - raw FPS, stability or dev experience? If you want to delve into 𝘊𝘩𝘢𝘳𝘵 𝘉𝘦𝘯𝘤𝘩, here it is:: https://lnkd.in/d6W8U737. “All successful companies are constantly benchmarking their competition.” - 𝗝𝗮𝗺𝗲𝘀 𝗗𝘂𝗻𝗻 #VisualAnalytics #DashboardDesign #DataDriven #SoftwareEngineering #PerformanceEngineering
- LINKEDIN · VIDEOSince 27 Mar 2026
SciChart is used extensively in F1 racing, one of the most demanding applications for realtime telemetry monitoring. Below, we've created a demo of a 'Racing Dashboard' in #WPF, entirely using #MVVM with multiple charts linked Top charts: Tyre/Exhaust/Oil/Coolant Temperatures, Speed (Kph), Wheel speeds, Engine RPM, Gear, DRS, Throttle %, Brake %. All plotted with xAxis = Distance (meters) or time (seconds) Bottom charts: cross-domain analysis: choosing any two factors e.g. RPM vs. Speed, Exhaust Temp vs. RPM, Coolant vs. RPM, Oil temp vs. RPM, Speed vs. Temps. Tooltips & zooming/panning operations are synchronised across charts, with one mouse-over updating the legends on the left. We'll be packaging this as a featured app in the SciChart WPF demo soon, but for now, here's a preview 👉
- LINKEDIN · ARTICLESince 26 Mar 2026
𝟮𝟬𝟮𝟲 𝘀𝗵𝗮𝗽𝗲𝘀 𝘂𝗽 𝘁𝗼 𝗯𝗲 𝗮 𝗱𝗲𝗳𝗶𝗻𝗶𝗻𝗴 𝘆𝗲𝗮𝗿 𝗳𝗼𝗿 𝗦𝗰𝗶𝗖𝗵𝗮𝗿𝘁 𝗶𝗻 𝘁𝗲𝗿𝗺𝘀 𝗼𝗳 𝗽𝗲𝗿𝗳𝗼𝗿𝗺𝗮𝗻𝗰𝗲 Both energy and expertise have been poured into SciChart over the last few months, as evidenced by performance-focused releases and updates for 𝗪𝗣𝗙, 𝗝𝗮𝘃𝗮𝗦𝗰𝗿𝗶𝗽𝘁 and 𝗶𝗢𝗦/𝗔𝗻𝗱𝗿𝗼𝗶𝗱, as well as recent Finalist placements in both the 𝗦𝗺𝗮𝗿𝘁𝗲𝗿 𝗦𝗽𝗼𝗿𝘁𝘀 𝗔𝘄𝗮𝗿𝗱𝘀 and the British Data Awards. Catch up on the last quarter in the new edition of the SciChart newsletter, with thanks to our global community for building with us! #newsletter #techawards #bigdata #datavisualization #WPF #JavaScript #dataengineers

6 of 78+ adsSign up to see every SciChart ad, filter by format and date, and get alerts on new ones.
See all 78+ adsOn Google Search, YouTube and Display
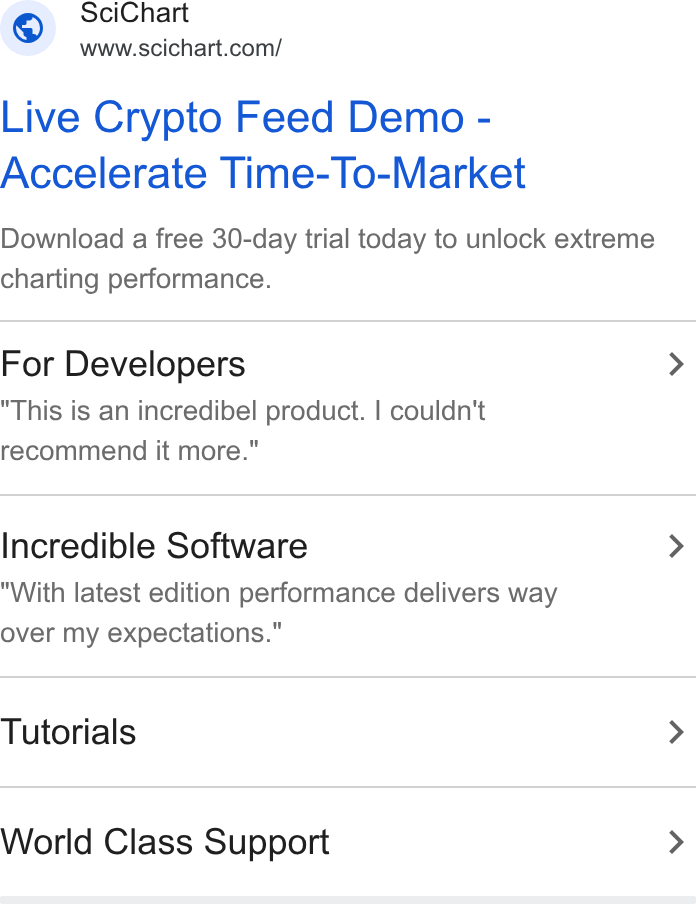
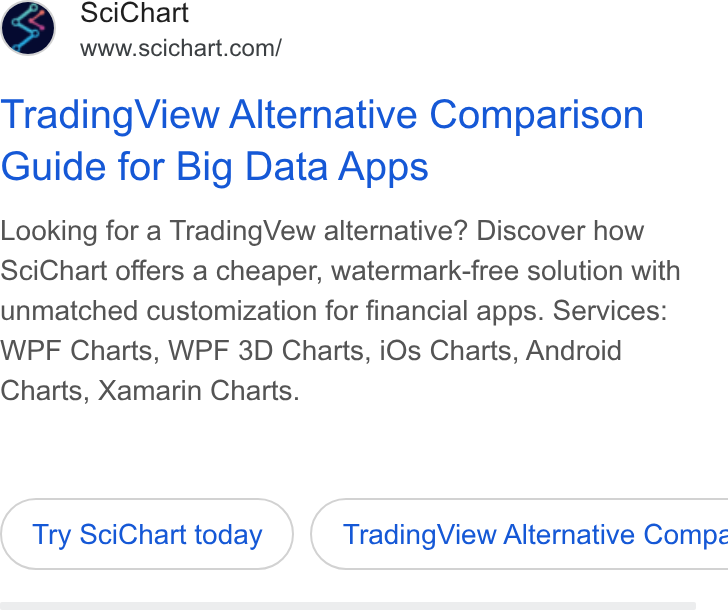
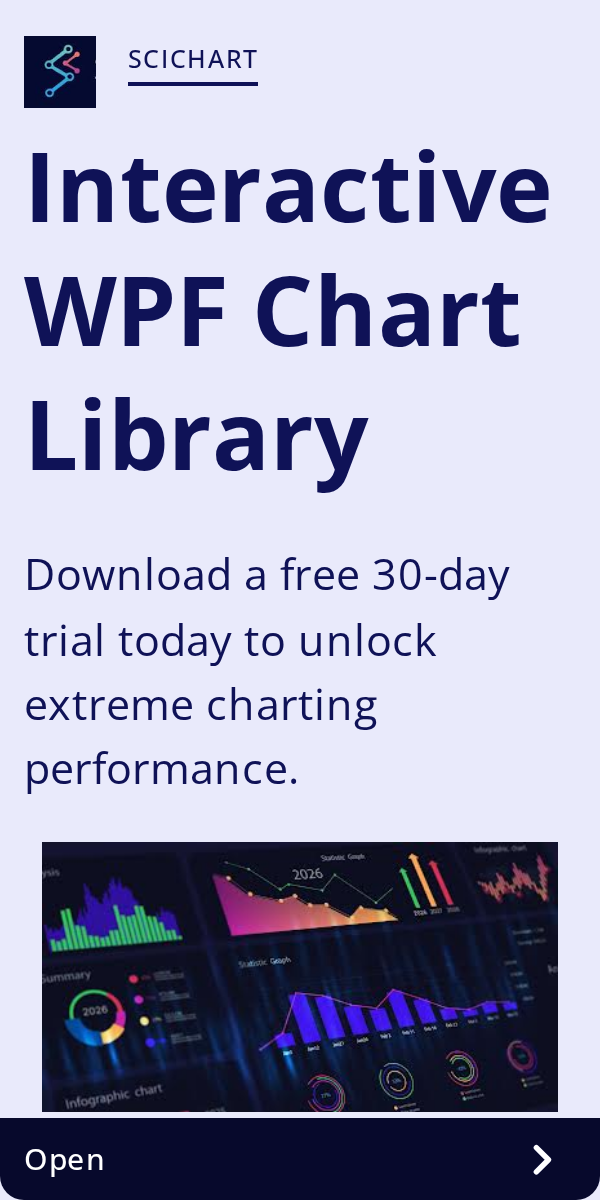
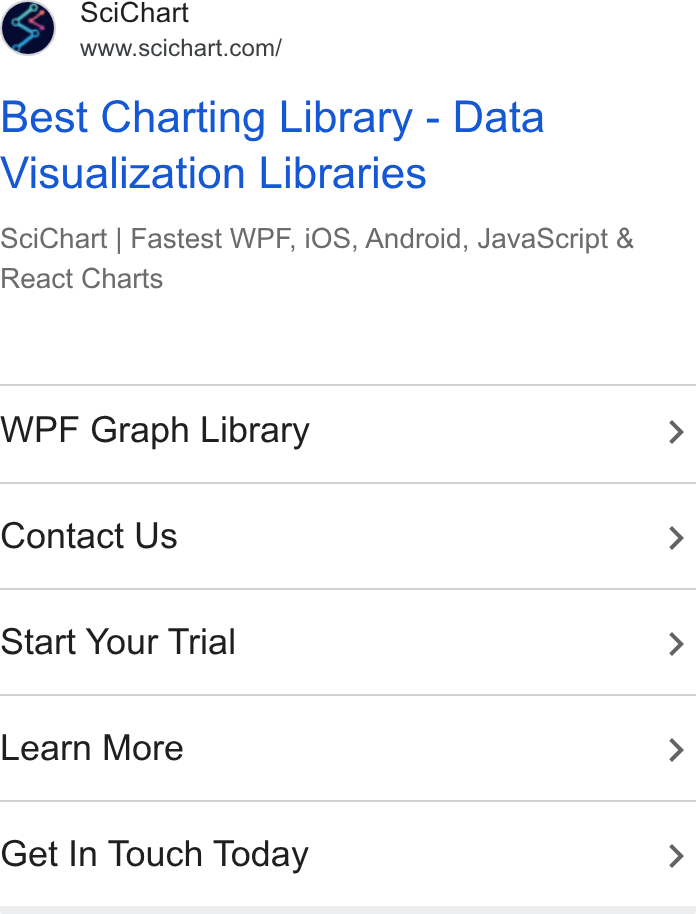
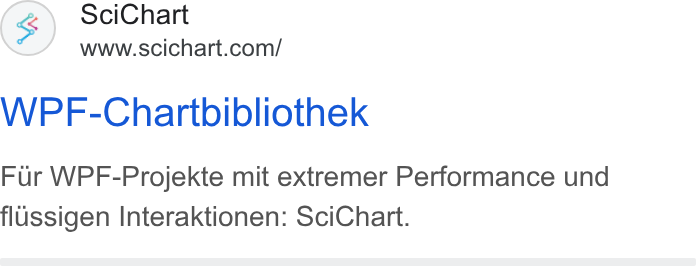
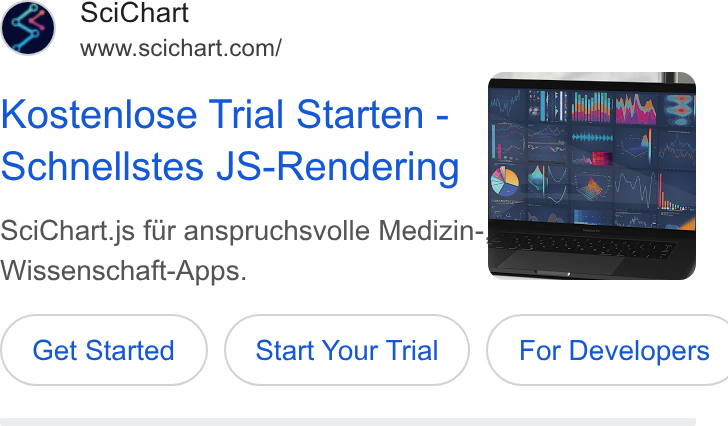
Domain scichart.com · 62 ads on the Transparency Center, checked 8 Nov 2026 · 42 recorded
- All 20
- Image 4
- Video 3
- Text 13
- GOOGLE · TEXTLast shown 1 Nov 2026
First shown 26 Oct 2026
- GOOGLE · TEXTLast shown 1 Nov 2026
First shown 21 Sept 2026
- GOOGLE · TEXTLast shown 2 Nov 2026
First shown 19 Sept 2026
- GOOGLE · TEXTLast shown 2 Oct 2026
First shown 17 Sept 2026
- GOOGLE · IMAGELast shown 2 Nov 2026
First shown 17 Sept 2026
- GOOGLE · TEXTLast shown 2 Oct 2026
First shown 17 Sept 2026

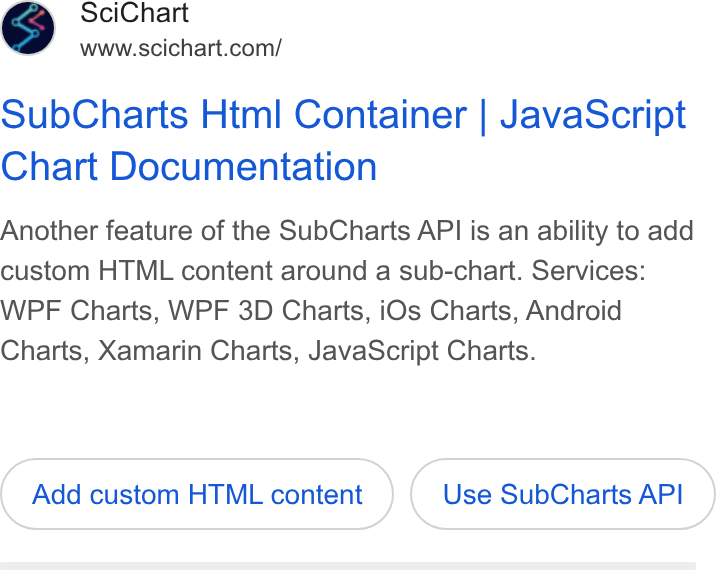
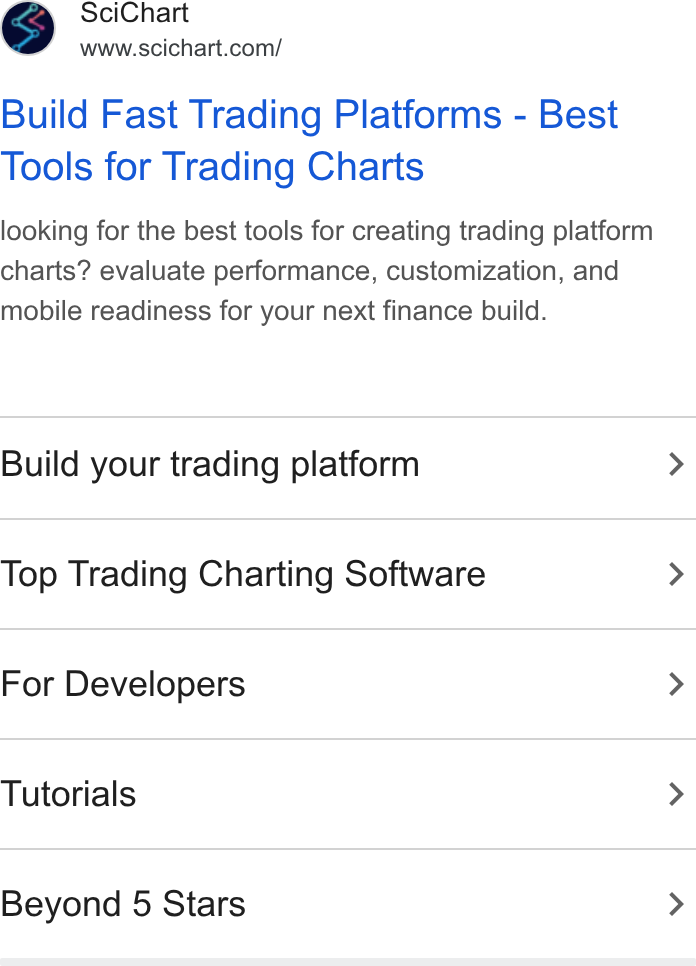
Show 14 more Google ads
 Video previewGOOGLE · VIDEOLast shown 2 Nov 2026
First shown 16 Sept 2026
- GOOGLE · TEXTLast shown 2 Oct 2026
First shown 11 Aug 2026
- GOOGLE · TEXTLast shown 2 Nov 2026
First shown 10 Aug 2026
- GOOGLE · TEXTLast shown 2 Oct 2026
First shown 9 Aug 2026
- GOOGLE · IMAGELast shown 2 Nov 2026
First shown 8 Aug 2026
 Video previewGOOGLE · VIDEOLast shown 2 Nov 2026
First shown 8 Aug 2026
- GOOGLE · TEXTLast shown 1 Nov 2026
First shown 8 Jul 2026
- GOOGLE · IMAGELast shown 31 Oct 2026
First shown 8 Jun 2026
- GOOGLE · IMAGELast shown 1 Nov 2026
First shown 22 May 2026
- GOOGLE · TEXTLast shown 2 Nov 2026
First shown 19 May 2026
- GOOGLE · TEXTLast shown 1 Nov 2026
First shown 19 May 2026
 Video previewGOOGLE · VIDEOLast shown 1 Nov 2026
First shown 18 May 2026
- GOOGLE · TEXTLast shown 1 Nov 2026
First shown 10 Mar 2026
- GOOGLE · TEXTLast shown 1 Nov 2026
First shown 9 Mar 2026
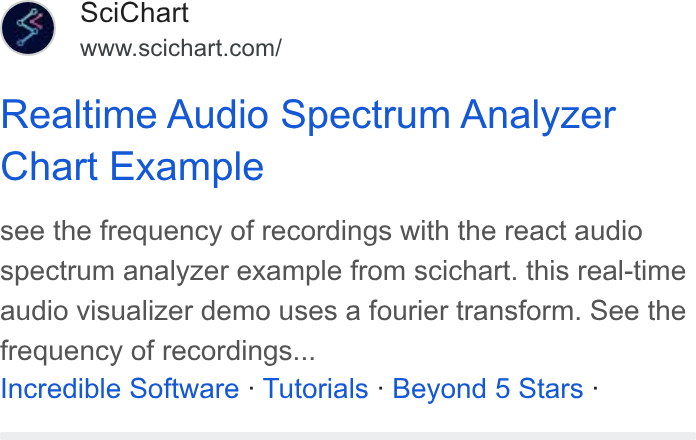
Questions about SciChart’s ads
Does SciChart have new LinkedIn ads?
We found no new LinkedIn ads for SciChart in the 30 days to 12 Nov 2026.
How many LinkedIn ads has SciChart run?
LinkedIn’s ad library lists 67 ads for SciChart. We recorded 78 LinkedIn ads for SciChart, first recorded on 30 Sept 2026 and last recorded on 30 Sept 2026.
Does SciChart advertise on Facebook and Instagram?
SciChart’s Facebook page had no active ads in Meta’s Ad Library, last recorded on 25 Oct 2026.
Does SciChart run Google ads?
Yes. We recorded 62 Google ads for the domain scichart.com on 8 Nov 2026.
Which ad formats does SciChart use?
The 6 LinkedIn ads on this page include 2 image ads and 3 video ads.
Watch the companies you care about.
Filter every ad by industry, country, format and network, and get alerts when a company you watch starts running new ads.