0 new LinkedIn ads in 30 days · 2 of 3 networks checked

Rezatec ads
- rezatec.com
- IT Services and IT Consulting
- GB
- 24 employees
Rezatec’s ads on LinkedIn, Meta and Google, recorded by adsrunning. Browse the latest here for free. Sign up free to browse our full recording. Watch Rezatec on any plan to get each new one in your feed.
Watchlist included in every plan
What Rezatec runs
- Single image · LinkedIn
- 6
- Google ads on 7 Nov 2026
- 15
| Network | Status | Last 30 days | Total ads found | Ad activity | Checked | Next step |
|---|---|---|---|---|---|---|
| None recorded | 0 | 49+ | 11/11/2026 | View ads → | ||
| Meta | Not checked | — | — | View ads → | ||
| Ads recorded | — | — | 11/07/2026 | View ads → |
Rezatec has no new LinkedIn ads in the last 30 days. We recorded 15 Google ads on 7 Nov 2026.
Latest ads
- LINKEDIN · IMAGESince 20 Sept 2026
Ground movement rarely happens overnight, but its impact on critical infrastructure can be significant. Subsidence, heave, lateral movement, and foundation settlement all build gradually. Between scheduled turnarounds and inspections, that gradual change is invisible to most integrity programs, until it shows up as a problem on the asset itself. In our webinar, Todd Sajwaj, Head of Research and Data Science at Rezatec, and Bon Saunders, Account Executive at Paulin Research Group, explore how satellite-derived geospatial intelligence helps integrity teams monitor ground movement across pipelines, storage tanks, and other critical infrastructure between those cycles. You'll learn how to: • Identify emerging ground movement and geohazard activity • Prioritize pipeline segments and storage tanks for further investigation • Extend visibility between established inspection cycles • Apply satellite monitoring across pipelines, terminals, tank farms, and heavy oil operations • Integrate geospatial intelligence into existing integrity management workflows Satellite monitoring is designed to complement, not replace, the inspection work your team already does: inline inspection, API 653 inspections, geotechnical surveys, and fitness-for-service assessments. Fill in the form below to watch the full recording.
- LINKEDIN · IMAGESince 19 Sept 2026
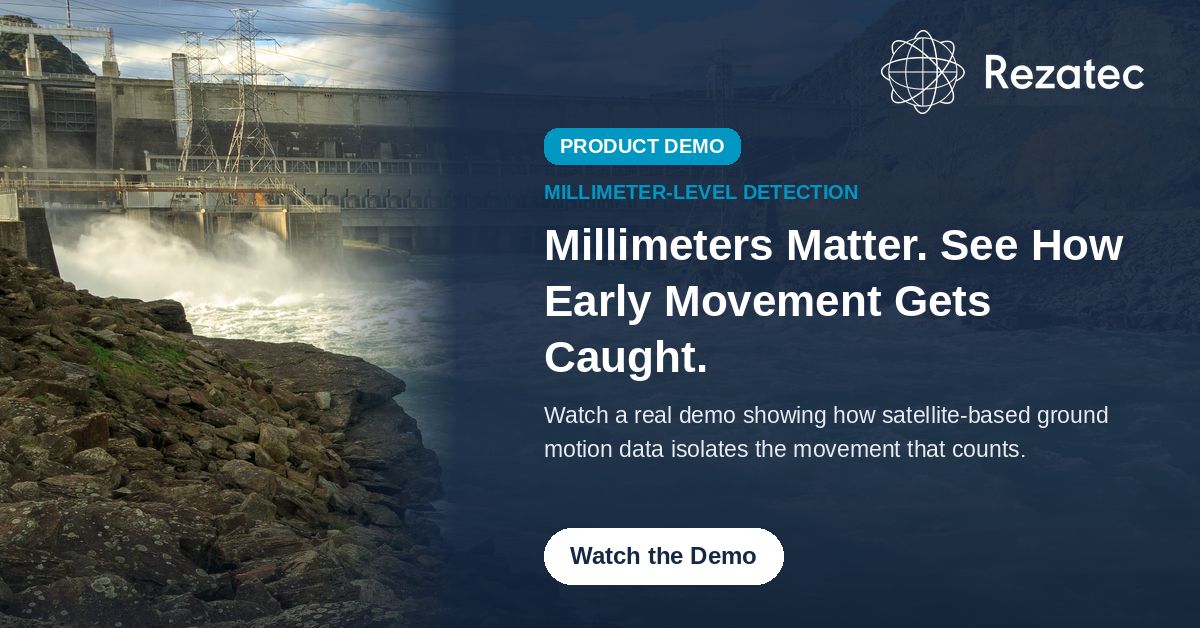
A dam can move millimeters a year for a decade before anyone notices, if nobody's tracking it continuously. Our ground motion demo shows how satellite-based InSAR data catches movement at that scale, using a large embankment dam as a worked example. The demo walks through years of monitoring data, isolating the most significant movement across the structure and putting the numbers in context: a shift that would be alarming on a smaller asset but is relatively modest given the scale of a dam this size, even as the technology remains sensitive enough to detect it clearly. You'll see: • 3D visualization of settlement, uplift, and movement trends across the full structure • How seasonal variation shows up, often more pronounced on concrete sections due to thermal expansion • How to bring any number of monitoring points onto one unified, normalized graph • How environmental datasets like water level and vegetation vigour add context to the movement data This is real monitoring data, walked through step by step. Fill in the form below to watch the full demo.
- LINKEDIN · IMAGESince 19 Sept 2026
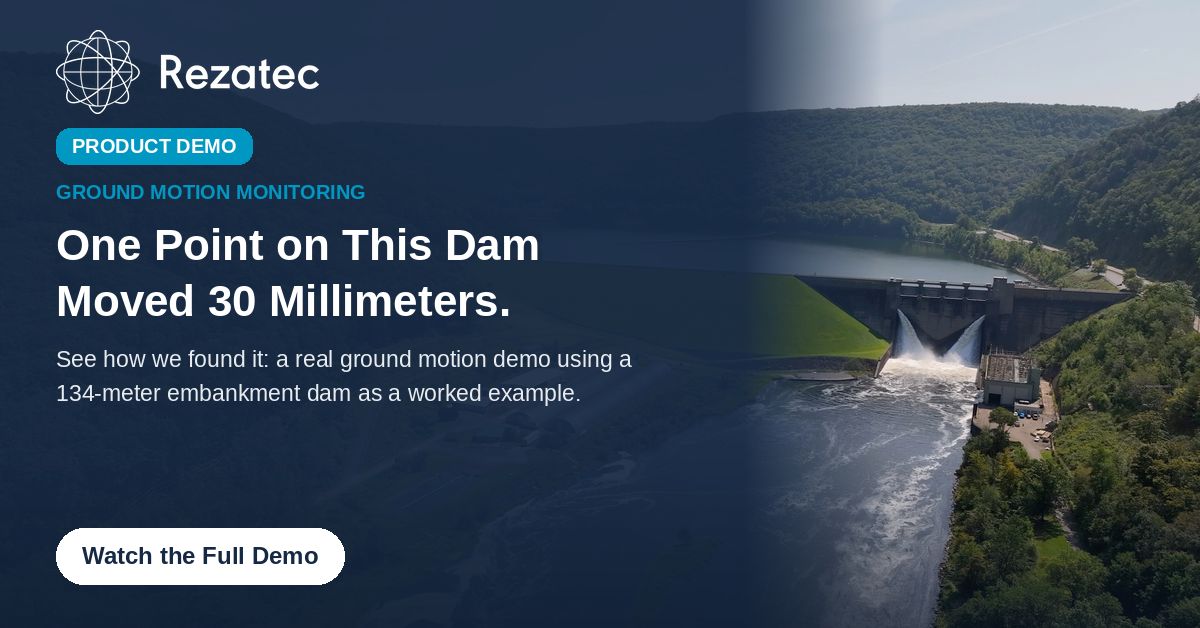
One highlighted point on a large embankment dam showed over 30 millimeters of displacement. Another, just a short distance away, showed around minus 1 millimeter. Our ground motion demo walks through exactly how that difference gets found and explained, using a 134-meter earth-fill, clay-core embankment dam as a worked example. The crest of the structure shows the greatest overall vertical settlement, around minus 40 to 50 millimeters from the monitoring base point over several years, a level that would be alarming on a smaller asset but is relatively modest given the scale of a dam this size, even as the technology stays sensitive enough to catch it. In the demo, you'll see: • 3D visualization of movement across the full structure, with filters to isolate what matters most • How seasonal variation shows up, often tied to environmental change through the year • How to bring data from any number of monitoring points onto one unified, normalized graph for direct comparison • How environmental datasets like water level, vegetation vigour, and moisture layer into the picture This is a real, worked demonstration, not a mockup. Fill in the form below to watch the full demo.
- LINKEDIN · IMAGESince 19 Sept 2026
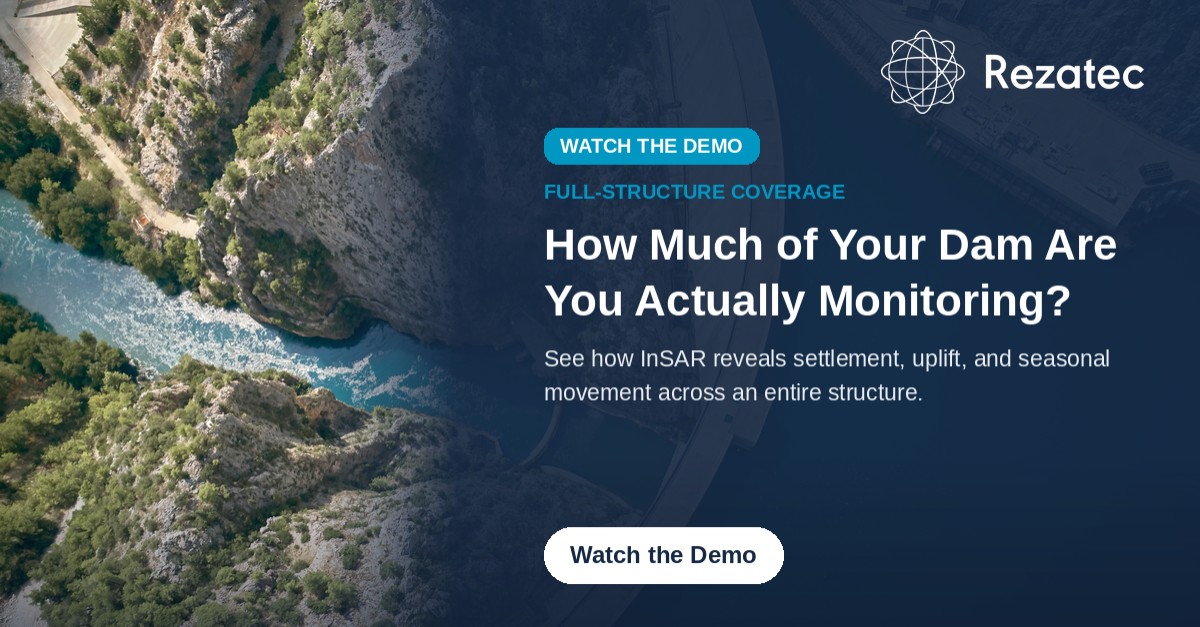
How much of your dam are you actually monitoring? Traditional sensors only tell part of the story. Piezometers and inclinometers are accurate at the point they're installed, but everything between those points is unmeasured until the next field visit. We've recorded a demo showing what full-structure coverage actually looks like in practice, using a large embankment dam as a worked example. You'll see 3D visualization of ground motion across years of data, with filters to isolate the most significant movement anywhere on the structure. The demo covers: • Where settlement and uplift are actually occurring across the dam, not just at instrumented points • How to put movement in context: a shift that would be alarming on a small structure but is modest at scale • Seasonal variation driven by environmental change, and how it shows up differently on concrete versus earth-fill sections • Comparing multiple monitoring points on one unified, normalized graph If you manage a dam or a portfolio of them, this is a look at what satellite-based InSAR coverage catches that point sensors can't. Complete the form below to watch it.
- LINKEDIN · IMAGESince 19 Sept 2026
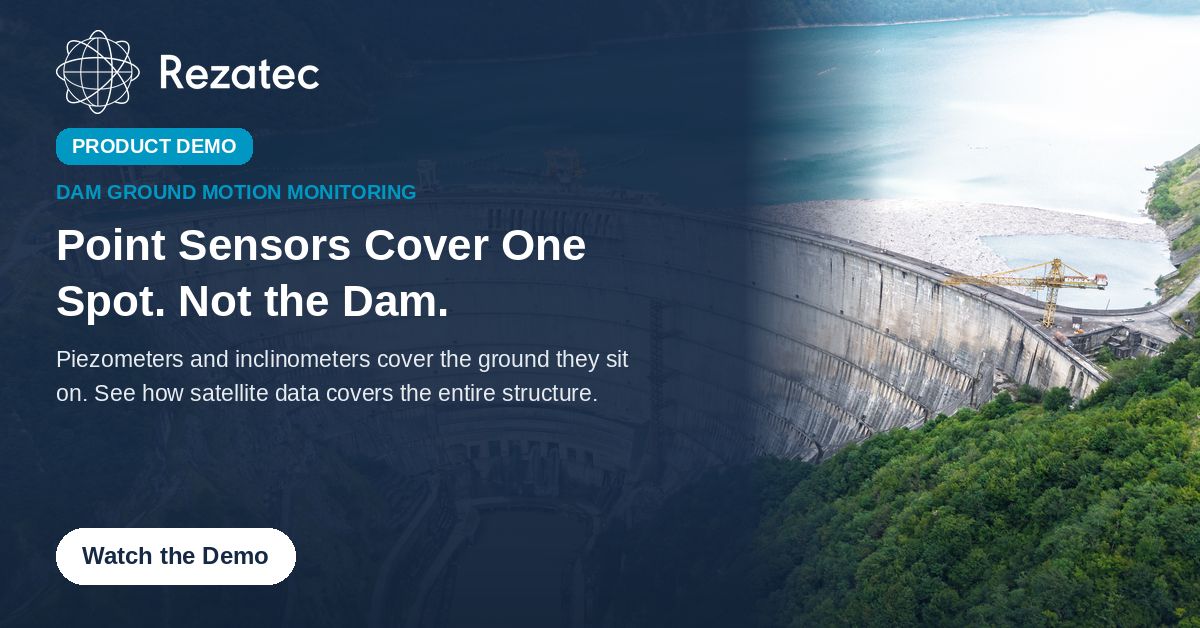
Point sensors answer questions at specific locations, but they don't monitor what's important: the dam. Piezometers, inclinometers, and visual inspections capture data where instruments happen to be installed or where someone happens to walk. The areas between those points, most of the structure, go unrecorded until the next field visit. We've put together a demo showing how satellite-based InSAR measures ground motion across an entire dam on every orbital pass, with millimetric-level detection. Using a large embankment dam as a worked example, you'll see how the platform isolates settlement, uplift, and seasonal movement across years of monitoring, both retrospectively and as new data comes in. You'll see: • How movement gets put in context: what's alarming on a small structure versus what's expected on a dam of scale • How seasonal variation shows up differently across concrete and earth-fill sections • How to compare movement across multiple points on one unified, normalized graph • How environmental datasets like water level and vegetation vigour layer into the picture This changes what dam safety teams can see between inspections. Fill in the form below to watch the full demo.
- LINKEDIN · IMAGESince 19 Sept 2026
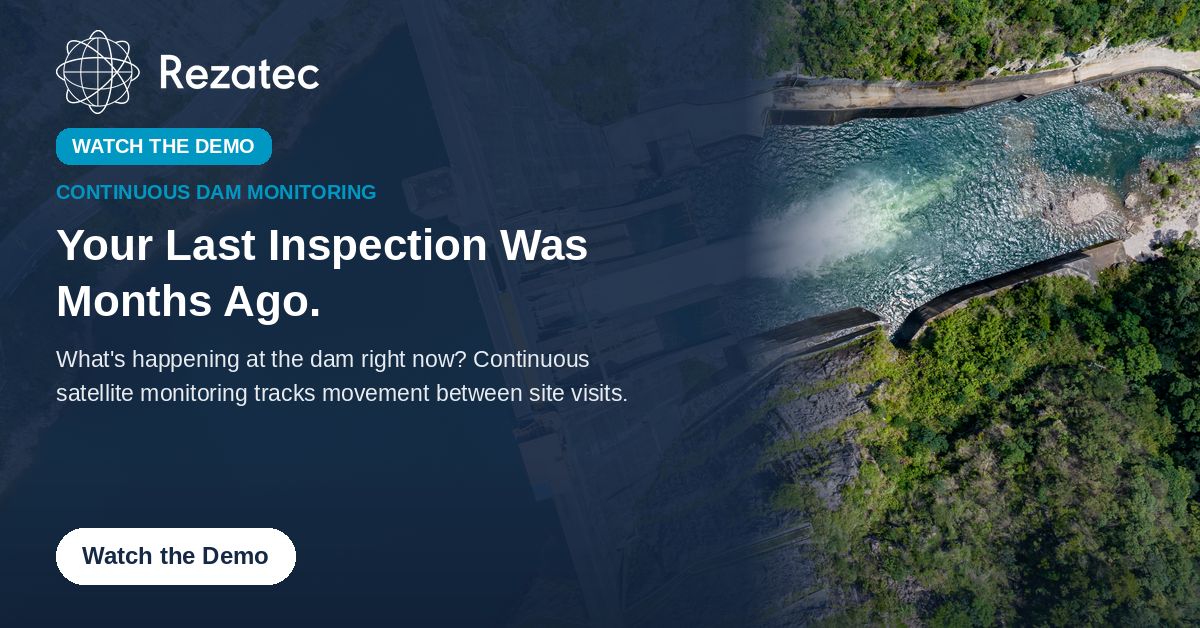
Your last field inspection was months ago. Your next one isn't for a while yet. What's happening at the dam right now? Most dam safety programs are built around scheduled visits and a handful of instrumented points. Between those visits, settlement and ground movement don't pause, they just go unrecorded until someone walks the structure again. We've put together a demo showing what continuous satellite-based monitoring adds to that picture. Using a large embankment dam as a worked example, you'll see how InSAR data tracks movement across years, both retrospectively and as new data is added, with 3D visualization that makes it easy to see where the structure is moving and by how much. What the demo covers: • Isolating the most significant movement across the full structure, not just at instrumented points • Putting movement numbers in context: what's expected at scale versus what warrants a closer look • Seasonal variation and what typically drives it • Comparing monitoring points on one unified, normalized graph across custom time periods Complete the short form below and the full demo is yours to watch.

6 of 49+ adsSign up to see every Rezatec ad, filter by format and date, and get alerts on new ones.
See all 49+ adsQuestions about Rezatec’s ads
Does Rezatec have new LinkedIn ads?
We found no new LinkedIn ads for Rezatec in the 30 days to 11 Nov 2026.
How many LinkedIn ads has Rezatec run?
LinkedIn’s ad library lists 49 ads for Rezatec. We recorded 49 LinkedIn ads for Rezatec, first recorded on 29 Sept 2026 and last recorded on 29 Sept 2026.
Does Rezatec run Google ads?
Yes. We recorded 15 Google ads for the domain rezatec.com on 7 Nov 2026.
Which ad formats does Rezatec use?
The 6 LinkedIn ads on this page include 6 image ads.
Watch the companies you care about.
Filter every ad by industry, country, format and network, and get alerts when a company you watch starts running new ads.