On air · 1 of 3 networks

Quant Insight ads
- quant-insight.com
- Financial Services
- GB
- 27 employees
Quant Insight’s ads on LinkedIn, Meta and Google, recorded by adsrunning. Browse the latest here for free. Sign up free to see all 24. Watch Quant Insight on any plan to get each new one in your feed.
Watchlist included in every plan
What Quant Insight runs
- Single image · LinkedIn
- 6
- Google ads on 6 Nov 2026
- 6
| Network | Status | Live ads | Nov 2025LinkedIn activity · 52 weeksNov 2026 | Checked | Next step |
|---|---|---|---|---|---|
| None recorded | 0 | Checked 7 Nov 2026 | See all 24 ads → | ||
| Meta | Not checked | — | |||
| Running | 6 | Ads on the Google Ads Transparency Center | Checked 6 Nov 2026 | Collect them with the API → |
Quant Insight has no live LinkedIn ads. We recorded 6 Google ads on 6 Nov 2026.
Latest ads
- LINKEDIN · IMAGESince 3 Nov 2026
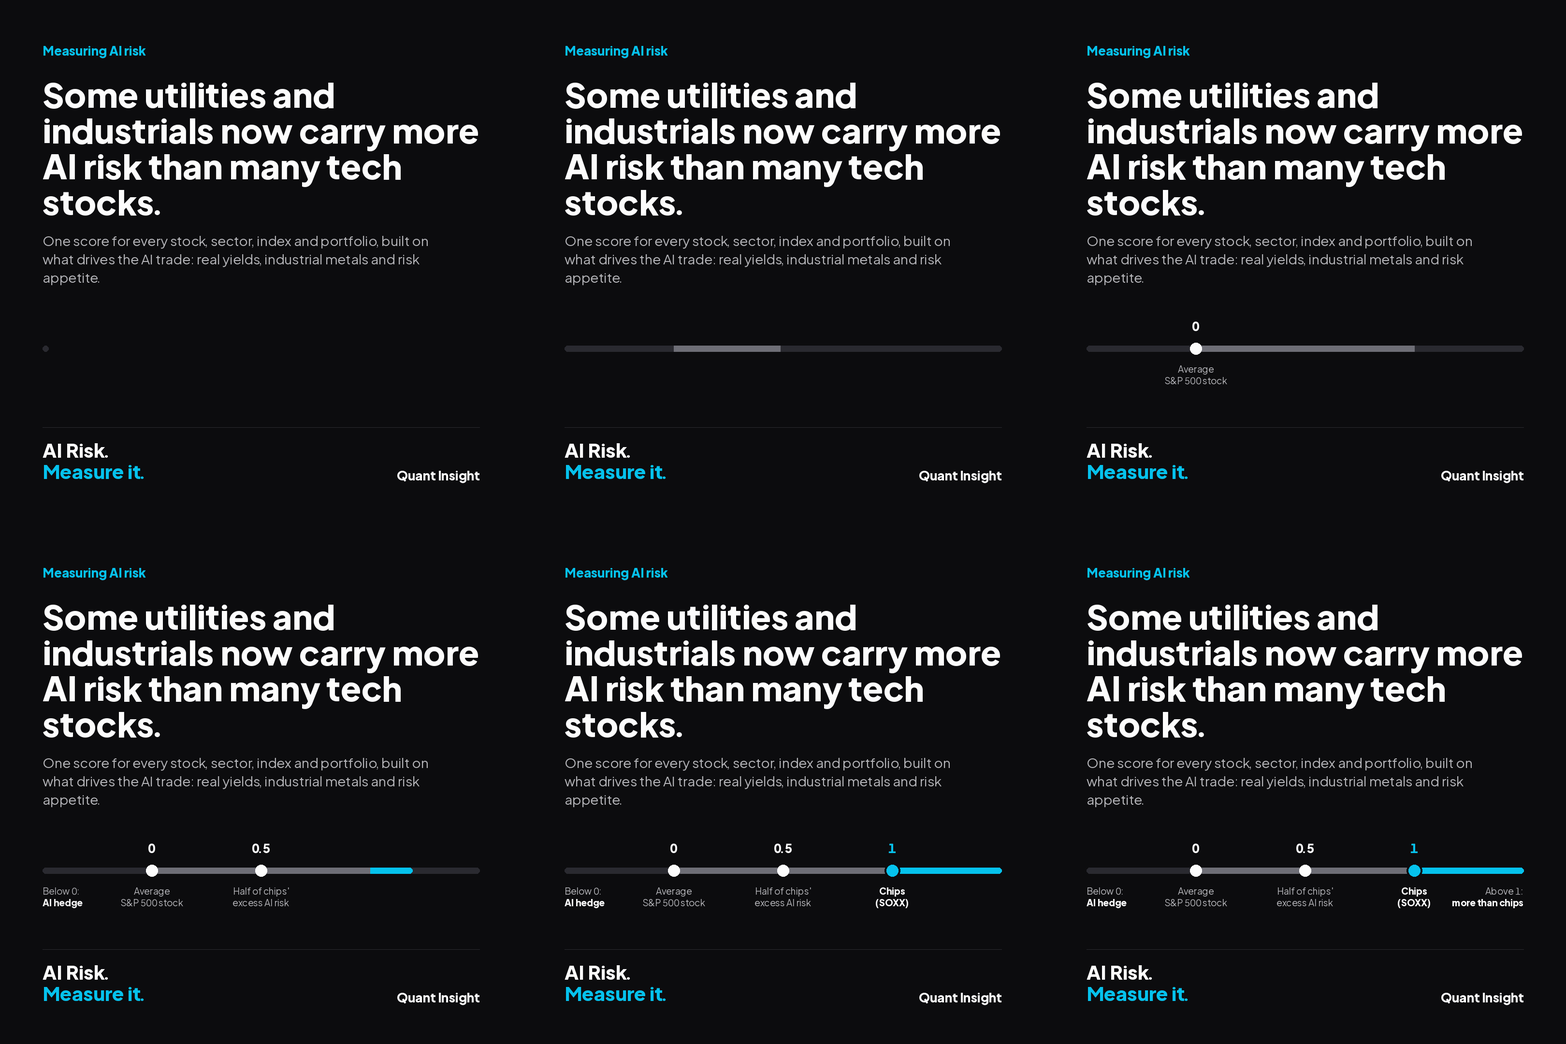
AI exposure is no longer confined to tech. Some utilities, industrials and infrastructure names now carry more AI risk than many traditional tech stocks. Sector labels won’t show you that. Statistical models can detect it, but they cannot explain it. Our new AI Risk Score is built on the economics of the AI trade: → Real yields: AI is capital intensive → Industrial metals: chips, data centres and power infrastructure → Risk appetite: like any growth trade Every stock, sector, index and portfolio gets one score. Chips (SOXX) score 1 and the average S&P 500 stock scores 0. Above 1 means more AI exposure than semiconductors; below 0 is an AI hedge. It’s accurate out-of-sample and catches shifts early. Software moved to negative AI exposure months before semiconductor beta measures changed. For institutional portfolio and risk managers, it shows: → Total AI-related P&L risk in a book → Which holdings drive it → Hedges to cut unintended exposure → Firm-wide concentration in AI themes Want to see where your book sits? We can run the score on a sample portfolio. Learn more with a 15min intro call: https://lnkd.in/e7wwSJCF #AI #RiskManagement #PortfolioConstruction #Macro #equities #sp500
- LINKEDIN · IMAGESince 26 Oct 2026
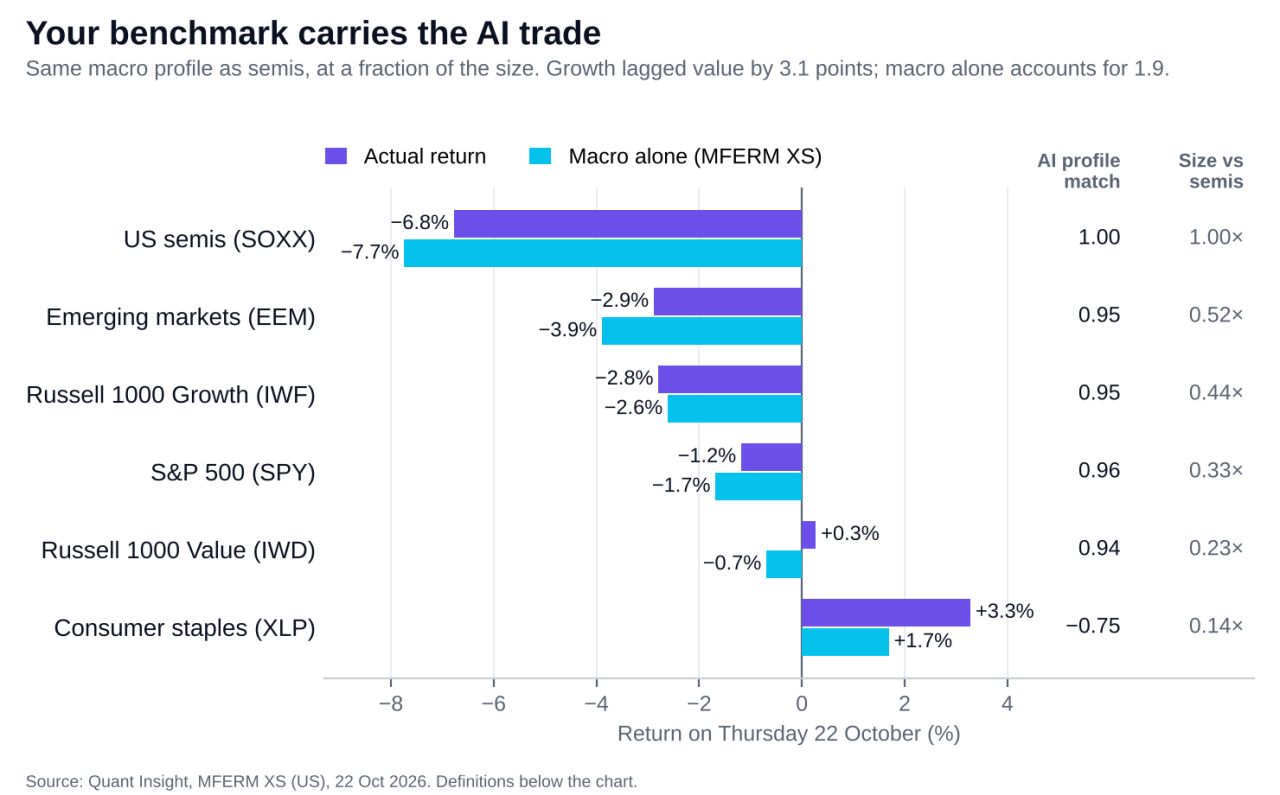
Last week was hard for growth and AI-heavy portfolios. If your fund lagged its benchmark, the question on the desk is whether it was the stock picks or the macro. A style model will tell you growth underperformed. It won’t tell you why. AI exposure resolves into a small number of macro factors, each for an intuitive reason: → Credit spreads, the build-out is increasingly debt-funded → Real yields, much of the value sits in far-future earnings → Metals, data centres and power grids need copper → Risk appetite, a crowded trade suffers first Since January 2024, those exposures — known the day before — explained 80% of daily moves in US semis. Market beta explained 62%. Thursday: macro explained 58% of US stock moves. Growth lagged value by 3.1 points; macro accounts for 1.9. And your benchmark is already an AI trade. The S&P 500’s macro exposure profile is 0.96 correlated with that of semis, at about a third of the size. You can be underweight tech and still be long the AI macro profile. MXS measures it, separating the stock calls from the macro bet.
- LINKEDIN · IMAGESince 9 Sept 2026
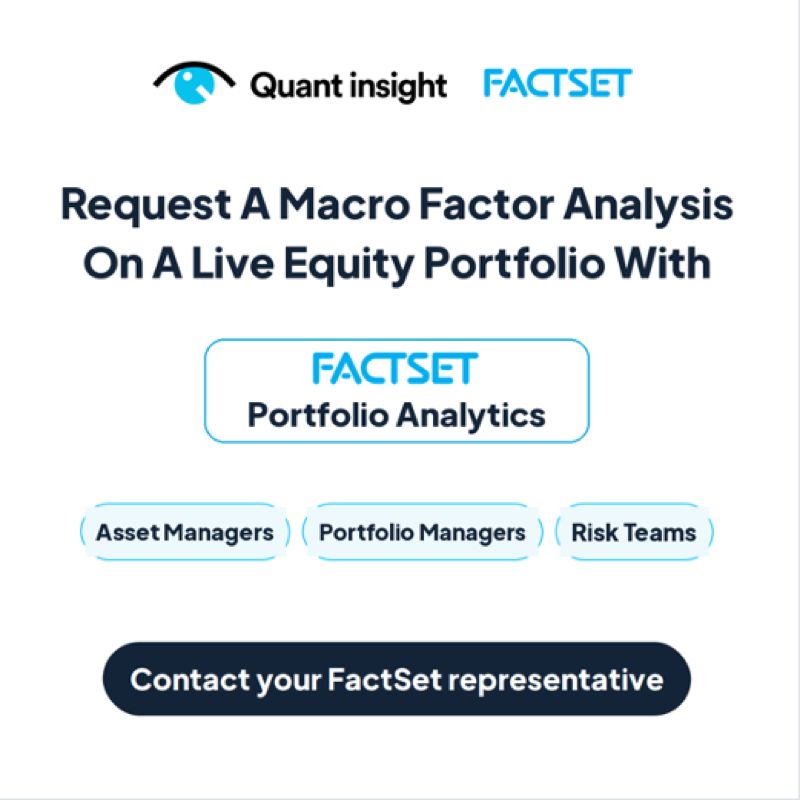
The fastest way to understand what macro risk analytics add to your process is to run them on a portfolio you already know. Quant Insight's Macro Factor Equity Risk Model (MFERM) is now available via FactSet Portfolio Analytics. Ask your FactSet representative for a sample analysis on a liveequity portfolio and see: • How much of your risk is macro-driven (Macro Share of Risk) • Which factors - growth, rates, credit, inflation, FX, commodities - drive it • Where that exposure sits, security by security Built for asset managers, portfolio managers and risk teams, alongside the style and sector metrics you already track. #PortfolioManagement #RiskAnalytics #equities #stocks #sp500 7RIDGE #assetmanagement
- LINKEDIN · IMAGESince 17 Aug 2026
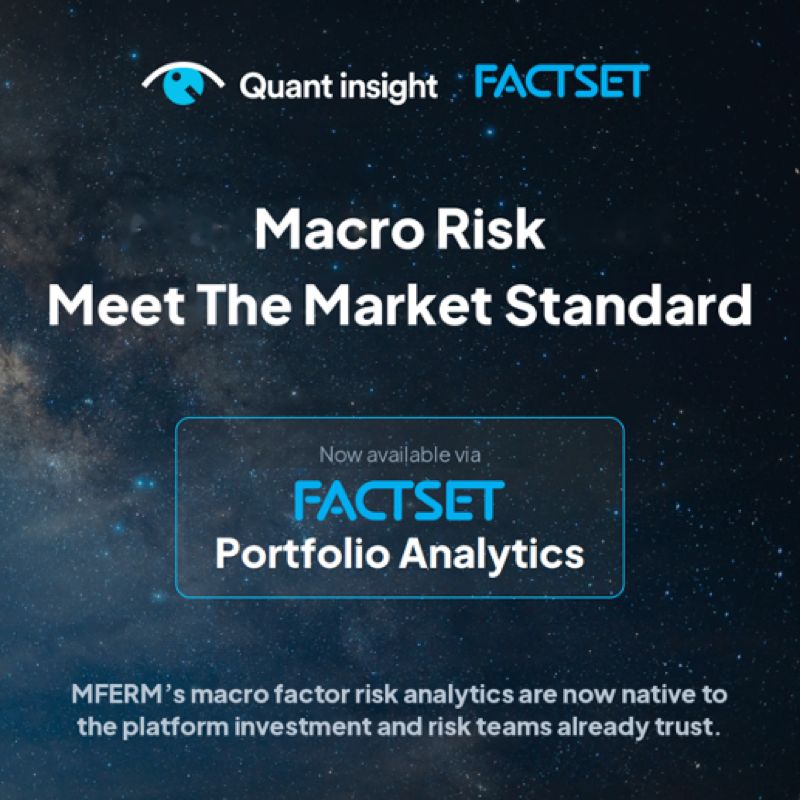
Adopting new portfolio analytics usually means a new system, a new login and a new learning curve. Not this time. Quant Insight's Macro Factor Equity Risk Model (MFERM) is now available via FactSet Portfolio Analytics - the platform investment and risk teams already trust and use every day. MFERM brings a systematic measure of macro risk to bottom-up equity portfolios: how much of your forecast risk is driven by growth, rates, credit, inflation, FX and commodities, updated daily across 16,000+ instruments. It complements established style and industry models, where they identify the tilt, MFERM measures how much of that risk is macro in origin. Ask your FactSet representative for a sample analysis. #RiskAnalytics #PortfolioManagement #riskmanagers #equities #stocks #sp500 7RIDGE #assetmanagement
- LINKEDIN · IMAGESince 11 Aug 2026
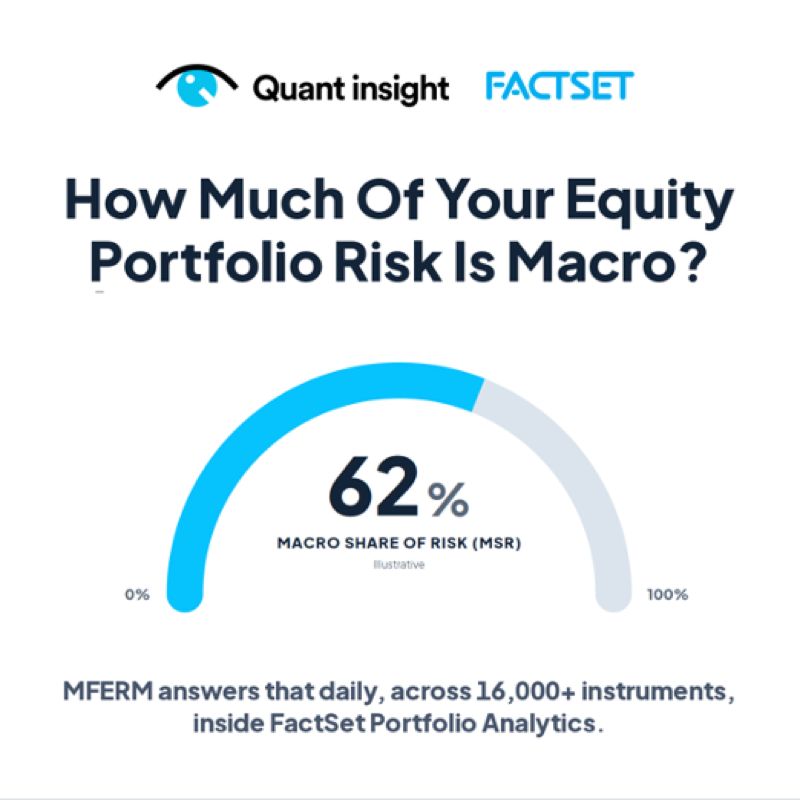
How much of your equity portfolio's risk is actually macro-driven? Most teams can't answer that with a number. Now they can. Our Macro Factor Equity Risk Model (MFERM) key output - the Macro Share of Risk (MSR) - expresses how much of a stock's, sector's or portfolio's forecast risk comes from the macro environment versus factors specific to the company itself. > Economically intuitive > Statistically robust > Updated daily across more than 16,000 instruments - single names, ETFs, sector indices and benchmarks across the US, Europe and APAC. Now available via FactSet Portfolio Analytics. See your own Macro Share of Risk: ask your FactSet representative for a sample analysis on a live portfolio. #MacroRisk #RiskManagement #PortfolioManagement #equities #stocks #sp500 7RIDGE #assetmanagement IRF
- LINKEDIN · IMAGESince 6 Aug 2026
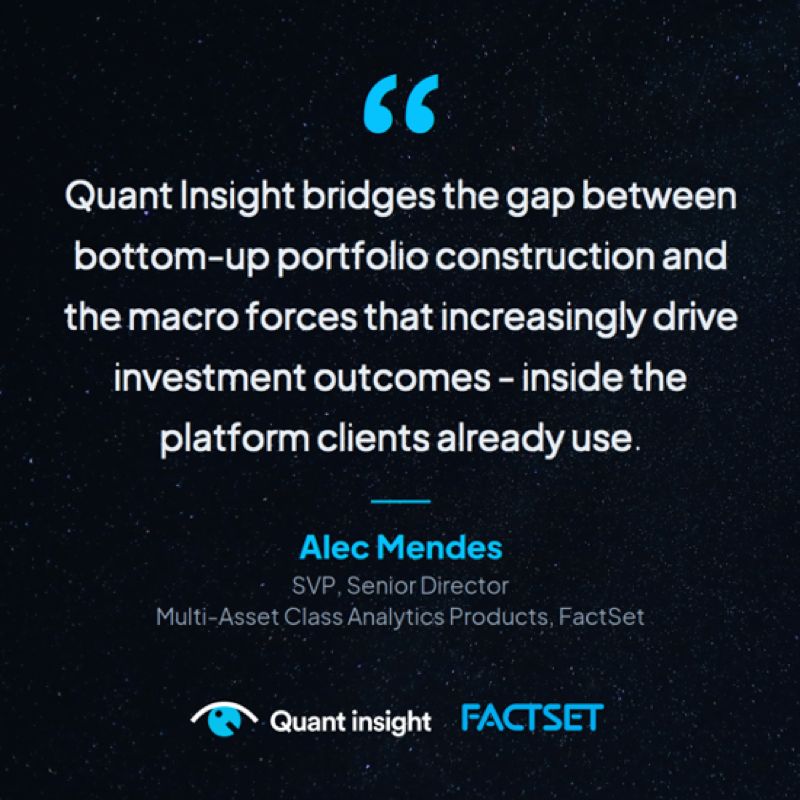
"It bridges the gap between bottom-up portfolio construction and the macro forces that increasingly drive investment outcomes — all within the trusted analytics platform our clients already use." - Alec Mendes, SVP, Multi-Asset Class Analytics Products, FactSet Quant Insight's Macro Factor Equity Risk Model (MFERM) is now integrated into FactSet Portfolio Analytics. For asset managers, portfolio managers and risk teams, macro exposure measurement - growth, rates, credit, inflation, FX and commodities - now sits alongside the analytics they rely on every day, with daily updates across 16,000+ instruments. Want to see it on your own equity portfolio? Contact your FactSet representative for a sample analysis. #RiskAnalytics #PortfolioManagement #equities #stocks #sp500 7RIDGE #assetmanagement
6 of 24 adsSign up to see every Quant Insight ad, filter by format and date, and get alerts on new ones.
See all 24 adsQuestions about Quant Insight’s ads
Is Quant Insight running LinkedIn ads?
We recorded no live LinkedIn ads for Quant Insight on 9 Nov 2026.
How many LinkedIn ads has Quant Insight run?
LinkedIn’s ad library lists 27 ads for Quant Insight. We recorded 24 LinkedIn ads for Quant Insight, first recorded on 29 Sept 2026 and last recorded on 7 Nov 2026.
Does Quant Insight run Google ads?
Yes. We recorded 6 Google ads for the domain quant-insight.com on 6 Nov 2026.
Which ad formats does Quant Insight use?
The 6 LinkedIn ads on this page include 6 image ads.
Watch the companies you care about.
Filter every ad by industry, country, format and network, and get alerts when a company you watch starts running new ads.