Not on air · 2 of 3 networks checked
Prodigal
- prodigaltech.com
- Software Development
- US
- 103 employees
Prodigal’s ads on LinkedIn, Meta and Google, recorded by adsrunning. Browse the latest here for free. Sign up free to see all 222. Watch Prodigal on any plan to get each new one in your feed.
Watchlist included in every plan
| Network | Status | Live ads | Nov 2025LinkedIn activity · 52 weeksNov 2026 | Checked | Next step |
|---|---|---|---|---|---|
| None recorded | 0 | Checked 3 Nov 2026 | See all 222 ads → | ||
| Meta | Not checked | — | |||
| None recorded | 0 | No ads found on the Google Ads Transparency Center | Checked 7 Oct 2026 | Collect them with the API → |
Prodigal has no live LinkedIn ads. We recorded no Google ads on 7 Oct 2026.
Latest ads
- LINKEDIN · IMAGERecorded 28 Sept 2026
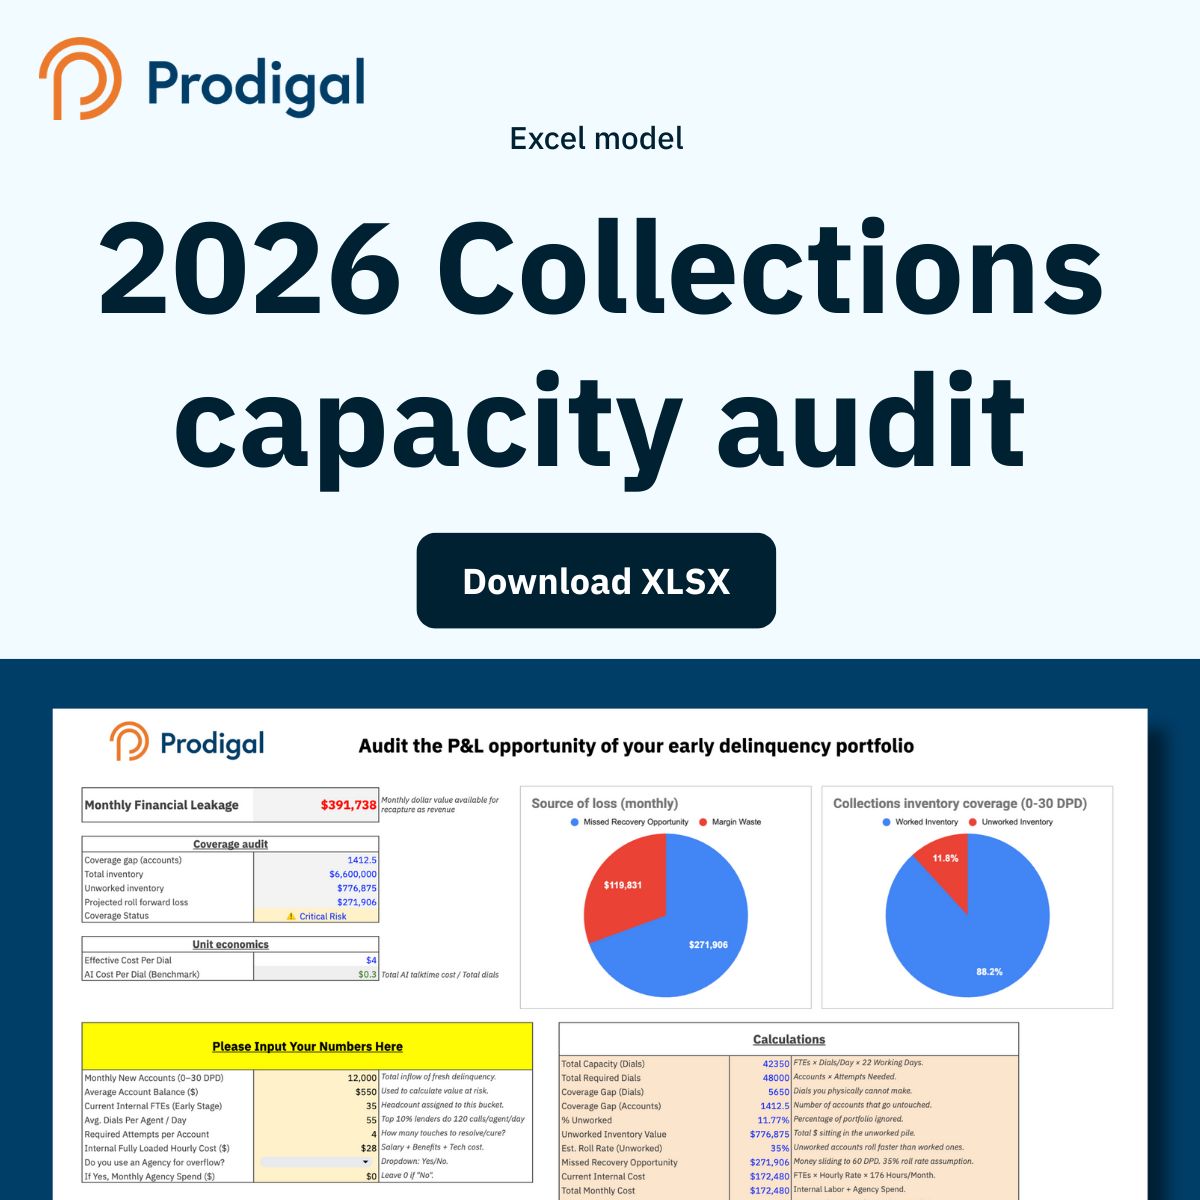
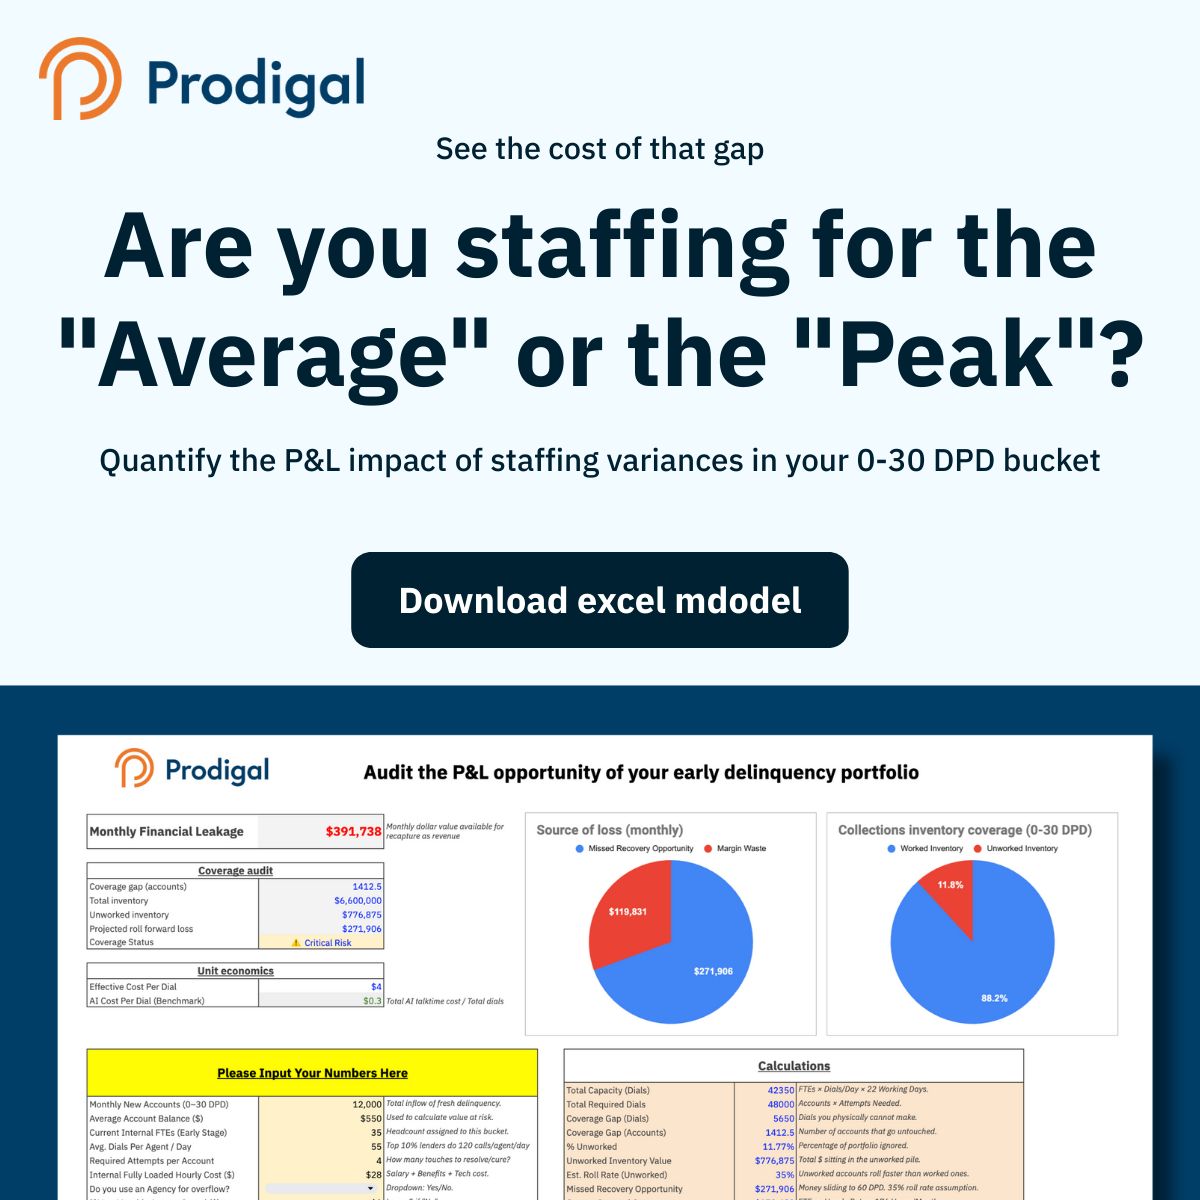
Across the industry, top lenders are quietly running internal capacity audits to prepare for 2026 delinquency volatility. These audits surface where teams are overbuilt, underbuilt, or losing efficiency in the early-stage buckets. To help standardize this, we built a simple Excel-based model that lets you see: ➡ How your staffing compares to the top 10% of lenders ➡ Whether your throughput is keeping up with your delinquency inflow ➡ The hidden cost of reactive hiring or layoffs ➡ Early signals that your 0–30 DPD bucket may be at risk
- LINKEDIN · IMAGERecorded 28 Sept 2026
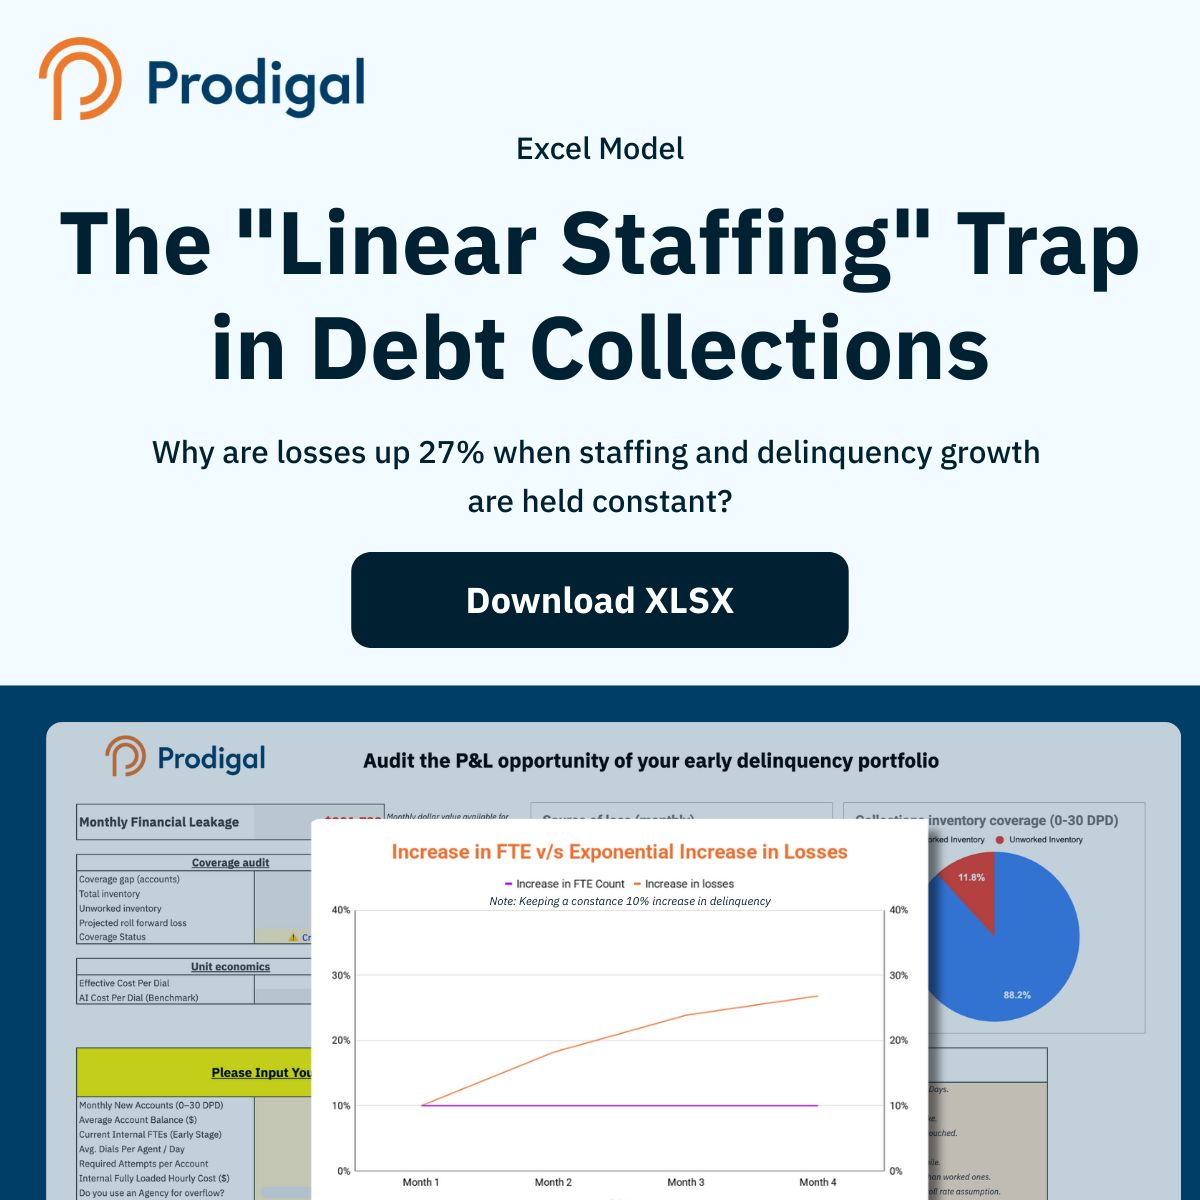
Linear staffing ≠ linear outcomes. The model shows Operations, Servicing, and Collections Leaders the gap between what you’re paying for (capacity) and what you’re actually getting (coverage + recoveries). Download the XLSX to calculate the P&L impact directly.
- LINKEDIN · IMAGERecorded 28 Sept 2026
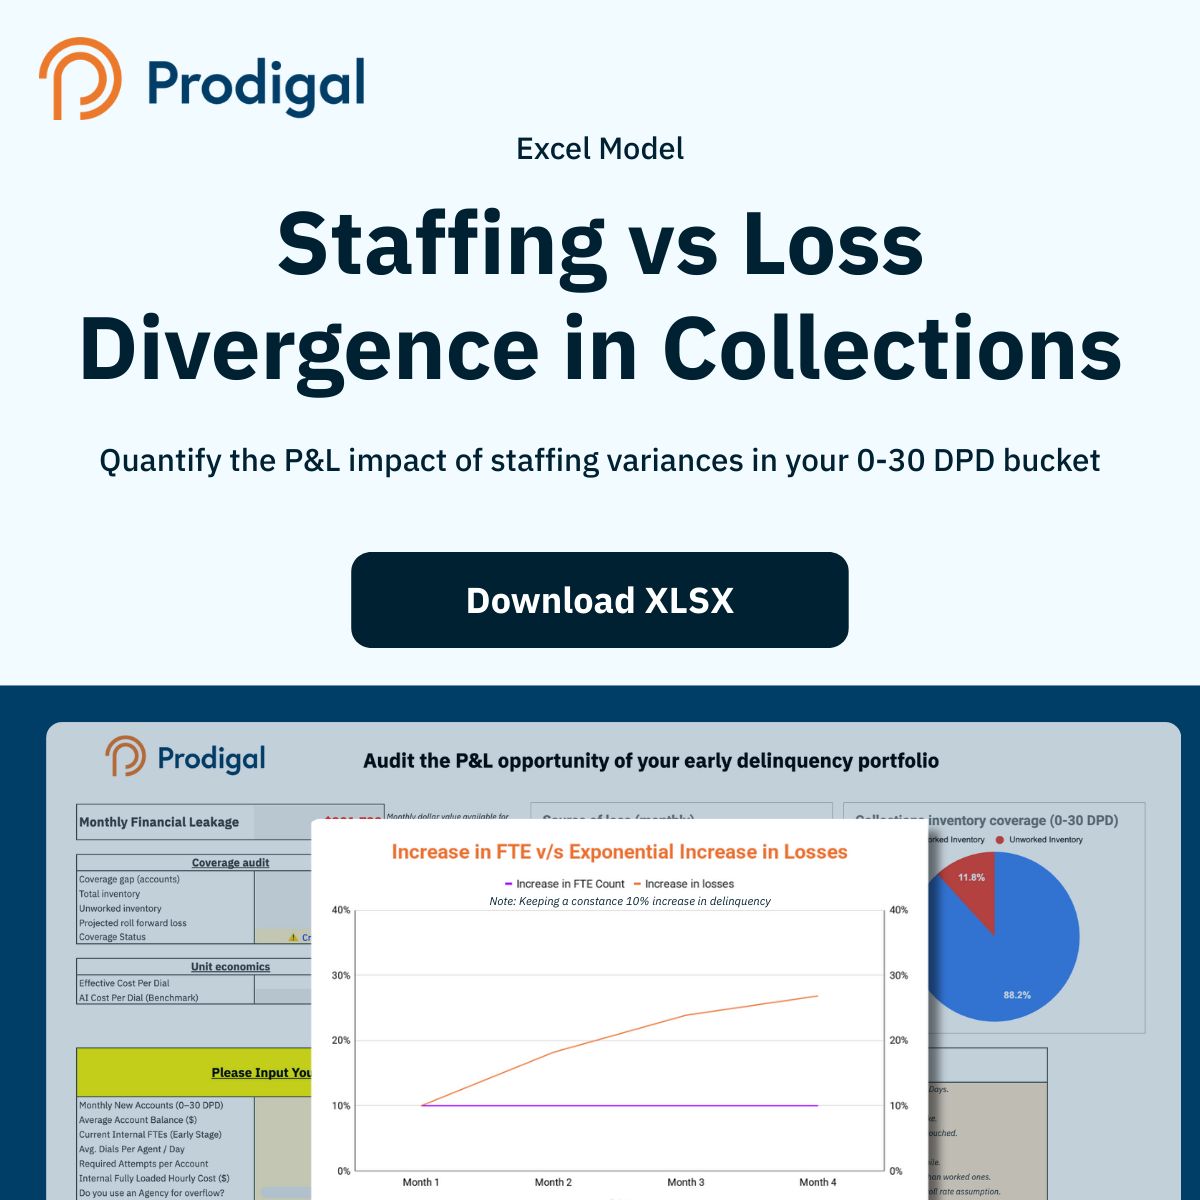
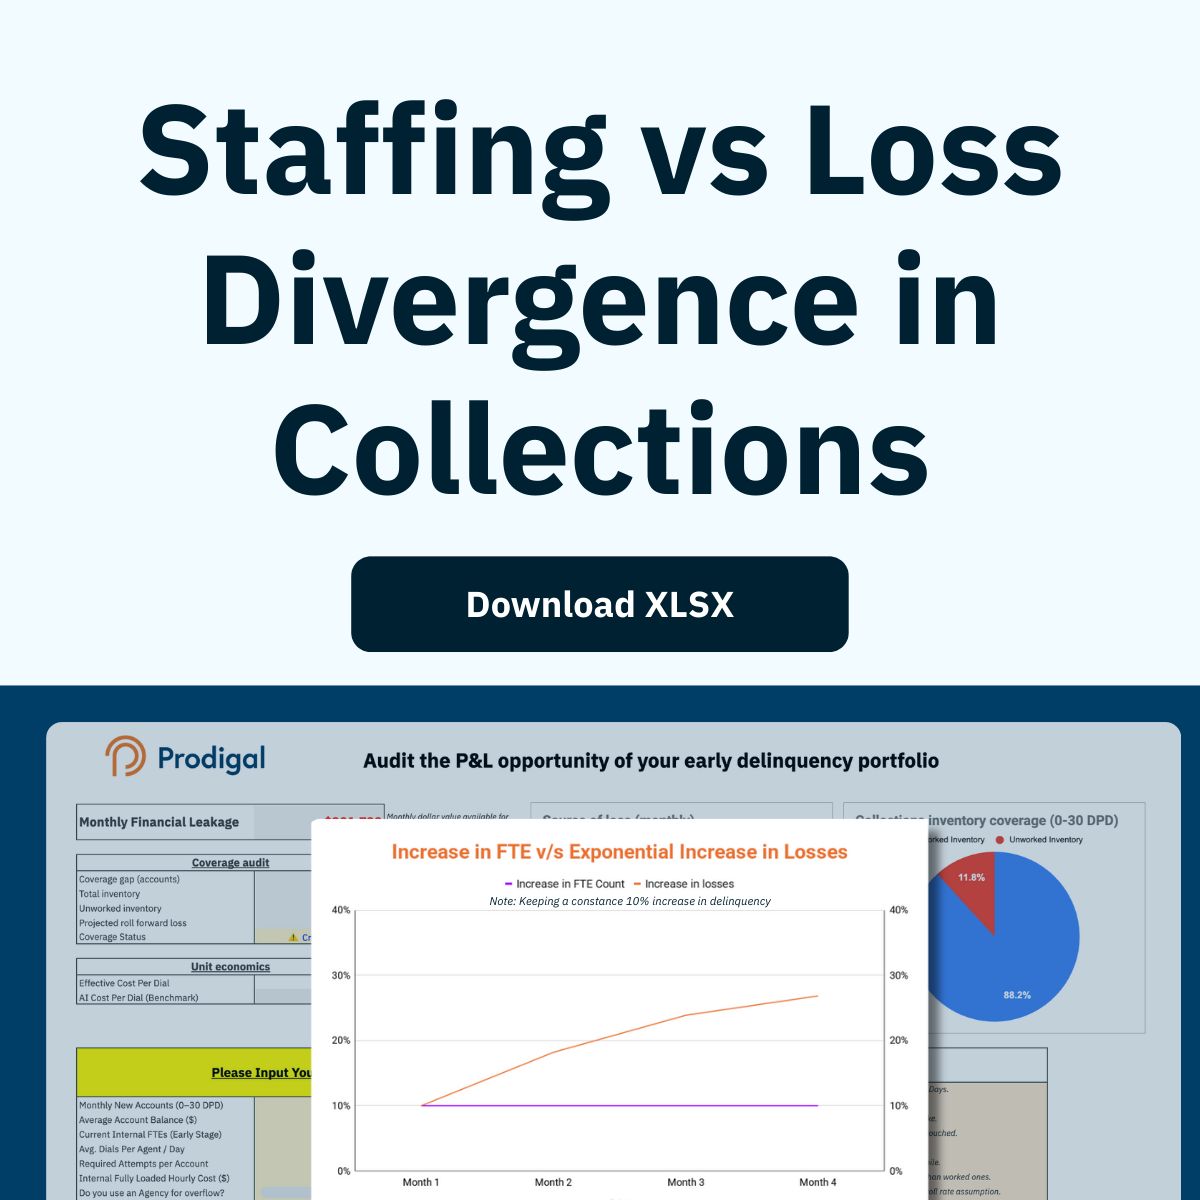
For VPs of Collections, COOs, and Risk Leaders: Even after increasing early-stage staffing by 10%, losses in comparable portfolios continued climbing 10% → 18% → 24% → 27% month over month. This widening gap highlights a structural issue we call Operational Inelasticity — linear staffing increases cannot offset non-linear delinquency swings. We created this Excel model so you can quantify this risk in your own operation: ➡ Enter your actual 0–30 DPD inflow ➡ Plug in current FTE counts + fully loaded costs ➡ Simulate staffing variances ➡ Measure the resulting loss impact ➡ See how your efficiency compares to top 10% lenders
- LINKEDIN · IMAGERecorded 28 Sept 2026
We plotted the standard "hire-to-collect" model against projected 2026 loss curves. The divergence is undeniable. Every time you hire a new agent to plug a capacity gap, you are fighting a linear battle against an exponential problem. Download the attached Excel file to: ➡ Model volatility scenarios ➡ Calculate how much loss exposure your current capacity leaves ➡ Benchmark your efficiency against top-performing lenders ➡ Build a Q1/Q2 staffing plan grounded in math — not averages. P.S: This Excel file runs entirely on your local machine. No data leaves your desktop.
- LINKEDIN · IMAGERecorded 28 Sept 2026
For VPs of Collections, Risk Officers, and COOs: Unsecured lending volatility in 2025 has created a hidden drag on margins: Operational Inelasticity. When delinquency rises, understaffing suppresses recoveries. When delinquency softens, overstaffing inflates cost-to-collect. Most teams are running their models on static averages—missing the real EBITDA impact of these monthly swings. We built a locally hosted Excel model that lets you run a proper efficiency audit, without sharing any data externally. Inside the tool, you can: ➡ Enter your actuals (FTE count, fully loaded cost, 0–30 DPD inflow). ➡ Measure exactly how much margin you’re losing due to staffing mismatch. ➡ Compare your efficiency against the top 10% of public lenders. ➡ Stress-test your 2025 capacity plan in under five minutes.
- LINKEDIN · VIDEORecorded 28 Sept 2026
The industry has spent enough time talking about what AI could do. It’s time to look at what it is doing.
6 of 222 adsSign up to see every Prodigal ad, filter by format and date, and get alerts on new ones.
See all 222 adsWatch the companies you care about.
Filter every ad by industry, country, format and network, and get alerts when a company you watch starts running new ads.