Not on air · 3 of 3 networks checked

Palexy ads
- palexy.com
- Software Development
- SG
- 56 employees
Palexy’s ads on LinkedIn, Meta and Google, recorded by adsrunning. Browse the latest here for free. Sign up free to see all 23. Watch Palexy on any plan to get each new one in your feed.
Watchlist included in every plan
What Palexy runs
- Single image · LinkedIn
- 6
| Network | Status | Live ads | Nov 2025LinkedIn activity · 52 weeksNov 2026 | Checked | Next step |
|---|---|---|---|---|---|
| None recorded | 0 | Checked 3 Nov 2026 | See all 23 ads → | ||
| Meta | None recorded | 0 | No active ads recorded on the Meta Ad Library | Checked 24 Oct 2026 | Collect them with the API → |
| None recorded | 0 | No ads found on the Google Ads Transparency Center | Checked 5 Nov 2026 | Collect them with the API → |
Palexy has no live LinkedIn ads. Its Facebook page had no active ads on 24 Oct 2026, and we recorded no Google ads on 5 Nov 2026.
Latest ads
- LINKEDIN · IMAGERecorded 28 Sept 2026
🇹🇭 +2.5. +1.6. +1.6. +1.3. +1.2. +0.9. +0.4. That's Thailand's retail stores conversion gain, every month of 2026, in points. Still positive. The one reassuring line every market report has carried all year, including ours. Ask yourself how much longer that sentence stays useful. ⁉️ At +2.5pp, "positive" meant something. The tide was under everyone. At +0.4pp, the market is barely ahead on average. An average with nothing to spare stops telling you anything about your own stores. A market-wide gain of +0.4pp is fully consistent with your flagship up 3 points and your mall store down 2. The national line will not warn you. It can stay politely positive straight through your worst store going negative. Back in July we put a number on this for Thai operators: flag any store running more than 2pp below its own H1 average, and act within a week. Look at those two numbers together. The store-level alarm threshold is 2pp. The market-level cushion is 0.4pp. ➡️➡️ The alarm is now five times bigger than the cushion. The market line cannot ring it for you. Only your store-level read can. 🇻🇳 Vietnam is the same lesson wearing the opposite sign. The national line is healing. The conversion gap narrowed to −2.3pp in July, the best of 2026, second month of improvement in a row. And Central Region is carrying the country's traffic (+28% in July, no other segment close) while converting worse than anywhere else (−3.3pp). The national average is improving on top of the one region every expansion plan runs through getting harder to convert. A healing market line. A leaking region. Both true at once. The market number tells you the weather. It doesn't tell you whether your roof leaks. Month by month, by region and format, both countries: it's all in the H1 brief, from 2,000+ stores in Vietnam and nearly 1,000 in Thailand. Drop a comment or DM me and I'll send it over. #SoutheastAsia #Retail #Insights #Strategy
- LINKEDIN · IMAGERecorded 28 Sept 2026
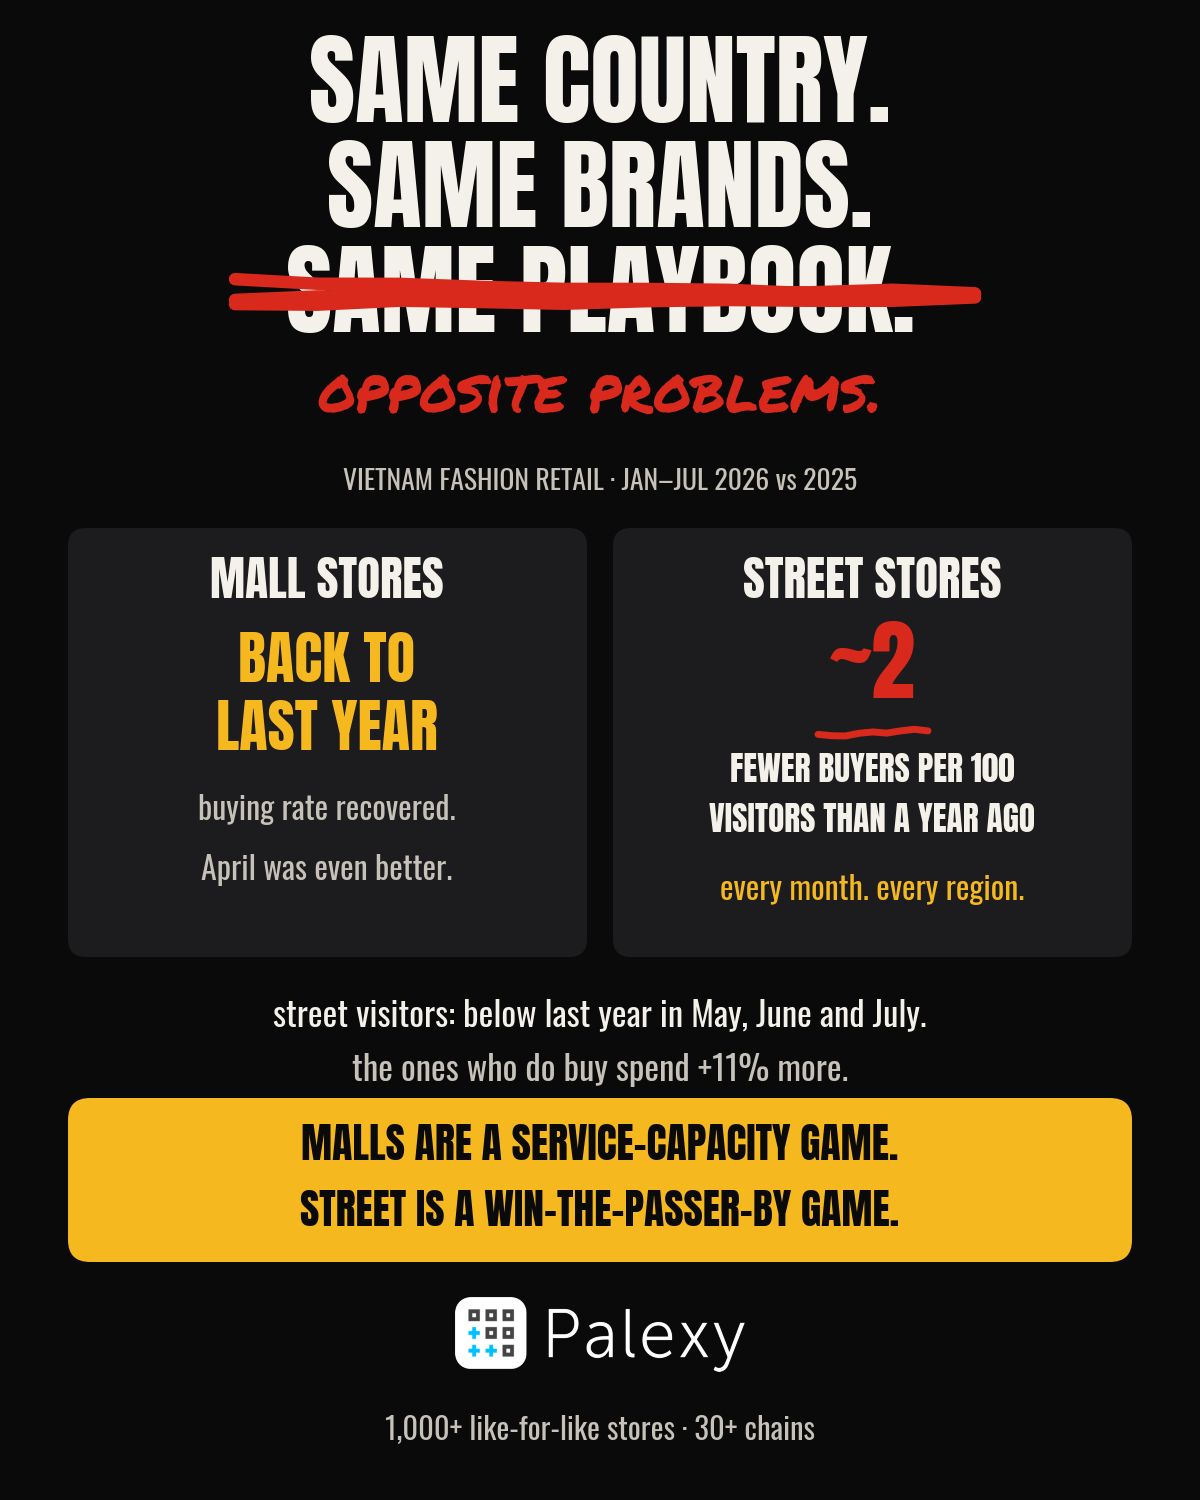
Vietnam fashion retail is running TWO completely different businesses right now. They just happen to share a P&L. 😅 ➡️ Mall stores: footfall still climbing. Buying rate back to last year's level. April was actually better. The bleeding stopped. ➡️ Street stores: fewer visitors than last year. In May, in June, in July. And selling to 1.3 to 2.7 fewer people per 100 visitors than a year ago. Every month. In every region. Same country. Often the same brands. The one bright spot on the street side: the visitors who do buy spend 11% more. The buyers are fine. There are just fewer people getting sold to. ➡️ Malls are a service-capacity game. Street is a win-the-passer-by game. ❌ Don't copy the mall playbook onto street stores. ✔️ Street levers: a greeting at the door, staff coverage at peak hours, sizes in stock on bestsellers. Traffic is partly out of your hands. Selling is not. The full H1 breakdown, mall vs street, region by region, with benchmarks so you can see where your stores sit, is in our operator report. Drop a comment or DM me and I'll send it over. #VietnamRetail #Fashion #Lifestyle #MarketInsights
- LINKEDIN · IMAGERecorded 28 Sept 2026
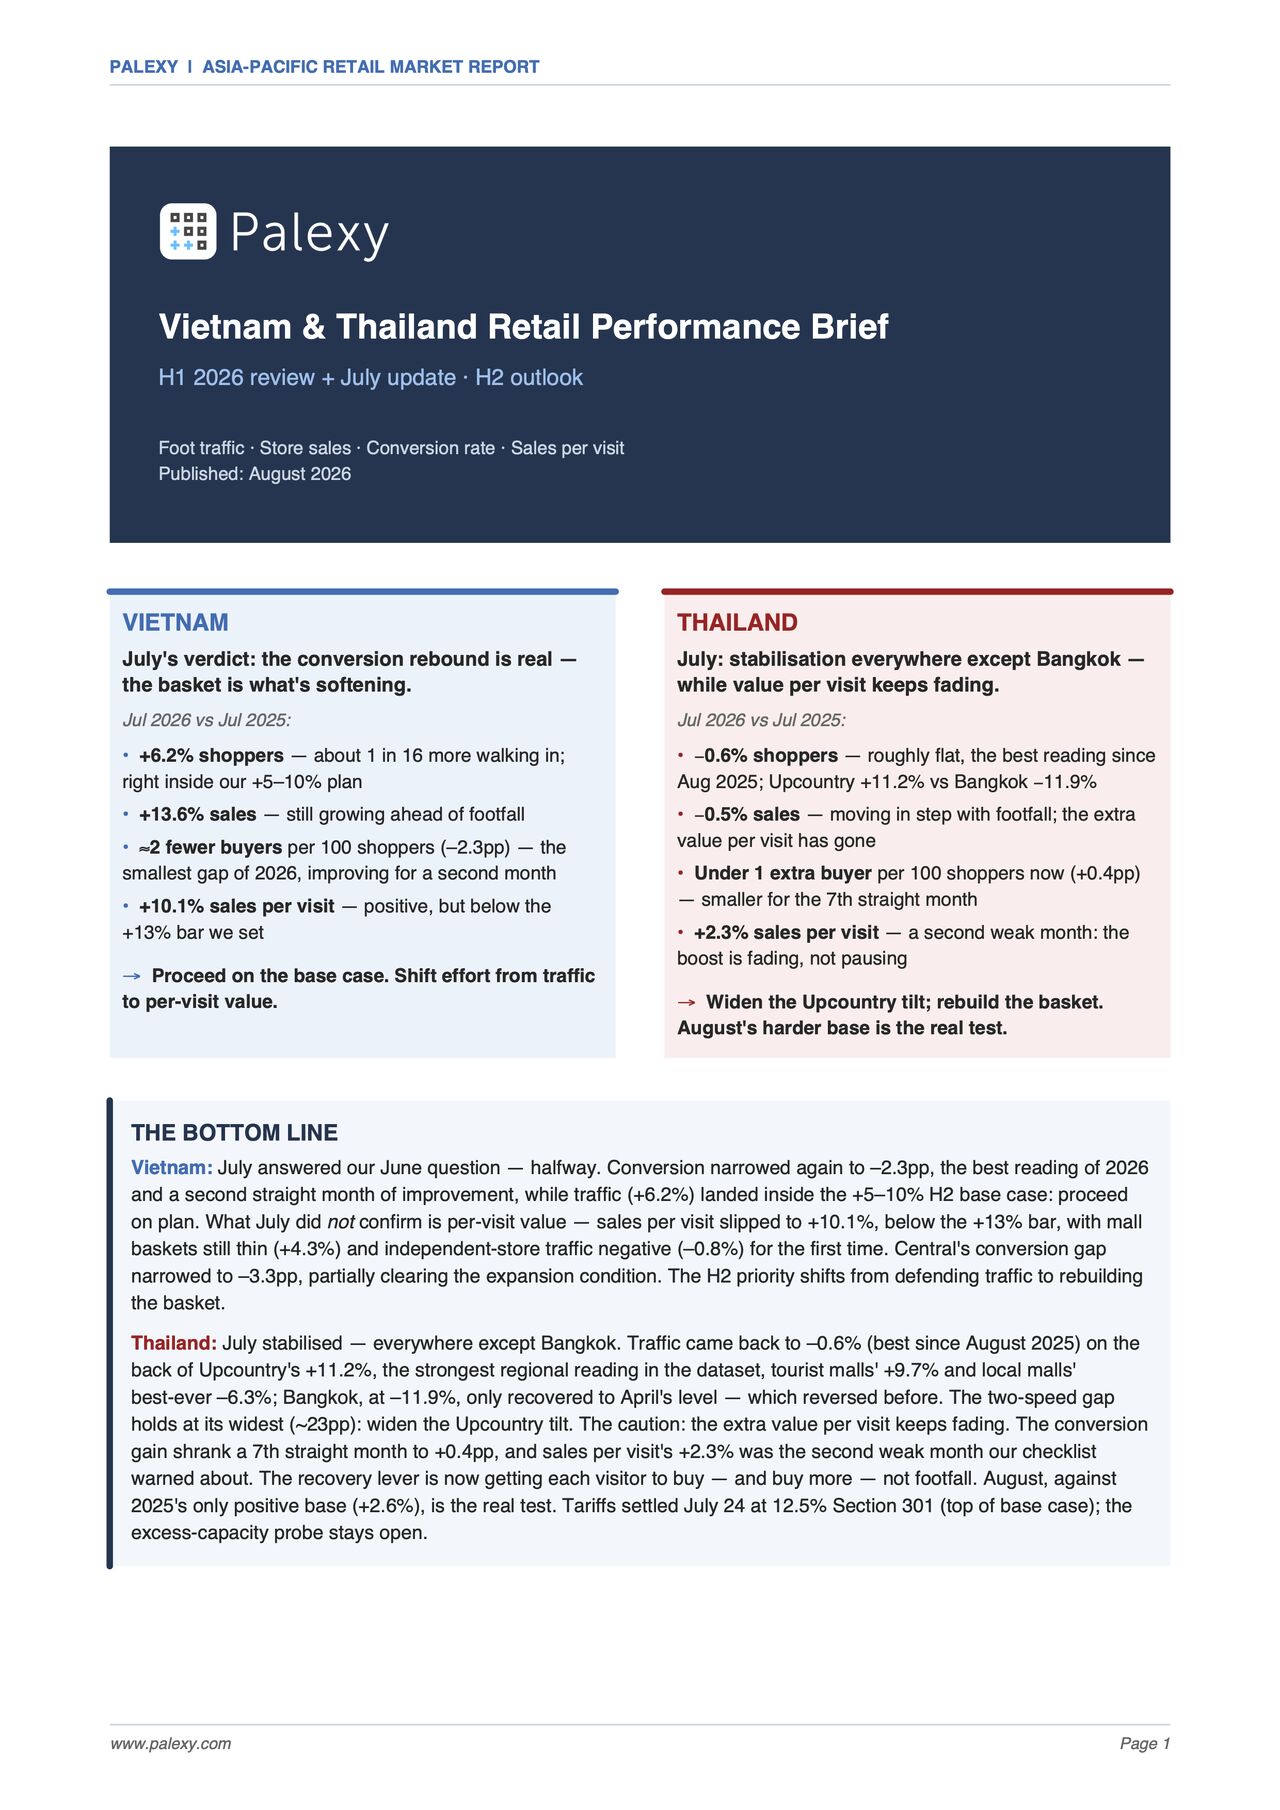
Thailand 🇹🇭 just hit its best store traffic number of 2026. Ignore it. −0.6% in July, after June's −10.7%. On a chart that looks like the recovery finally arriving. July 2025 was already −7.0%. ==> We are measuring a recovery against a floor. The base did that work, not the market. And the number I keep telling Thai operators to watch weekly did exactly what it has done all year: the conversion gain shrank again. +0.4pp. Seven straight months of getting smaller. In January it was +2.5pp. 🤔 Bangkok narrowed from −21.8% to −11.9%. Ten points in one month. I have spent this year telling people to treat a single good Bangkok month as tentative until it holds a full quarter. ==> Easy rule to write when the number is bad. Vietnam 🇻🇳 is the one I got checked on. In May I told Vietnamese retailers to plan H2 around +5–10% traffic growth. They were running +24% at the time. It was not a popular number to put in writing. July came in at +6.2%. The number landing is the boring part. Here is what I didn't expect: Conversion recovered. −2.3pp, the best reading of 2026, second month of improvement in a row. The basket didn't. Sales per visit went from +16.0% in June to +10.1% in July. ==> If I had only looked at conversion, I would have called this a recovery. One number says the shopper came back. The other says they spent less when they did. Two metrics, same month, same stores, opposite stories. ⁉️ Two things I'd carry into H2 if I ran stores in either market: 🇹🇭 Thailand: don't let July's headline traffic number move your H2 baseline. Re-baseline on June and watch conversion by store, weekly. 🇻🇳 Vietnam: the conversion recovery is real enough to plan on. The basket recovery is not. Two different problems, two different answers. I've written up H1 for both countries (month by month, by region and format, etc.) with what we think H2 looks like and what would change our mind. Drop a comment or DM me and I'll send it over. #Vietnam #Thailand #RetailAnalytics #H12026
- LINKEDIN · IMAGERecorded 28 Sept 2026
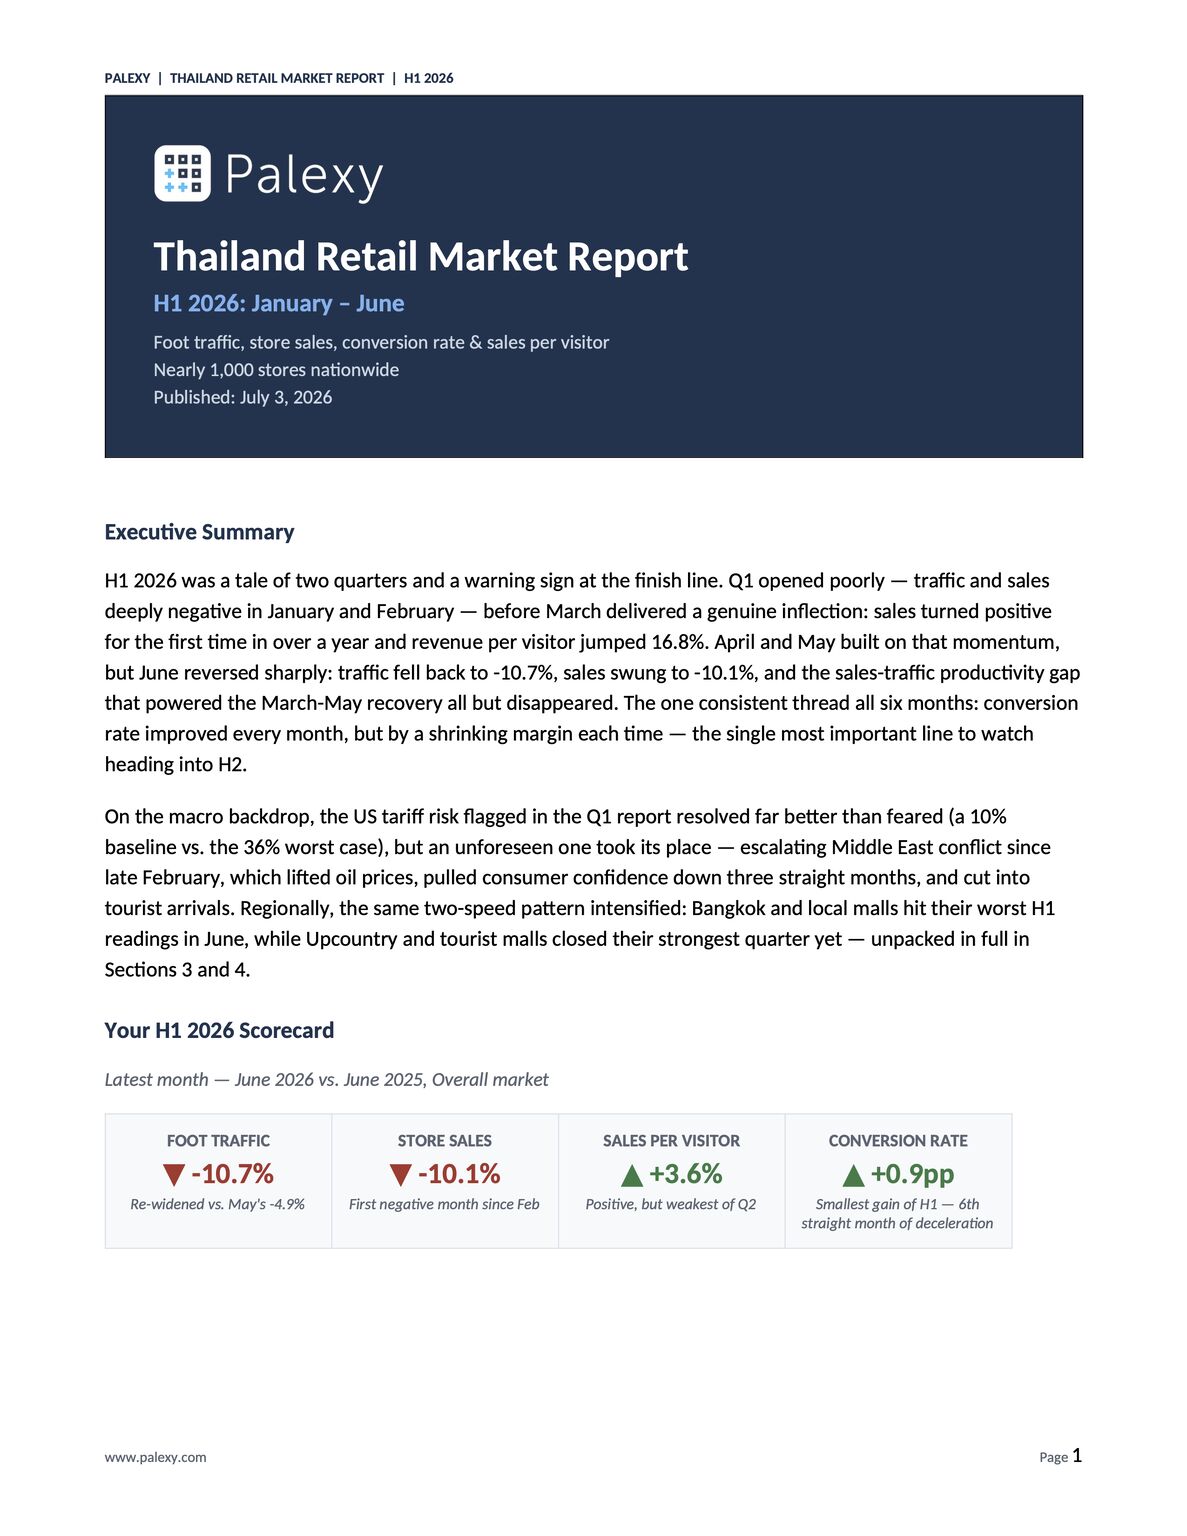
A retail director in Bangkok told me last month that her conversion rate was up year on year. Six months in a row. She wanted to know why the floor still felt like it was losing. So I went and looked at ours. Nearly 1,000 specialty stores across Thailand, January to June. Here is what six good months look like (aggregated store conversion YoY): Jan +2.5pp Feb +1.6pp Mar +1.6pp Apr +1.3pp May +1.2pp Jun +0.9pp Every month green. Every month smaller. ==> That is not six wins. That is a countdown. And it is not the only line doing it. In March, sales in our Thailand panel outran traffic by 13.7 percentage points - the strongest signal we had that visits were fewer but far more valuable. April: +8.4pp. May: +9.8pp. Then, June: +0.6pp. Traffic went back to -10.7%. Sales went to -10.1%. Revenue per visit fell from +13.4% in May to +3.6%. ==> The whole "fewer, better visits" story closed in a single month. Here is the part I got wrong. We published our Q1 report in April and I put that +13.7pp at the centre of it. I read an inflection. It was a bounce, and I called it a turn. ❌ May was not the new baseline. ✔️ June is. And underneath the national number, Thailand is not one market any more. ⁉️ Bangkok ran -21.8% in June, its worst month in the whole 18-month regional dataset. ✅ Upcountry ran +1.2% now further above the national line than Bangkok sits below it. Same country. Same month. Same brands, in a lot of cases. ➡️ If you are building an H2 plan this week, two things: 1️⃣ Build it off June, not off May. The comfortable base that flattered Q2 is gone. 2️⃣ And go and look at the direction of your green numbers, not just their sign. A metric that is still positive and shrinking every month is not telling you that you are winning. It is telling you how much time you have left. Traffic tells you someone showed up. It doesn't tell you why, or what happened after they walked through the door. A number going up can still be running out. If you want the full H1 breakdown by region, by format, month by month => DM me and I'll send it over. #Thailand #RetailAnalytics #H12026 #MarketInsights #MarketReport
- LINKEDIN · IMAGERecorded 28 Sept 2026
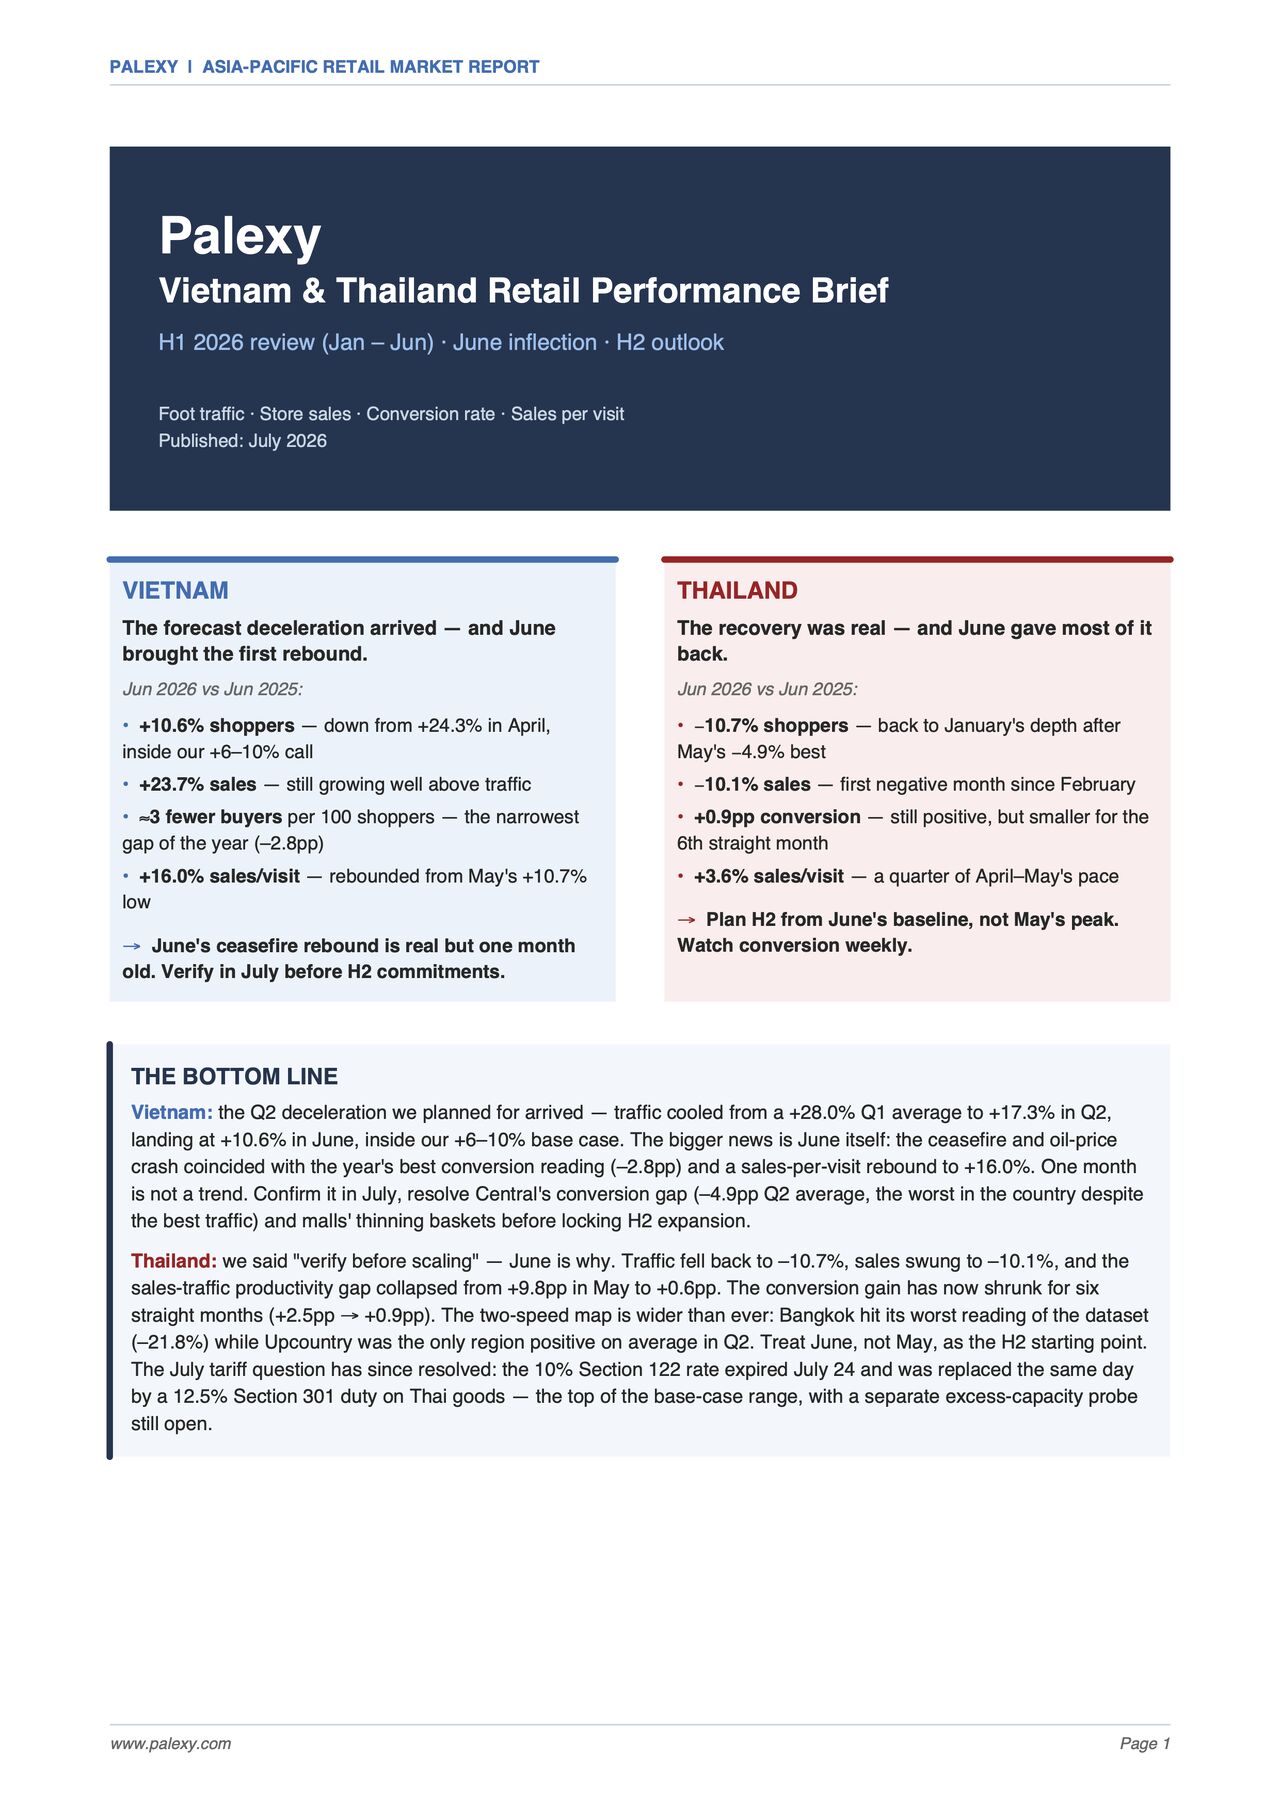
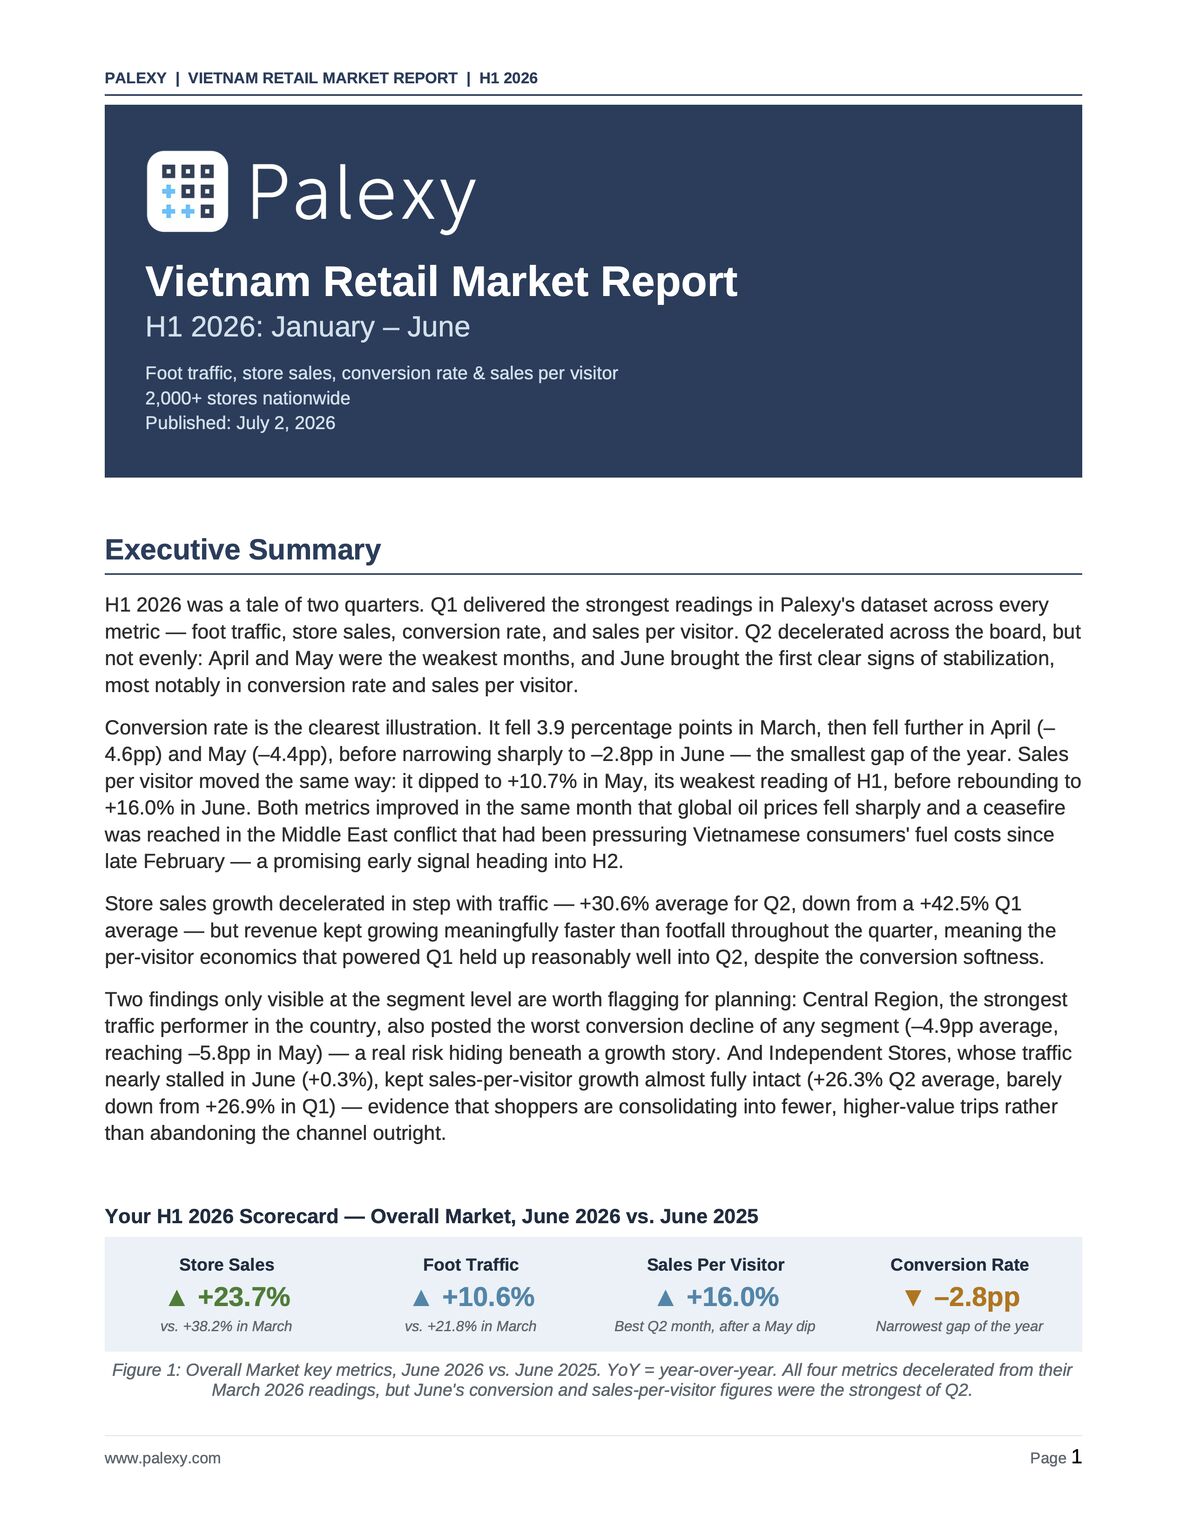
We watched a war end in the middle of our own retail data. 🤔 Not on the news first. In conversion rates, across 2,000+ stores in Vietnam. Here's what happened. Back in February, a war broke out in the Middle East and oil prices spiked. Fuel got more expensive, inflation climbed to its highest level in Vietnam since early 2020, and people got more careful with their money. You could see it clearly in our numbers. Conversion rate (the % of visitors who actually buy something) kept getting worse. -3.9pp in March. -4.6pp in April. -4.4pp in May. Then in June, out of nowhere, it snapped back to -2.8pp. Best reading of the entire quarter. Same month Brent crude dropped almost 20% and a ceasefire got signed. We weren't trying to track a war through footfall and basket sizes. It just showed up there anyway. That wasn't the only thing that stopped me going through this report. Central Vietnam had the strongest foot traffic growth in the entire country this year. Tourism, new stores, all the right signals. If you only checked footfall, you'd think it was untouchable. But its conversion rate fell further than any other region we track. -5.8pp in May. The busiest region in Vietnam is quietly becoming one of the least efficient, and nobody watching traffic alone would ever catch it. And the independent street-front stores everyone assumes e-commerce is slowly killing. Their traffic basically flatlined by June, +0.3%. Looked like the beginning of the end. Except revenue per visit was still up over 25% for the quarter => People aren't disappearing. They're just going less often and buying more when they do. Traffic tells you someone showed up. It doesn't tell you why, or what happened after they walked through the door. That gap is where I've seen more bad retail decisions get made than almost anywhere else (honestly, it's the whole reason we started Palexy 🤩) Six months, four metrics, and a war that ended in the middle of it. Wildest H1 we've reported on yet. If you want the full breakdown (by region, by format, month by month), DM me and I'll send it over. #Vietnam #RetailMarket #Report #H12026
- LINKEDIN · IMAGERecorded 28 Sept 2026
We've been telling store managers to be more data-driven for years. Most of them still don't care. Turns out, we were solving the WRONG problem. 🤣 🤣 🤣 Not because data isn't useful. But because they're already drowning in daily tasks, opening the store, managing staff, handling customers. Opening another app to look at dashboards? Translating charts into actions? That's just not how they think. Store ops teams are doers, not analysts. And for a long time, we at Palexy didn't fully respect that. We built great analytics. We trained store managers and area managers on how to read the data and apply it. And we assumed they'd take it from there. They didn't. Not because they weren't smart. Because even after training, most SMs and AMs were still struggling with the same question: ok, but what exactly do I do with this? So we built a customer success team to help fill that gap. Real people, sitting with store teams, turning data into specific actions. It worked well, but we have 5,000+ stores. Our CS team could never scale to cover every store, every day. 🤣 ➡️ ➡️ ➡️ That's the gap we're now closing with AI agents! Every SM and AM now has a virtual business analyst. It reads the data for them. It tells them, in plain English or their local language, exactly what to do. If there's an understaffing problem at peak hours, it revises the schedule. If a specific staff member is struggling on customer service in a particular shift, it puts together a tailored training session. It tracks what it recommends, what the team does, and what happens next. If it works, it doubles down. If it doesn't, it adjusts. The store team's job is no longer to figure out what the data means => It's just to review and approve. ➡️ ➡️ ➡️ That's a fundamentally different relationship between frontline teams and data. And I think it's the one that actually works. 🎯 #RetailAI #AgenticAI #RetailOperations #FrontlineWorkers #RetailTech

6 of 23 adsSign up to see every Palexy ad, filter by format and date, and get alerts on new ones.
See all 23 adsQuestions about Palexy’s ads
Is Palexy running LinkedIn ads?
We recorded no live LinkedIn ads for Palexy on 8 Nov 2026.
How many LinkedIn ads has Palexy run?
LinkedIn’s ad library lists 23 ads for Palexy. We recorded 23 LinkedIn ads for Palexy, first recorded on 28 Sept 2026 and last recorded on 28 Sept 2026.
Does Palexy advertise on Facebook and Instagram?
Palexy’s Facebook page had no active ads in Meta’s Ad Library, last recorded on 24 Oct 2026.
Does Palexy run Google ads?
We recorded no Google ads for the domain palexy.com on 5 Nov 2026.
Which ad formats does Palexy use?
The 6 LinkedIn ads on this page include 6 image ads.
Watch the companies you care about.
Filter every ad by industry, country, format and network, and get alerts when a company you watch starts running new ads.