Not on air · 3 of 3 networks checked

Global Property Guide ads
- globalpropertyguide.com
- Real Estate
- EE
- 17 employees
Global Property Guide’s ads on LinkedIn, Meta and Google, recorded by adsrunning. Browse the latest here for free. Sign up free to see all 240. Watch Global Property Guide on any plan to get each new one in your feed.
Watchlist included in every plan
What Global Property Guide runs
- Single image · LinkedIn
- 6
- Google ads on 30 Oct 2026
- 18
| Network | Status | Live ads | Nov 2025LinkedIn activity · 52 weeksNov 2026 | Checked | Next step |
|---|---|---|---|---|---|
| None recorded | 0 | Checked 7 Nov 2026 | See all 240 ads → | ||
| Meta | None recorded | 0 | No active ads recorded on the Meta Ad Library | Checked 22 Oct 2026 | Collect them with the API → |
| Recently | 18 | Ads on the Google Ads Transparency Center | Checked 30 Oct 2026 | Collect them with the API → |
Global Property Guide has no live LinkedIn ads. Its Facebook page had no active ads on 22 Oct 2026, and we recorded 18 Google ads on 30 Oct 2026.
Latest ads
- LINKEDIN · IMAGESince 16 Oct 2026
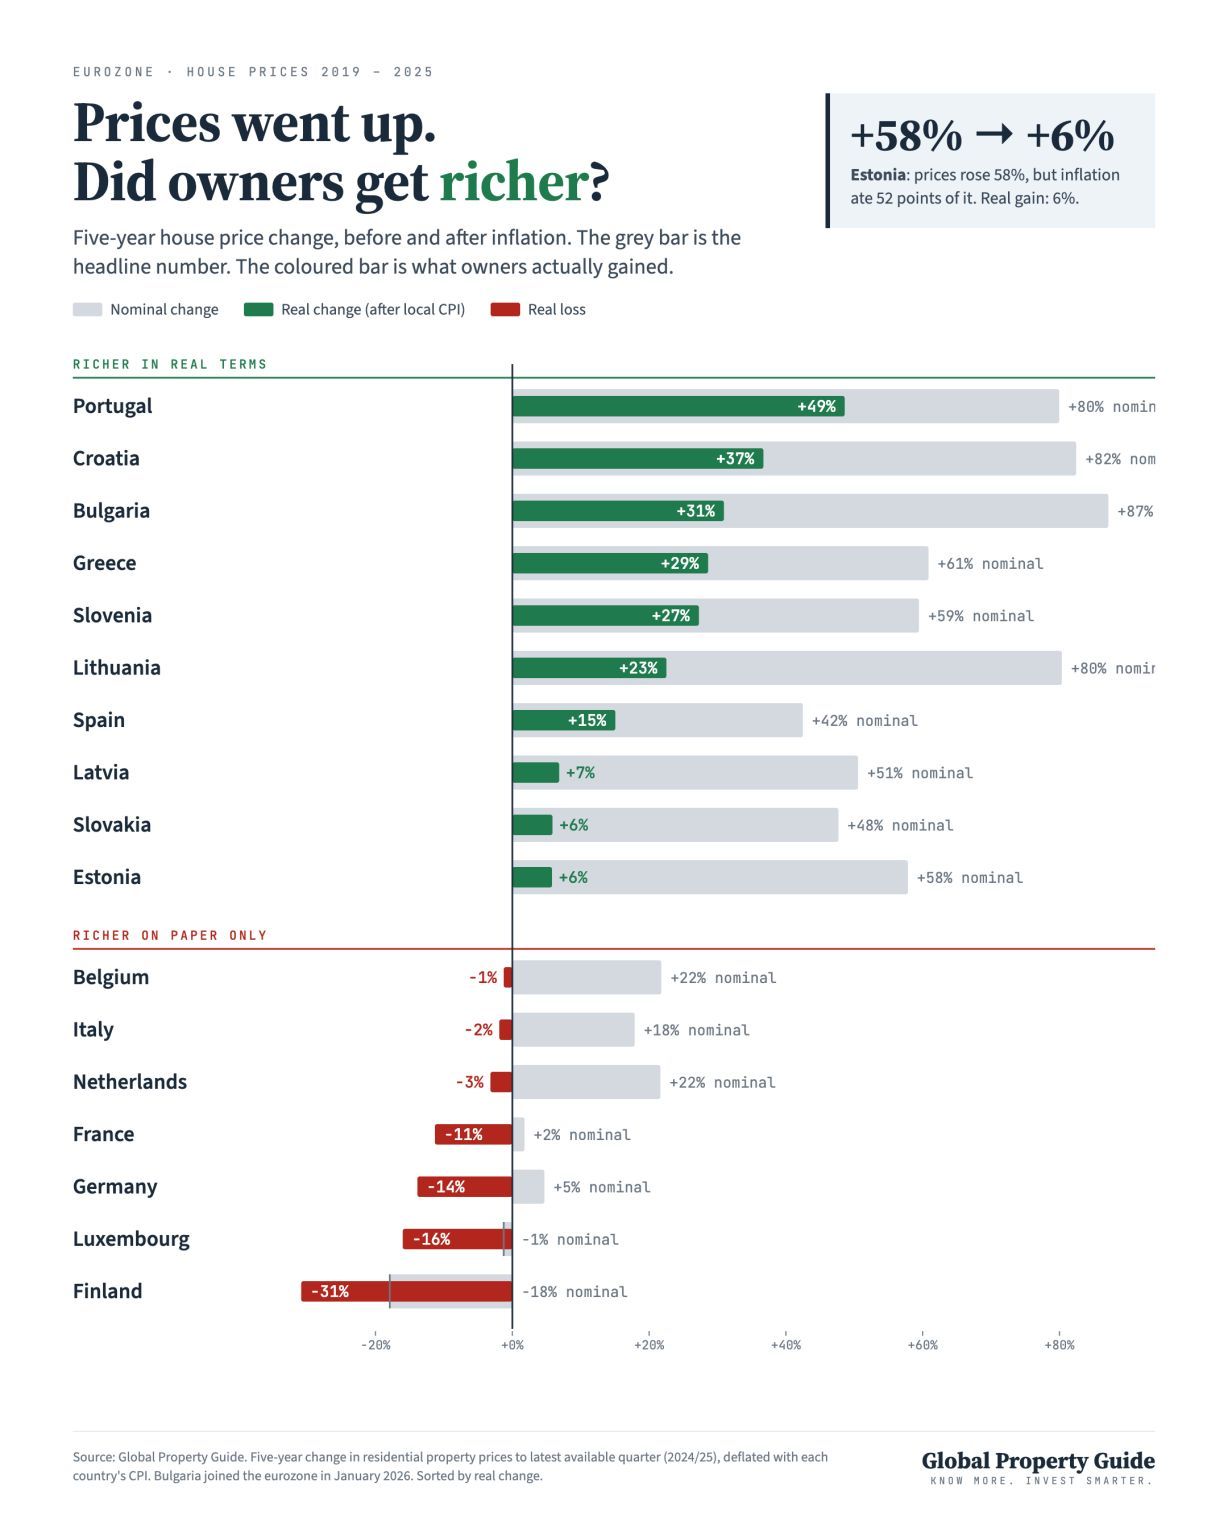
German house prices rose 4.7% in five years. After inflation, they fell 13.9%. As a homeowner, your property could be worth more euros while representing less purchasing power. Here’s how five-year house price growth compares across 🇪🇺 Eurozone markets: Nominal growth → inflation-adjusted growth Lithuania: +80.4% → +22.5% Estonia: +57.8% → +5.8% Latvia: +50.5% → +6.9% Slovakia: +47.7% → +5.9% Netherlands: +21.7% → −3.2% Belgium: +21.8% → −1.3% Germany: +4.7% → −13.9% France: +1.8% → −11.3% Meanwhile, other markets delivered substantial house price gains even after inflation: Portugal: +48.6% Croatia: +36.7% Bulgaria: +30.9% Greece: +28.6% These figures measure price changes. Rental income, financing, taxes and ownership costs determine the total investment return. But they raise a difficult question for investors in Germany, France and Belgium: If rental yields are compressed, taxes absorb a significant share of income, and property appreciation fails to outpace inflation, what keeps you from selling and reinvesting elsewhere? Local knowledge, access to financing and familiar legal systems are valid reasons to invest close to home. Buying abroad brings additional risks and costs. How long would weak returns need to persist before more German, French and Belgian property investors look beyond their own borders? If you’re investing in Germany, France or Belgium today, what gives you confidence that the next five years will be better?
- LINKEDIN · IMAGESince 8 Oct 2026
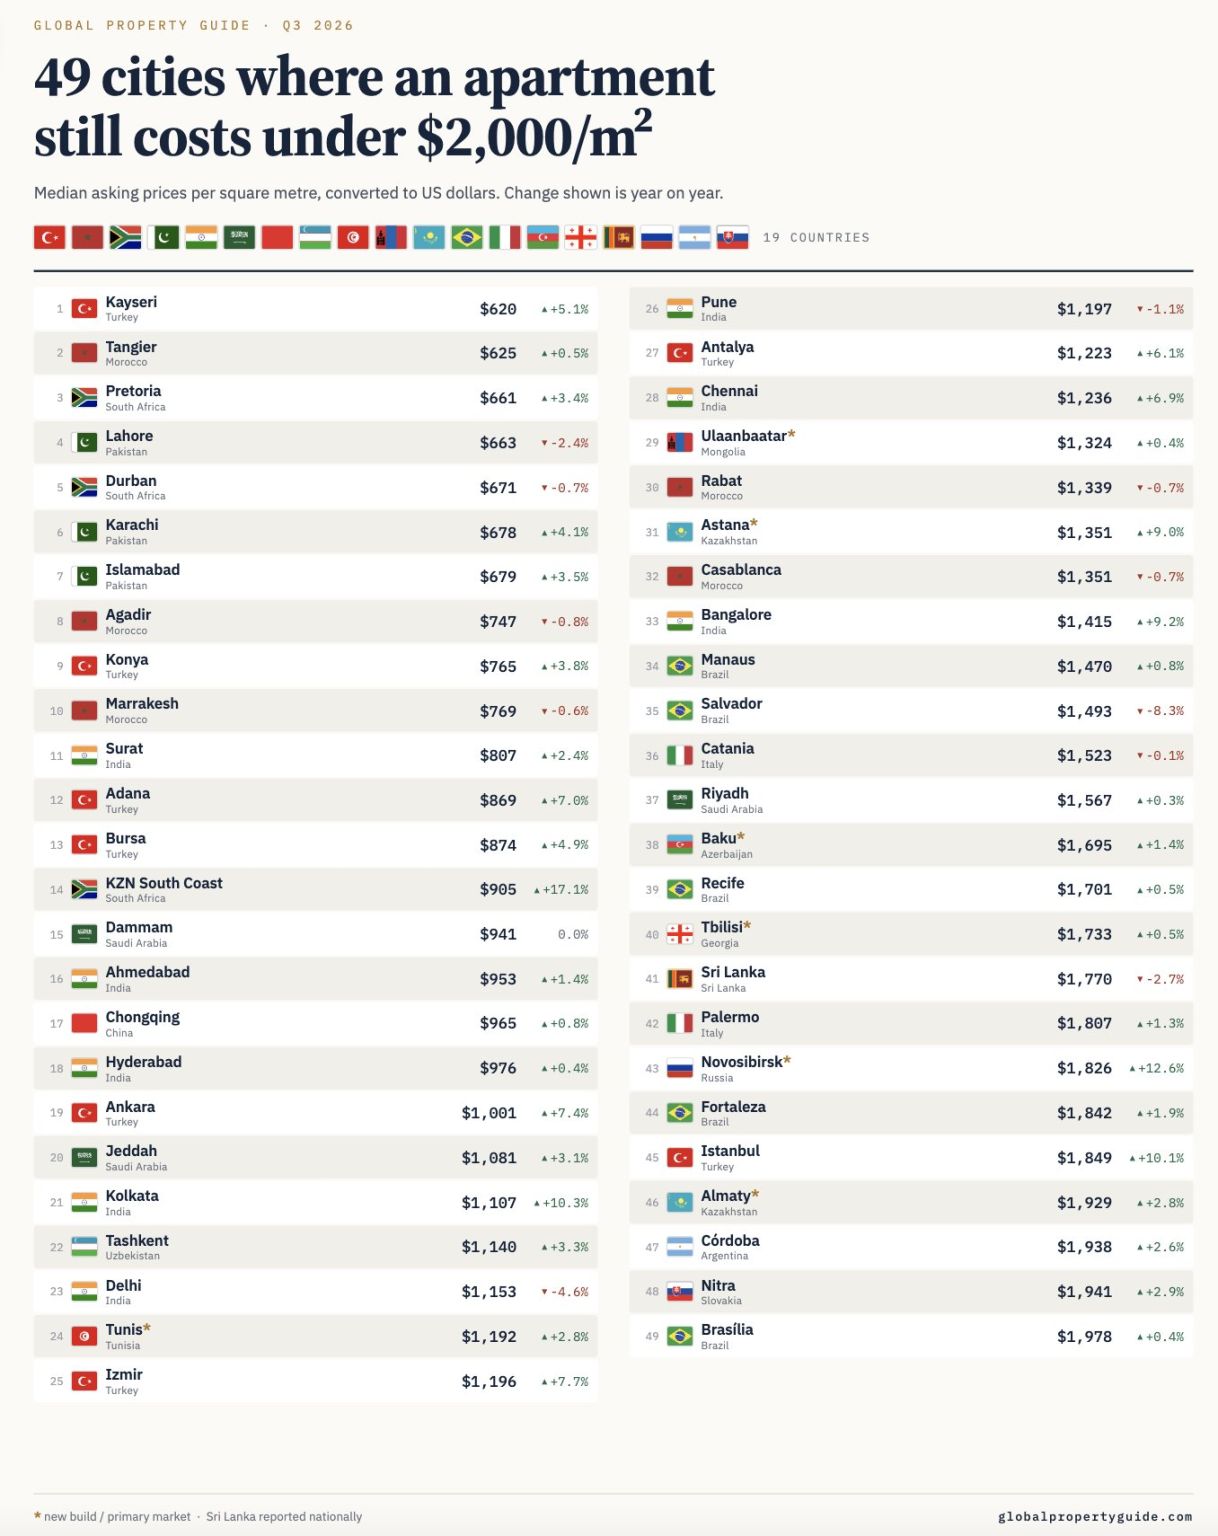
There aren't many countries left where you can still buy an apartment for under $2,000/m². Here are some of them: Turkey India Brazil Morocco Pakistan South Africa Saudi Arabia Italy (southern regions) Kazakhstan Argentina Azerbaijan Georgia Mongolia Slovakia Sri Lanka Tunisia Uzbekistan In many of these countries, you can still find newly built apartments in city centers for less than $2,000/m². Of course, prices vary significantly by city, neighborhood, and property type. Which countries am I missing? Share your suggestions in the comments.
- LINKEDIN · IMAGESince 1 Oct 2026
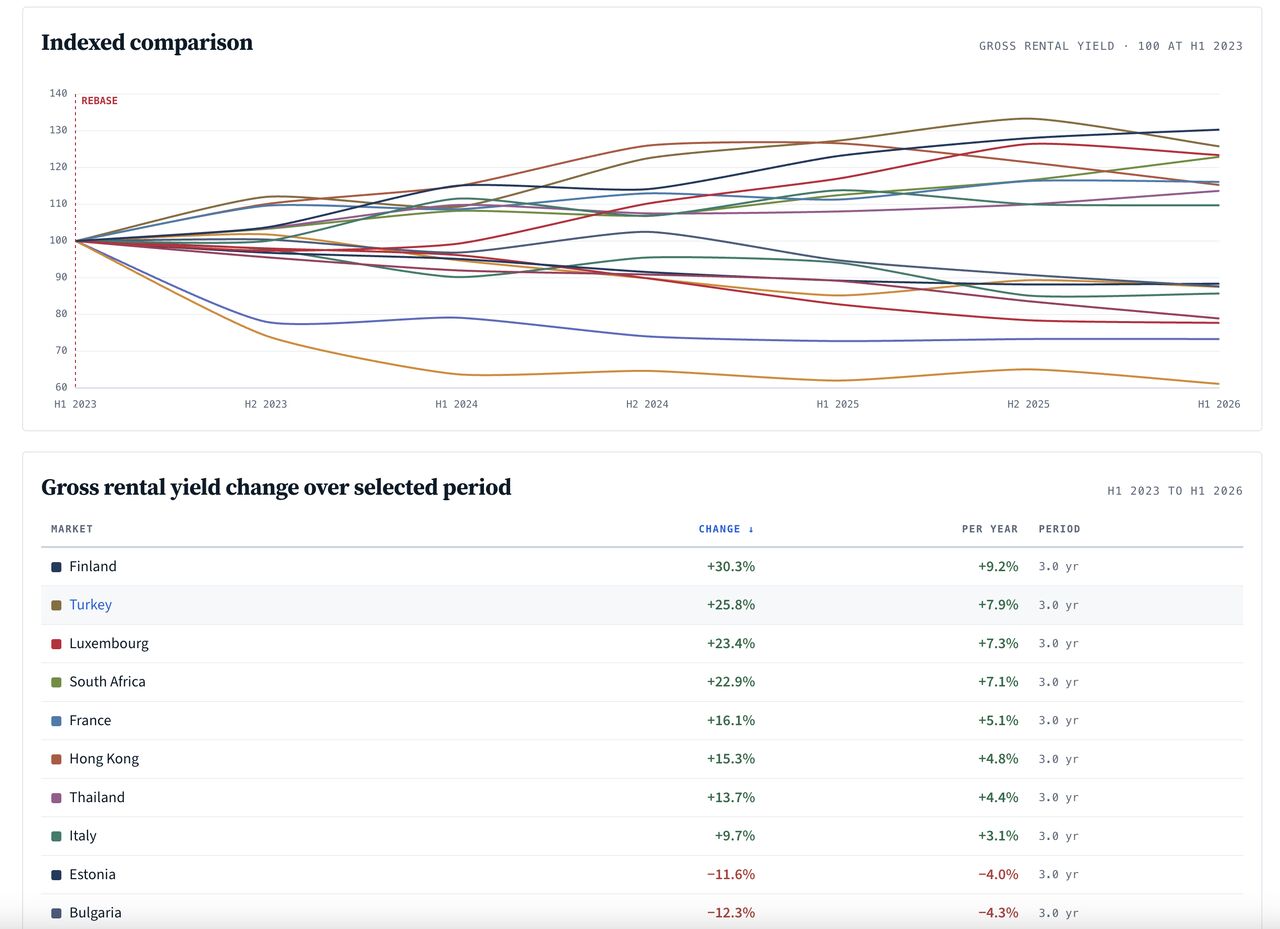
Where are rental yields rising, and where are they being compressed? You can now track the direction of rental yields on Global Property Guide. Here’s the change over the past three years, based on national averages calculated from median asking prices and rents. Where rental yields have fallen: Georgia: down 38.9% Qatar: down 26.7% Portugal: down 22.3% Lithuania: down 21.1% Singapore: down 14.3% Czechia: down 12.5% Bulgaria: down 12.0% Estonia: down 11.4% Falling yields mean property prices have risen faster than rents, or rents have fallen faster than property prices. Where rental yields have risen: Finland: up 30.3% Turkey: up 25.8% Luxembourg: up 23.4% South Africa: up 22.9% France: up 16.1% Hong Kong: up 15.3% Thailand: up 13.7% Italy: up 9.7% Rising yields mean rents have increased faster than property prices, or property prices have fallen faster than rents. These figures show relative changes in gross rental yields. Higher yields do not necessarily mean a stronger property market.
- LINKEDIN · IMAGESince 28 Sept 2026
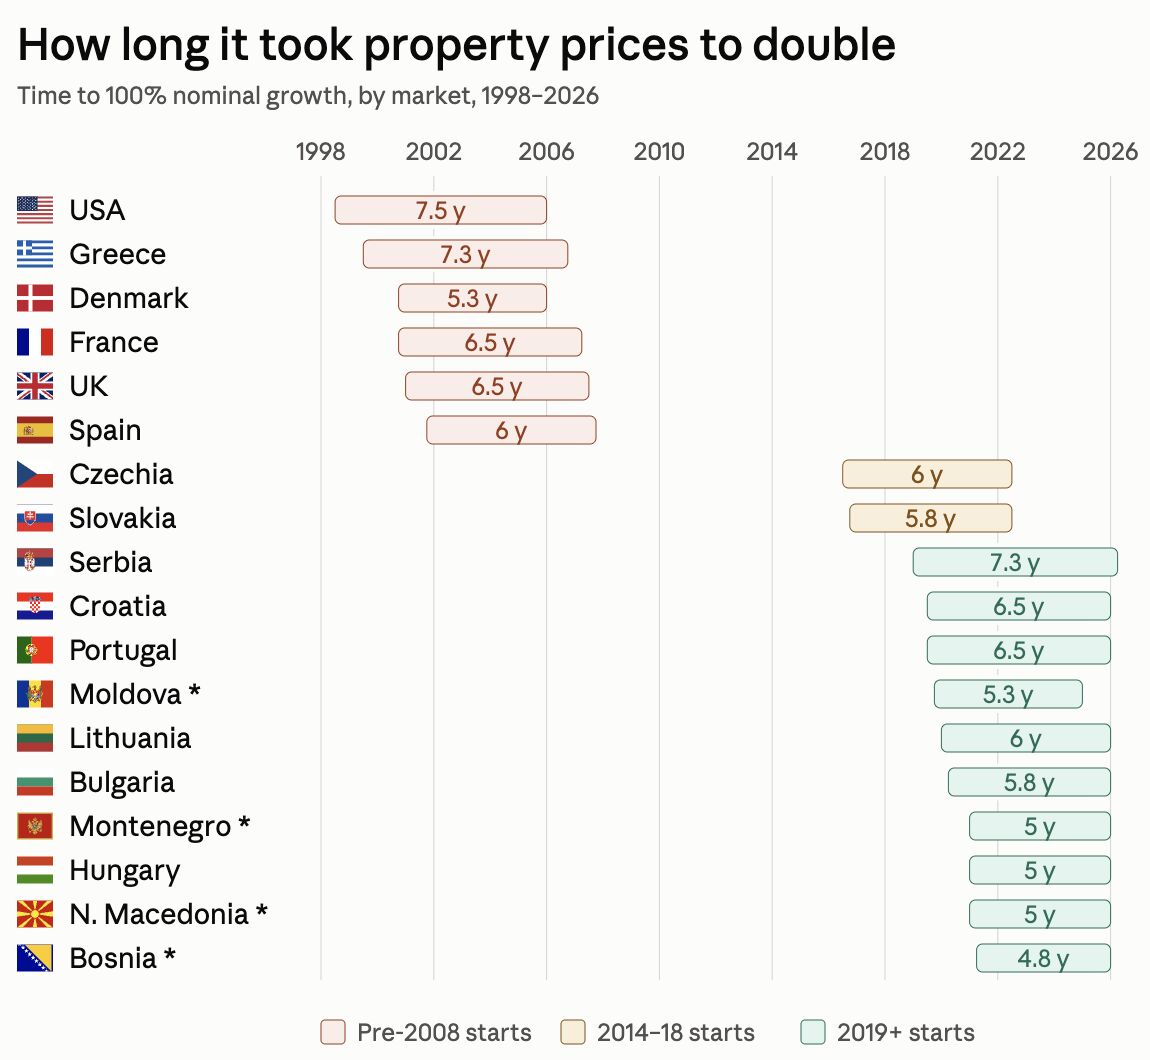
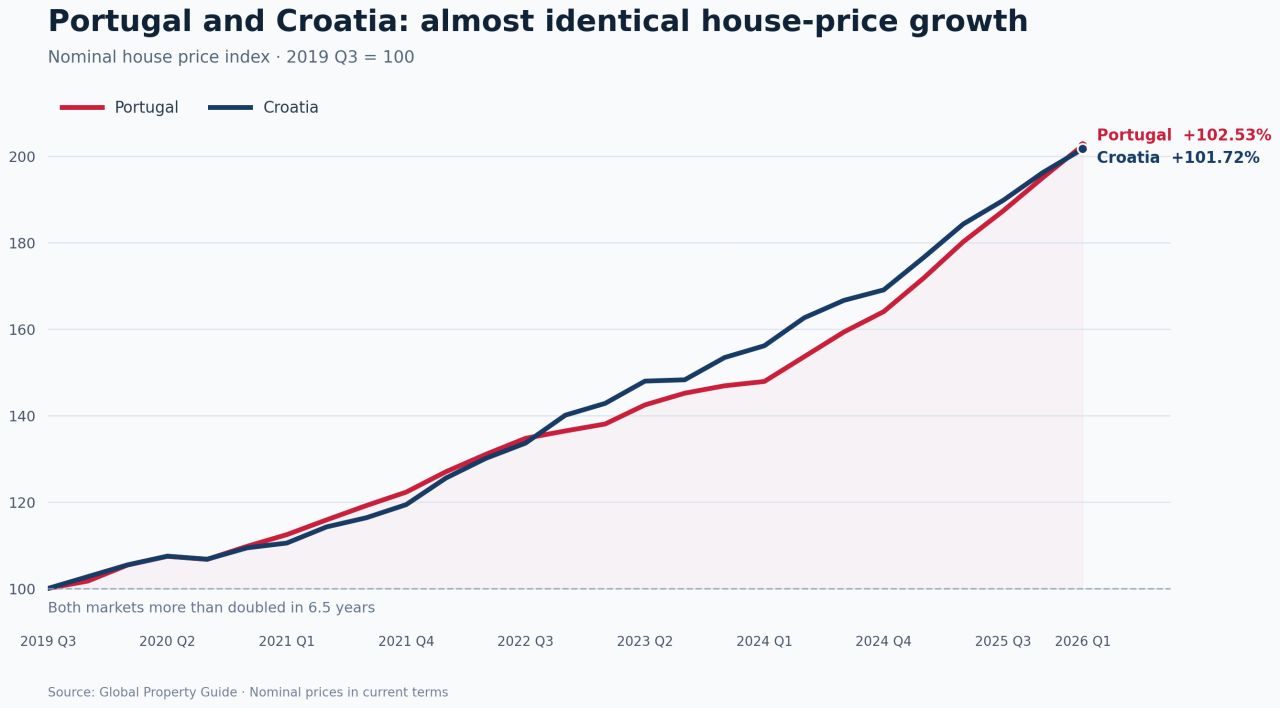
A pattern in European house prices worth paying attention to. Between 2000 and 2007, residential prices doubled in several major markets within a remarkably short period: Denmark: 5 years (2000 Q4 to 2006 Q1) Spain: 6 years (2001 Q4 to 2007 Q4) UK: 6.5 years (2001 Q1 to 2007 Q3) France: 6.5 years (2000 Q4 to 2007 Q2) Since 2019, a comparable pace has returned, though in a different set of markets. Portugal and Croatia both doubled over the same 6.5-year window (Q3 2019 to Q1 2026), following an almost identical trajectory. In the new-build segment, the doubling was even faster for the following countries/cities. Bosnia & Herzegovina: 4.8 years (21 Q2 to 26 Q1) Montenegro: 5 years (21 Q1 to 26 Q1) Skopje: 5 years (21 Q1 to 26 Q1) Chisinau: 5.3 years (20 Q4 to 26 Q1) It’s a useful reminder: the markets attracting the most attention aren’t always the ones producing the most interesting results. Which market do you expect to be the next to double within seven years or less?
- LINKEDIN · IMAGESince 28 Sept 2026
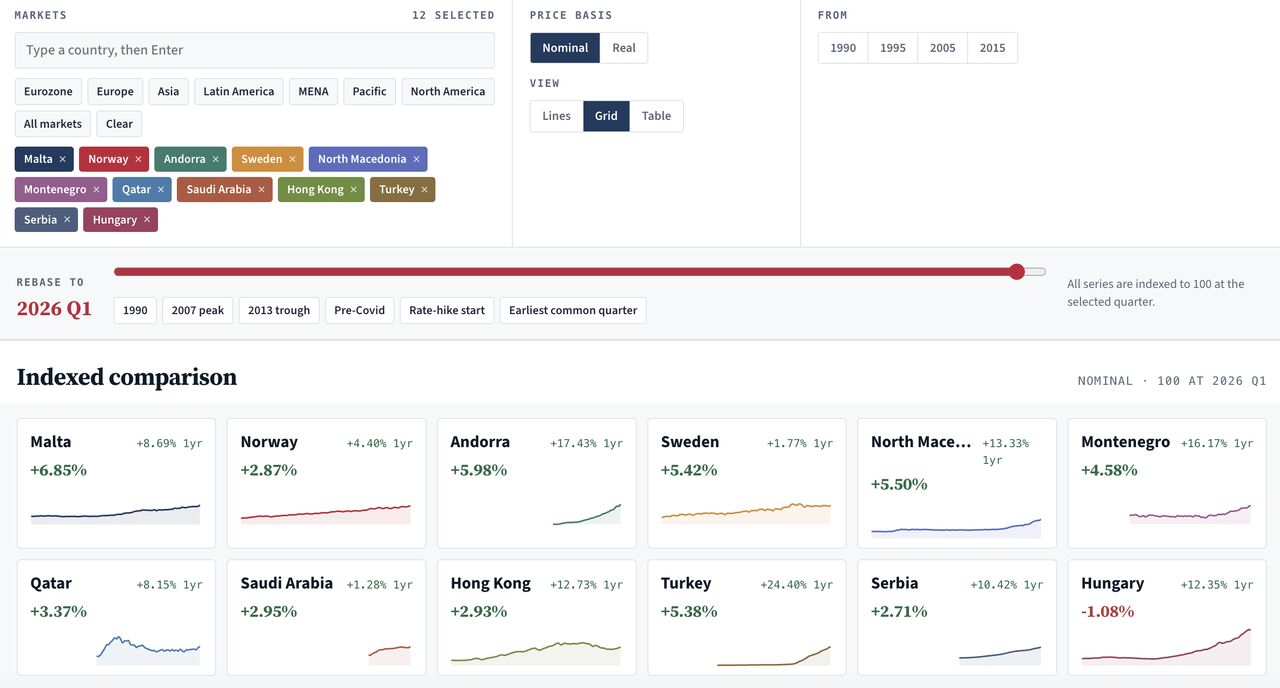
We recently updated most of our house price indices to the latest figures from Q2 2026. Here is a quick overview of q-o-q price changes: Malta: +6.85% Andorra: +5.98% North Macedonia: +5.50% Sweden: +5.42% Turkey: +5.38% Montenegro: +4.58% Qatar: +3.37% Saudi Arabia: +2.95% Hong Kong: +2.93% Norway: +2.87% Serbia: +2.71% Note: House price indices are calculated in each country's own currency. If you're a EUR or USD investor, it's always worth checking how the currency moved over the same quarter. Against the EUR: Lost: Turkey (−3.8%), Sweden (−1.4%), Norway (−0.9%) Gained: Qatar, Saudi Arabia, Hong Kong (+0.9%, USD pegs) Against the USD: Lost: Turkey (−4.7%), Sweden (−2.2%), Norway (−1.8%), and the euro-based markets Malta, Andorra, Montenegro, North Macedonia and Serbia (−0.9%) The biggest swing: Turkey. Its +5.38% price growth shrinks to +1.4% for EUR investors and +0.5% for USD investors once the lira's fall is counted. 💬 How do you measure your property returns: in local currency, EUR, USD, or something else?
- LINKEDIN · IMAGESince 18 Sept 2026
Portugal and Croatia’s residential property markets have followed remarkably similar trajectories since Q1 2019. While Portugal has attracted considerable international attention, Croatia’s comparable performance has received far less recognition. An average property purchased in either country in Q1 2019 would likely have approximately doubled in value by now.
6 of 240 adsSign up to see every Global Property Guide ad, filter by format and date, and get alerts on new ones.
See all 240 adsQuestions about Global Property Guide’s ads
Is Global Property Guide running LinkedIn ads?
We recorded no live LinkedIn ads for Global Property Guide on 7 Nov 2026.
How many LinkedIn ads has Global Property Guide run?
LinkedIn’s ad library lists 180 ads for Global Property Guide. We recorded 240 LinkedIn ads for Global Property Guide, first recorded on 21 Sept 2026 and last recorded on 18 Oct 2026.
Does Global Property Guide advertise on Facebook and Instagram?
Global Property Guide’s Facebook page had no active ads in Meta’s Ad Library, last recorded on 22 Oct 2026.
Does Global Property Guide run Google ads?
Yes. We recorded 18 Google ads for the domain globalpropertyguide.com on 30 Oct 2026.
Which ad formats does Global Property Guide use?
The 6 LinkedIn ads on this page include 6 image ads.
Watch the companies you care about.
Filter every ad by industry, country, format and network, and get alerts when a company you watch starts running new ads.