Not on air · 2 of 3 networks checked

Getplace.io ads
- getplace.io
- Data Infrastructure and Analytics
- NL
- 5 employees
Getplace.io’s ads on LinkedIn, Meta and Google, recorded by adsrunning. Browse the latest here for free. Sign up free to see all 28. Watch Getplace.io on any plan to get each new one in your feed.
Watchlist included in every plan
What Getplace.io runs
- Single image · LinkedIn
- 6
| Network | Status | Live ads | Nov 2025LinkedIn activity · 52 weeksNov 2026 | Checked | Next step |
|---|---|---|---|---|---|
| None recorded | 0 | Checked 7 Nov 2026 | See all 28 ads → | ||
| Meta | Not checked | — | |||
| None recorded | 0 | No ads found on the Google Ads Transparency Center | Checked 30 Oct 2026 | Collect them with the API → |
Getplace.io has no live LinkedIn ads. We recorded no Google ads on 30 Oct 2026.
Latest ads
- LINKEDIN · IMAGESince 23 Oct 2026
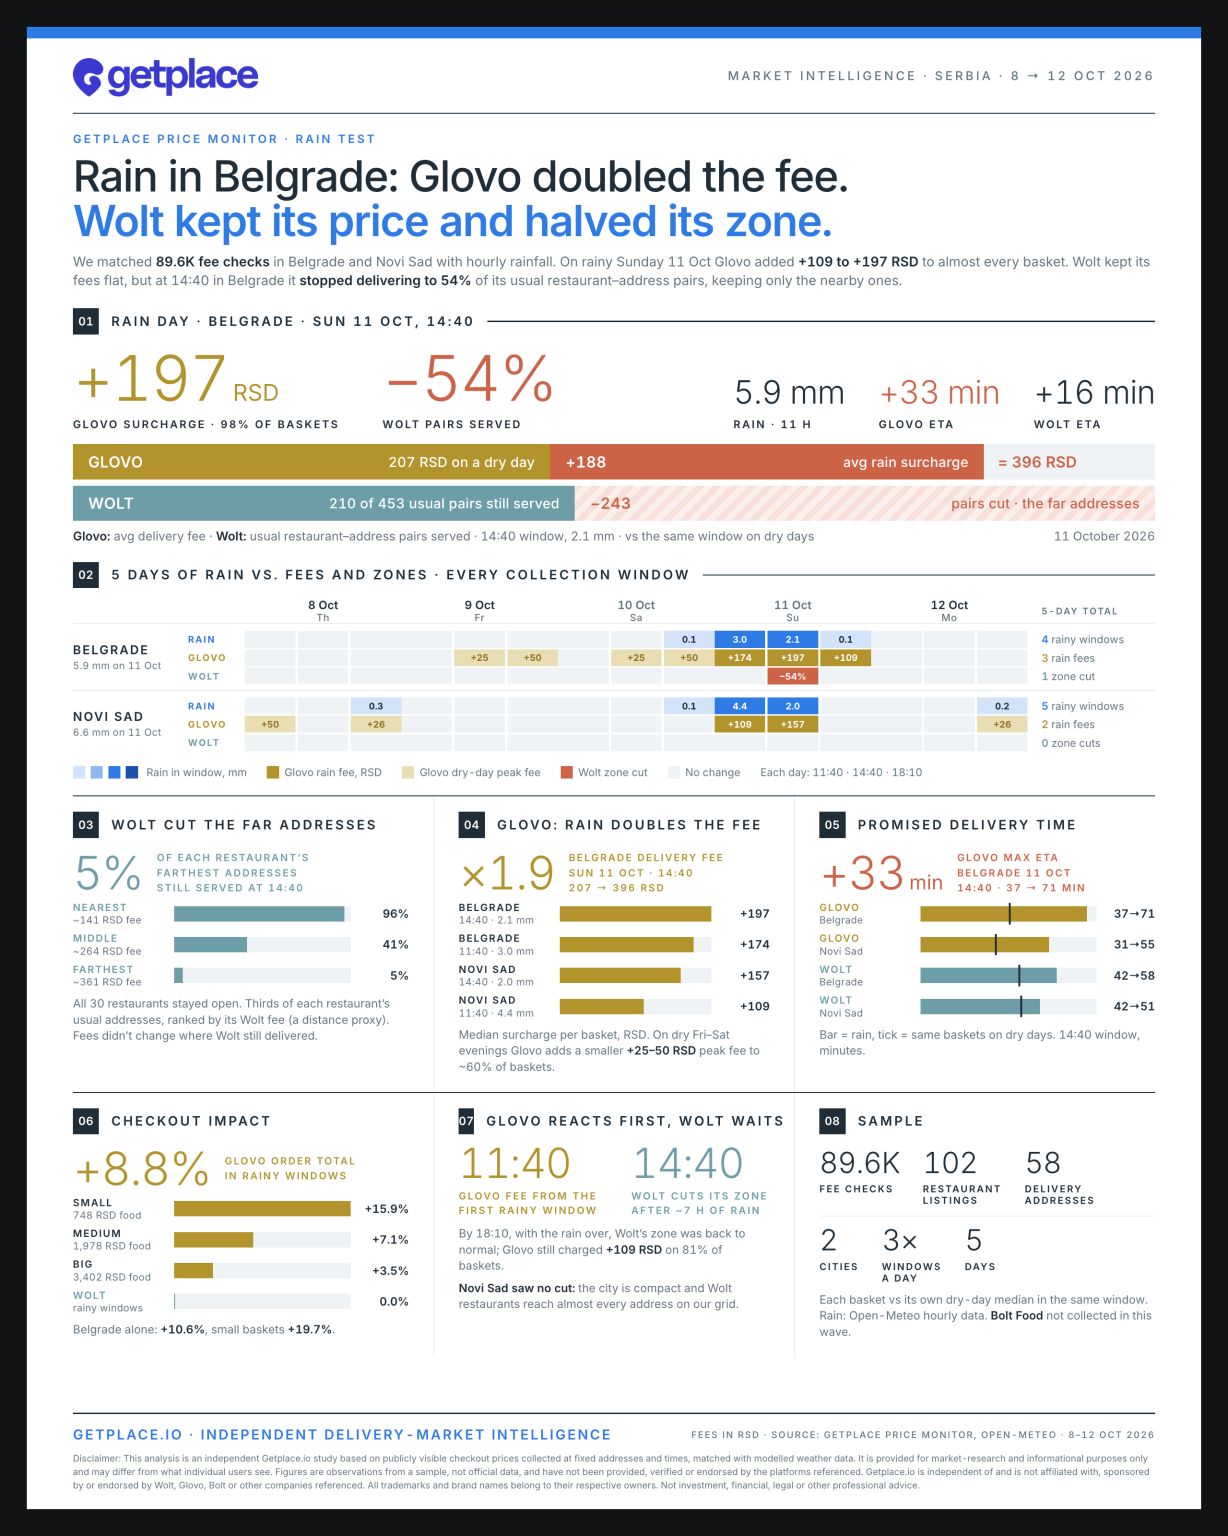
🌧️ Same city. Same rain. Same Sunday. How Glovo and Wolt react on weather? Glovo doubled the delivery fee. Wolt kept its prices and shrank the map. We ran 89,600 price checks in #Belgrade and #NoviSad (8–12 Oct): same restaurants, same addresses, same baskets, 3 times a day. Then matched every check with hourly rainfall. #Belgrade, Sunday 11 Oct, 11 hours of rain 👇 🟡 #GLOVO: pay more → Avg delivery fee 207 }→ 396 RSD (×1.9) → +197 RSD median surcharge, on 98% of baskets → Switched on at the first rainy check, 11:40 → Promised delivery 37 → 71 min } → Still +109 RSD at 18:10, after the rain stopped 🔵 #WOLT: reach less → Delivery fees unchanged → At 14:40, only 46% of usual restaurant–address pairs on our grid were deliverable → All 30 restaurants stayed open. What vanished was distance: nearest addresses: 96% served - middle: 41% - farthest: 5% → Back to normal by 18:10 🤯 3 things we didnt expect 1️⃣ Glovo reacts instantly, Wolt waits. At 11:40 Wolt looked normal after 4+ hours of rain. The cut came after ~7. 2️⃣ The fee is flat, so small orders pay most: a ~680 RSD meal got 20% pricier at checkout, a ~3,400 RSD order only 4%. 3️⃣ Paying double didnt buy speed: Glovos ETA still grew 33 min, Wolts 16. Same rain in Novi Sad: Glovo added +109 to +157 RSD, Wolt cut nothing. The city is compact enough that restaurants still reach nearly every address we track. So when it rains in Belgrade, you choose: 💸 pay double 🗺️ or live close enough Which model is fairer to customers, couriers and restaurants at the edge of the zone? 👇 #FoodDelivery #DynamicPricing #Belgrade #Serbia #Wolt #Glovo #MarketIntelligence Disclaimer: Independent Getplace.io analysis of publicly visible checkout prices, delivery times and delivery availability, collected for a limited sample of restaurants, addresses and time windows in Belgrade and Novi Sad (8–12 Oct 2026) and matched with modelled hourly weather data (Open-Meteo). Figures are observations from this sample, may differ from what other users, areas or periods experience, and are not official, audited or platform-reported. They have not been provided, verified or endorsed by Wolt, Glovo or other companies referenced, do not contain confidential or non-public information, and draw no conclusion about the reasons for any platforms decisions. Getplace.io is independent of and unaffiliated with the companies referenced. Brand names and trademarks are used solely for identification and remain the property of their respective owners. For market-research and informational purposes only; not investment, financial, legal or other professional advice.
- LINKEDIN · IMAGESince 8 Oct 2026
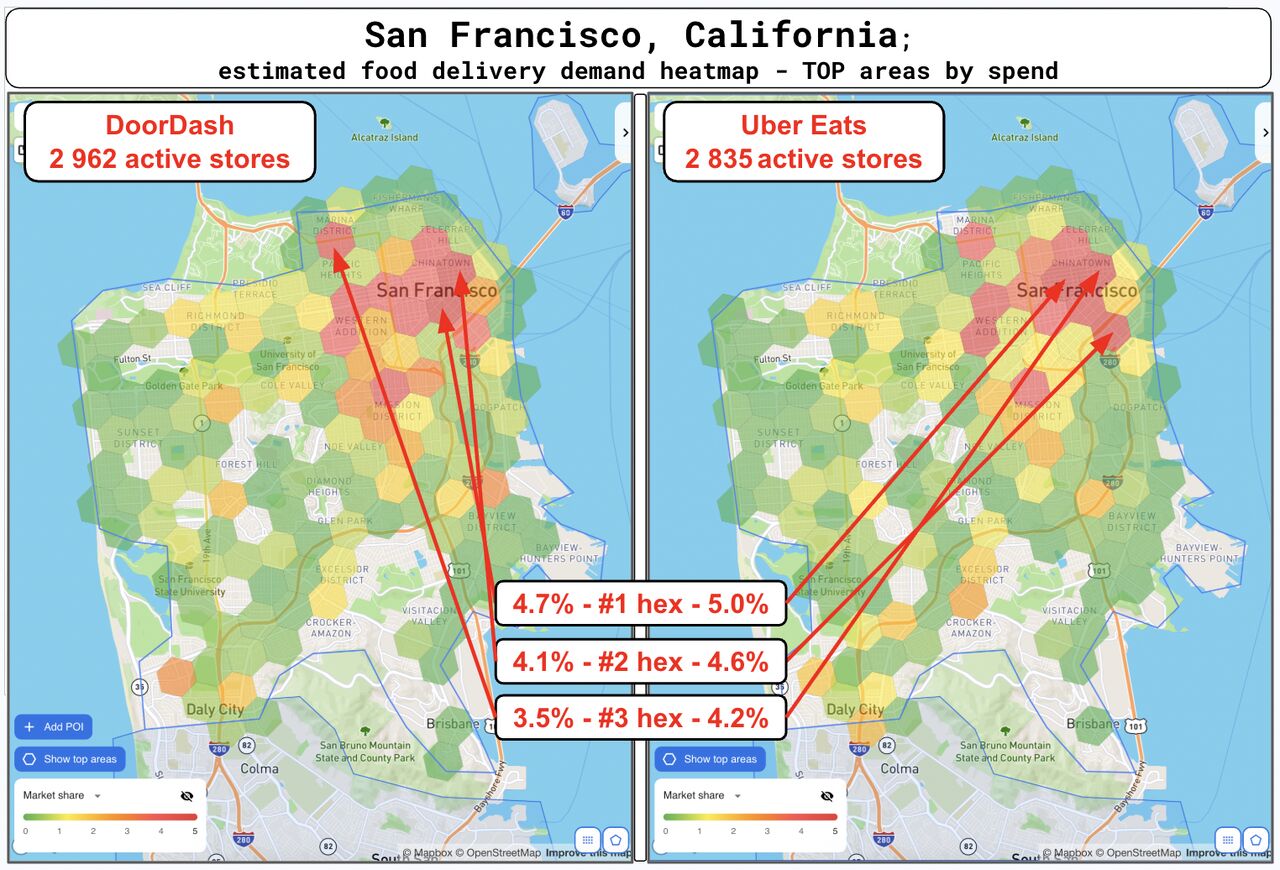
DoorDash and Uber Eats have almost the same active-store footprint in #SanFrancisco, #USA. - #DoorDash: 2,962 active stores observed - #Uber Eats: 2,835 active stores observed Just 127 stores apart. At city level, #DoorDash and #UberEats look almost identical in terms of active-store footprint. But zoom in to neighbourhood level — and the picture changes. The concentration is visible in the numbers too. The top 3 hexes represent an estimated 12.3% of DoorDash spend and 13.8% of #Uber Eats spend across #SanFrancisco. That means roughly one-eighth of estimated delivery spend is concentrated in just three small areas. And the strongest areas are not perfectly aligned between the two platforms. Same city. Similar supply. Different demand geography. Which US city should we map next? Disclaimer: This analysis is an independent Getplace.io estimate based on proprietary datasets, observed market signals and statistical modelling. Active-store counts reflect Getplace.io observations at the time of analysis. Heatmaps represent estimated relative delivery-demand concentration and are not official or audited sales, transaction or market-share figures from DoorDash or Uber Eats. Unless explicitly stated otherwise, the figures and visualisations are estimates and may differ materially from actual platform results. Getplace is not affiliated with or endorsed by DoorDash or Uber Eats.
- LINKEDIN · IMAGESince 6 Oct 2026
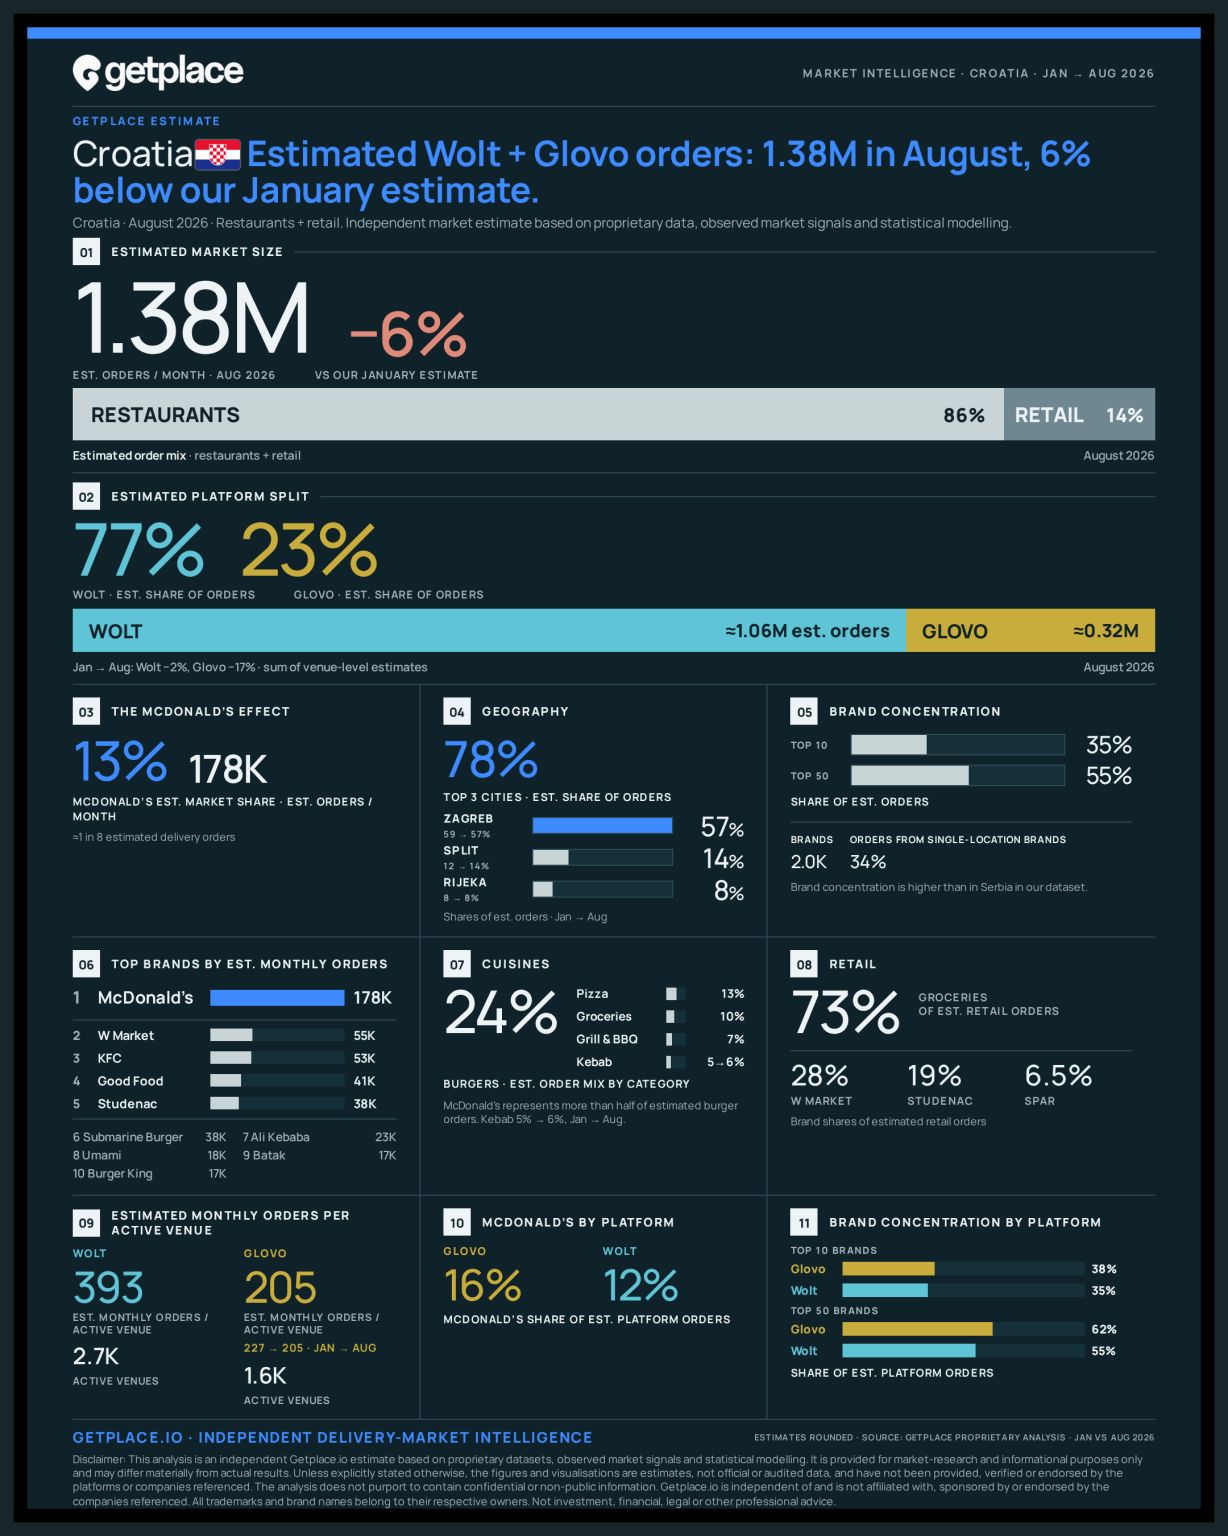
Getplace.io estimate: Wolt (DoorDash) accounts for ~77% of #Croatia's delivery market vs ~23% for Glovo (Delivery Hero). The market itself is around 1.38M orders in #August — 6% below our #January estimate, with most of the estimated decline coming from #Glovo (−17% vs −2% for #Wolt). #Wolt's estimated share is 76% in #restaurants and 82% in #retail. Geography is highly concentrated too. Between #January and #August, the estimated order mix shifted toward the coast: #Zagreb moved from 59% to 57%, while #Split increased from 12% to 14%. Then there is brand concentration. #Croatia has around 2.0K brands in our dataset, but the top 10 account for 35% of estimated orders and the top 50 for 55%. And one brand stands far above the rest: McDonald's ~178K estimated orders a month, representing 13% of estimated orders in our #Croatia model. #Burgers account for 24% of estimated orders, and more than half of those burger orders are associated with #McDonald's in our dataset. There is also a substantial difference at venue level: - Wolt: ~2.7K active venues in our August dataset / 393 est. monthly orders per active venue - Glovo: ~1.6K / 205 est. monthly orders per active venue For Glovo, that second number was 227 in January. Glovo's estimated order mix is also somewhat more concentrated among large brands: - McDonald's: 16% of Glovo orders vs 12% of Wolt - Top 10 brands: 38% vs 35% - Top 50 brands: 62% vs 55% Retail tells a similar concentration story: - 73% of estimated retail orders are groceries - led by Wolt Market at 28% of retail orders - Studenac market at 19% and SPAR at 6.5%. So the Croatia story is not simply 77/23. Our estimate shows a market that is smaller than in January, mainly because of Glovo, highly concentrated geographically and by brand, and where the two largest delivery platforms currently show very different order volumes per active venue. — Disclaimer: This analysis is an independent Getplace.io estimate based on proprietary datasets, observed market signals and statistical modelling. It is provided for market-research and informational purposes only and may differ materially from actual results. Figures are estimates, not official or audited data, and have not been provided, verified or endorsed by Wolt, Glovo, McDonald's or other companies referenced. The analysis does not purport to contain confidential or non-public information. Getplace.io is independent of and unaffiliated with the companies referenced. All trademarks and brand names belong to their respective owners. Not investment, financial, legal or other professional advice.
- LINKEDIN · IMAGESince 2 Oct 2026
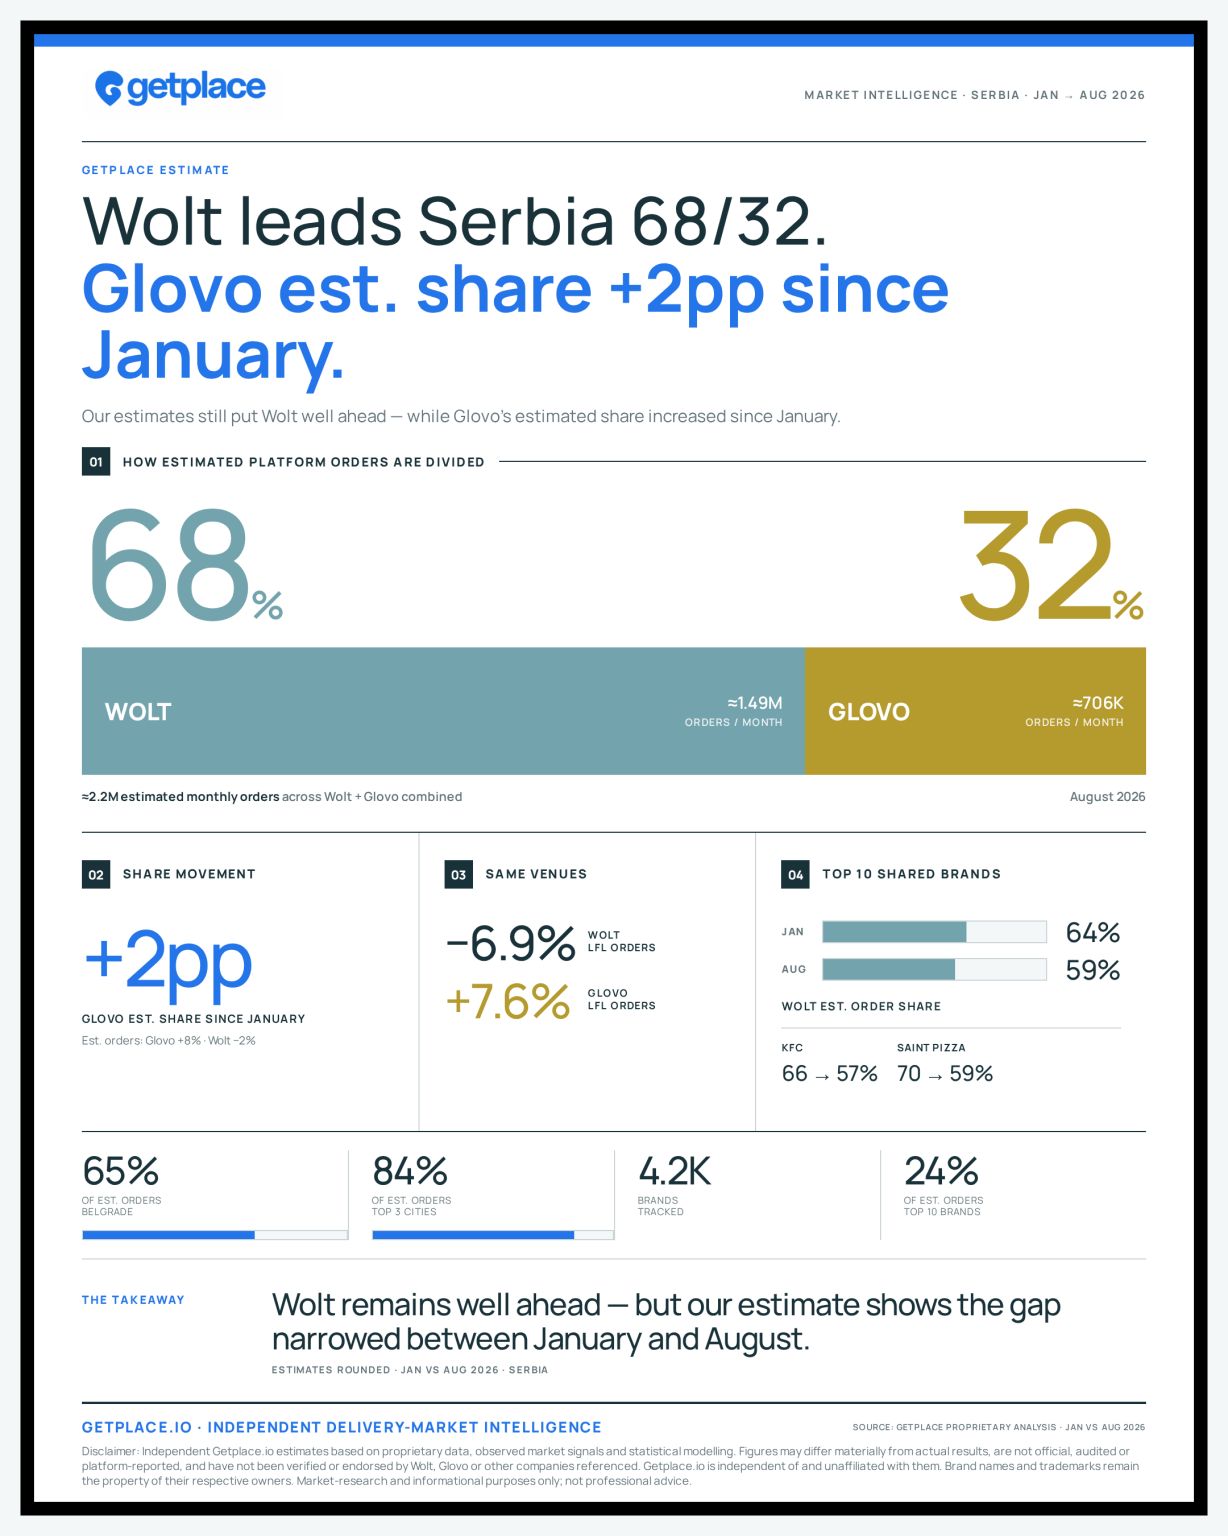
Getplace.io estimate: #Serbia's 🇷🇸 delivery market grew just 1% between #January 2026 and #August 2026. Our #August 2026 estimate puts the market at roughly 2.2M monthly orders, Wolt (DoorDash) and Glovo (Delivery Hero) combined. - #Wolt still leads: 68% / ~1.49M orders, GP estimate - #Glovo: 32% / ~706K, GP estimate But the headline split hides a more interesting competitive picture. Since January, our model estimates: - #Glovo orders +8%, GP estimate - #Wolt orders −2%, GP estimate And the strongest signal appears when we remove network expansion from the equation and look only at venues present in both periods: - Glovo LFL orders: +7.6%, GP estimate - Wolt LFL orders: −6.9%, GP estimate The same direction is visible in major brands present on both platforms. Across the top 10 shared brands, our estimated - Wolt order share moved from 64% to 59%, GP estimate - KFC: 66% → 57% - Saint Pizza: 70% → 59% But this is not a story of Wolt suddenly becoming weak. Wolt still has a significant structural advantage: - 4.8K active venues vs 2.8K for Glovo - 310 estimated orders per venue vs 253 ~75% estimated share in #grocery and ~88% in #sushi #Serbia itself is also an unusual market: - Belgrade generates ~65% of estimated orders. - The top three cities generate 84%. Yet the brand landscape is fragmented: around 4.2K brands, with the top 10 accounting for only 24% of orders. Even McDonald's, the largest brand in our estimate, represents just 5.4% of the market. So the headline is 68/32. The signal is underneath. Our model still puts #Wolt well ahead overall, while #Glovo's estimated share increased between January and August — with the clearest movement visible in like-for-like venues and major shared chains. That’s the level of market intelligence we’re building at Getplace.io: not just who is bigger, but where the competitive picture is actually changing. — Disclaimer: Independent Getplace.io estimates based on proprietary data, observed market signals and statistical modelling. Figures may differ materially from actual results and are not official, audited or platform-reported. They have not been provided, verified or endorsed by Wolt, Glovo or other companies referenced and do not purport to contain confidential or non-public information. Getplace.io is independent of and unaffiliated with the companies referenced. Brand names and trademarks are used solely for identification and remain the property of their respective owners. For market-research and informational purposes only; not investment, financial, legal or other professional advice.
- LINKEDIN · IMAGESince 30 Sept 2026
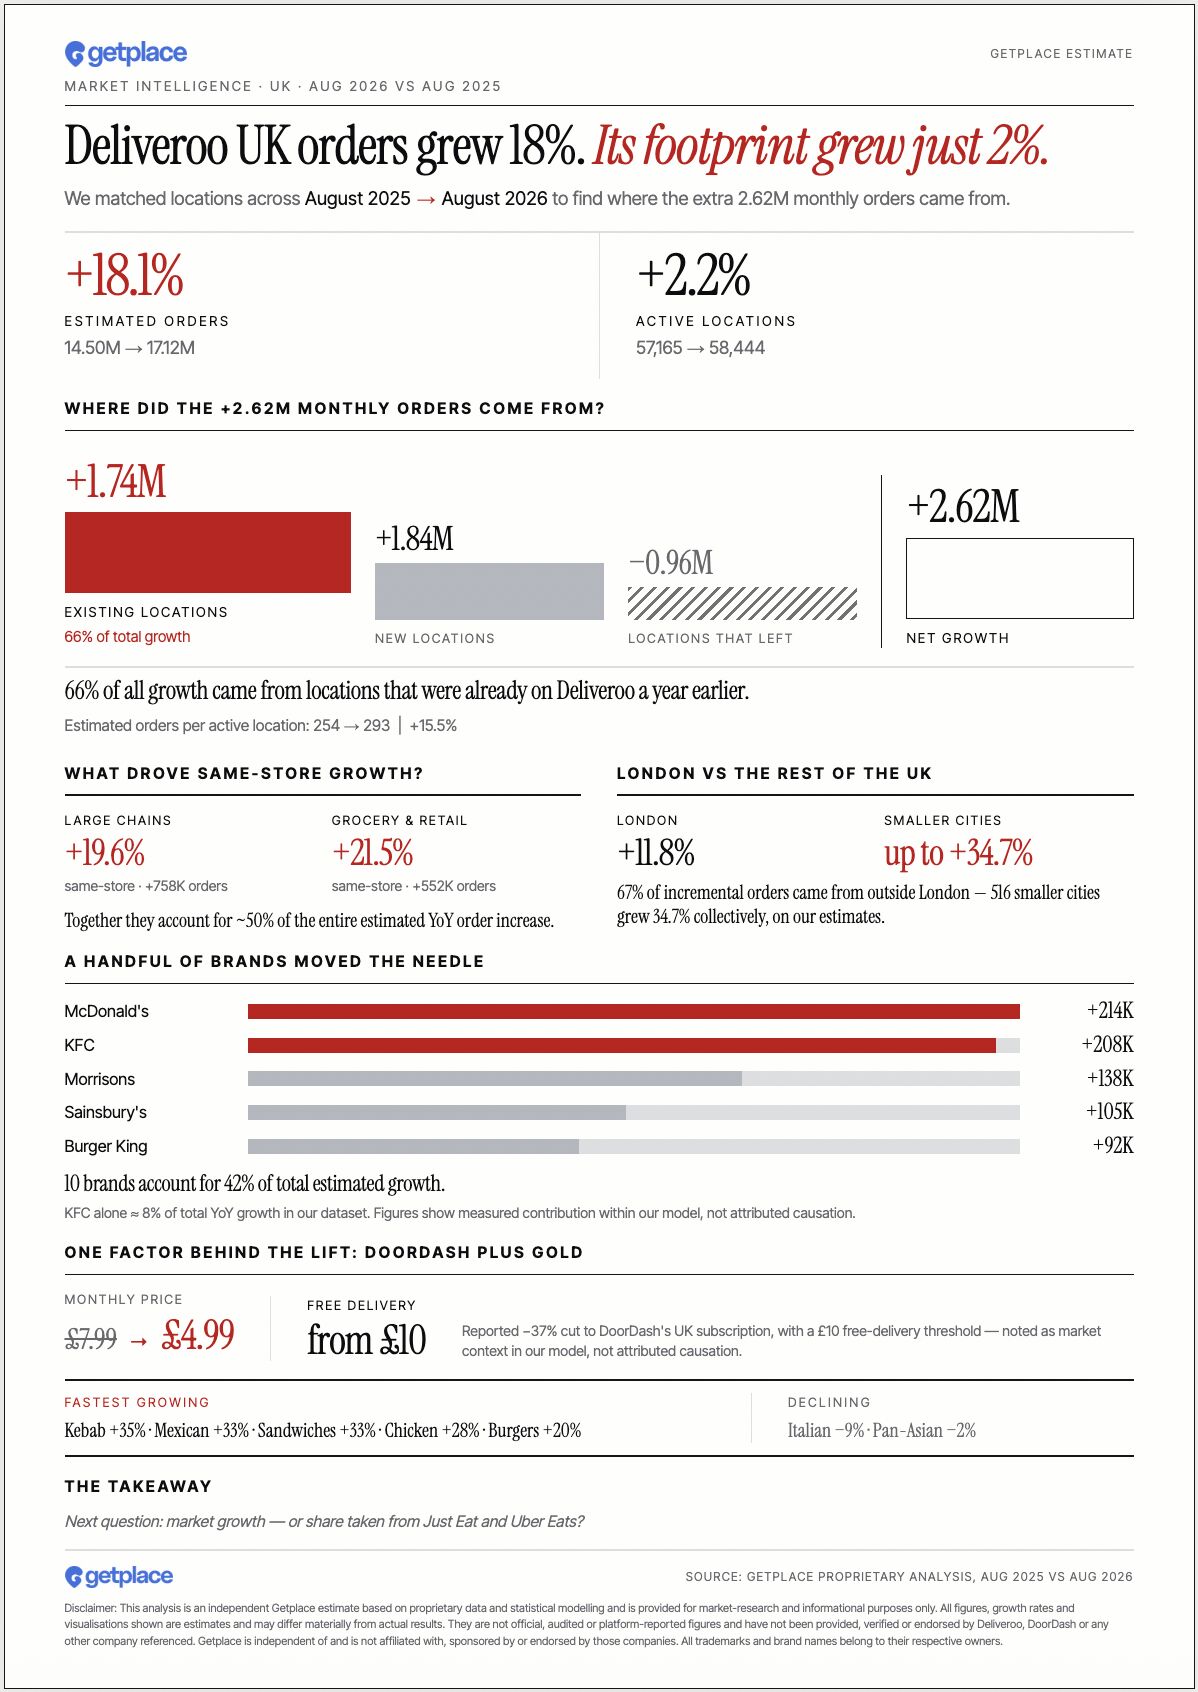
Our estimate puts Deliveroo #UK at 14.5M monthly orders in #August #2025 and 17.1M in #August #2026 — up 18%. But its active-location count barely moved. So where did the extra 2.6M monthly orders come from? 1. Existing locations did most of the work. 45,530 locations present in both periods generated +1.74M orders — 66% of the total growth. Orders per active location increased 15.5%, while the number of active locations grew 2.2%. - 57,165 active locations in August 2025 - 58,444 in August 2026 - 11,635 locations present in Aug 2025 were no longer present in Aug 2026 - 12,914 locations appeared in Aug 2026 that were not present a year earlier 2. Location turnover was strongly accretive in our estimate. Locations present in Aug 2026 but not a year earlier accounted for an estimated +1.84M monthly orders, while locations present in Aug 2025 but no longer present represented −0.96M. Net contribution: +0.88M, roughly 34% of the estimated growth. 3. Big chains and grocery were the biggest contributors to LFL growth. Together, these segments accounted for 75% of the estimated growth from existing locations — and roughly half of the total +2.62M increase. Growth was also highly concentrated: 10 brands accounted for 42% of the estimated YoY increase — McDonald's, KFC, Morrisons, Sainsbury's Supermarket, Burger King, Co-op, Subway, Pepe's Piri Piri, bp Marks and Spencer Food and Tortilla Mexican Grill plc. 4. Estimated growth was much faster outside #London. The smaller the market, the faster Deliveroo grew: across our city-size groups, growth accelerated as we moved down the ranking: - #London: +11.8% - Cities #2–10: +15.5% - Cities #11–50: +23.7% - Remaining 516 cities: +34.7%. As a result, 67% of all incremental orders came from outside #London. #Birmingham stands out in our estimate: +40% YoY. 4. After DoorDash completed the acquisition, Deliveroo’s public Plus page now lists Plus Gold at £4.99/month, with free delivery on eligible restaurant orders over £10. For comparison, Uber One is £4.99/month, with a £15 minimum for £0 delivery on eligible restaurant orders. Prices and terms checked 29 Sep 2026. — Disclaimer: This analysis is an independent Getplace.io estimate based on proprietary data, market signals and statistical modelling, for market-research and informational purposes only. Figures and visualisations may differ materially from actual results and are not official, audited or platform-reported. Unless explicitly cited as public-source information, figures have not been provided, verified or endorsed by Deliveroo, DoorDash or any other company referenced and do not purport to represent confidential or non-public information. Getplace.io is independent and not affiliated with, sponsored by or endorsed by those companies. Company and brand names are used only for identification and remain the property of their respective owners. Nothing herein constitutes investment, financial, legal or other professional advice.
- LINKEDIN · IMAGESince 28 Sept 2026
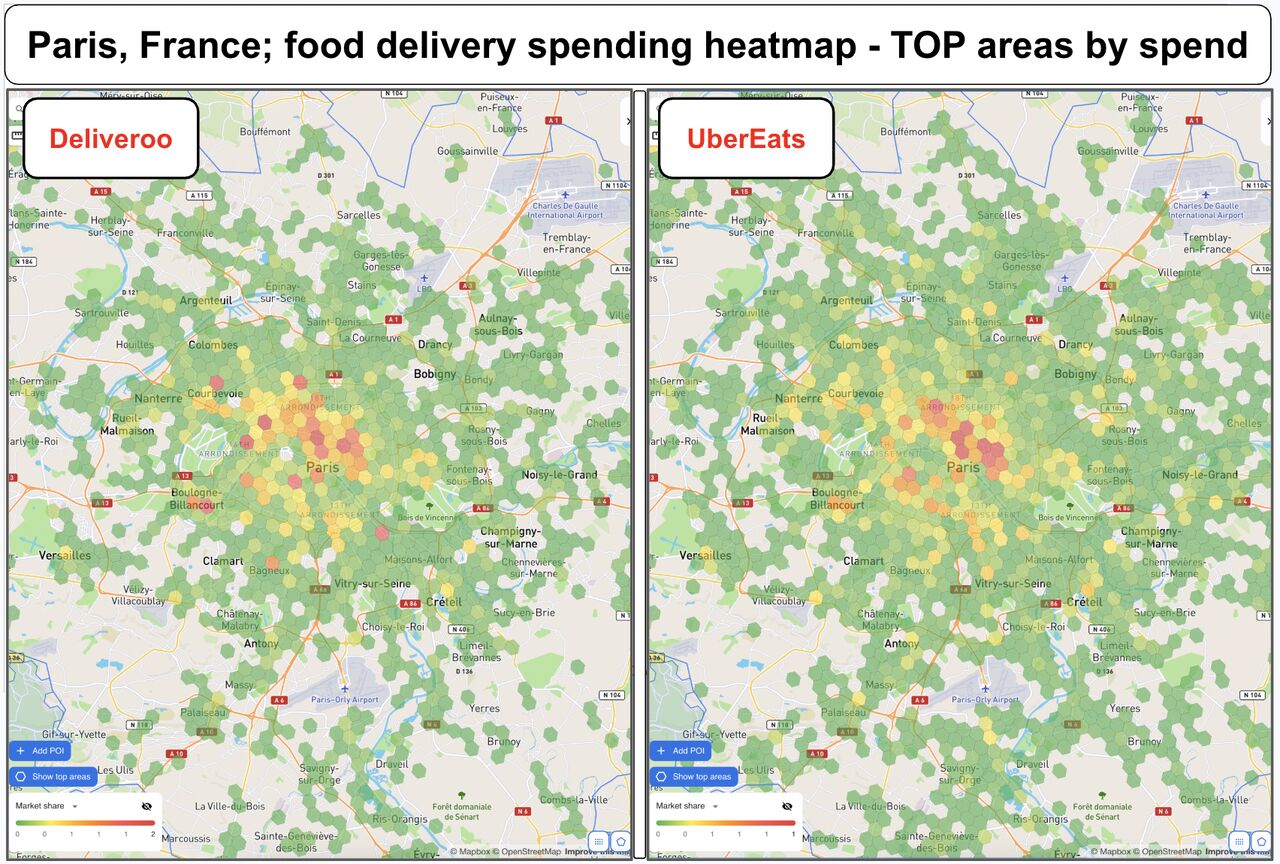
Deliveroo vs Uber Eats in #Paris, #France. Spot the difference. 👀 At first glance, the spending maps look almost identical. Central #Paris is hot on both. The suburbs cool down on both. But zoom in — and the strongest pockets start to diverge. Same city. Same customers (or not?). Two platforms. Different geography of spending. Different top stores/chains. And that’s exactly what a city-level /country level market share number doesn’t show. One platform can be stronger overall — while the other wins individual neighborhoods, streets and restaurant catchment areas. At Getplace.io, we estimate food-delivery spending at a granular geographic level — so platforms and restaurant brands can see where demand actually sits, not just who is bigger at city level. Which map looks stronger to you — Deliveroo or Uber Eats? 👀 Disclaimer: This analysis is an independent Getplace.io estimate based on proprietary datasets, observed market signals and statistical modelling. It is provided for market-research and informational purposes only and may differ materially from actual results. Unless explicitly stated otherwise, the figures and visualisations are estimates, not official or audited data, and have not been provided, verified or endorsed by the platforms or companies referenced. Getplace.io is independent of and is not affiliated with, sponsored by or endorsed by Deliveroo, Uber Eats or any other brand. All trademarks and brand names belong to their respective owners.
6 of 28 adsSign up to see every Getplace.io ad, filter by format and date, and get alerts on new ones.
See all 28 adsQuestions about Getplace.io’s ads
Is Getplace.io running LinkedIn ads?
We recorded no live LinkedIn ads for Getplace.io on 9 Nov 2026.
How many LinkedIn ads has Getplace.io run?
LinkedIn’s ad library lists 28 ads for Getplace.io. We recorded 28 LinkedIn ads for Getplace.io, first recorded on 20 Sept 2026 and last recorded on 27 Oct 2026.
Does Getplace.io run Google ads?
We recorded no Google ads for the domain getplace.io on 30 Oct 2026.
Which ad formats does Getplace.io use?
The 6 LinkedIn ads on this page include 6 image ads.
Watch the companies you care about.
Filter every ad by industry, country, format and network, and get alerts when a company you watch starts running new ads.