Not on air · 1 of 3 networks checked

Bikky ads
- bikky.com
- Technology, Information and Internet
- US
- 58 employees
Bikky’s ads on LinkedIn, Meta and Google, recorded by adsrunning. Browse the latest here for free. Sign up free to see all 49. Watch Bikky on any plan to get each new one in your feed.
Watchlist included in every plan
What Bikky runs
- Single image · LinkedIn
- 6
| Network | Status | Live ads | Nov 2025LinkedIn activity · 52 weeksNov 2026 | Checked | Next step |
|---|---|---|---|---|---|
| None recorded | 0 | Checked 8 Nov 2026 | See all 49 ads → | ||
| Meta | Not checked | — | |||
| Not checked | — |
Bikky has no live LinkedIn ads. We recorded no Google ads on 11 Oct 2026.
Latest ads
- LINKEDIN · IMAGERecorded 10 Sept 2026
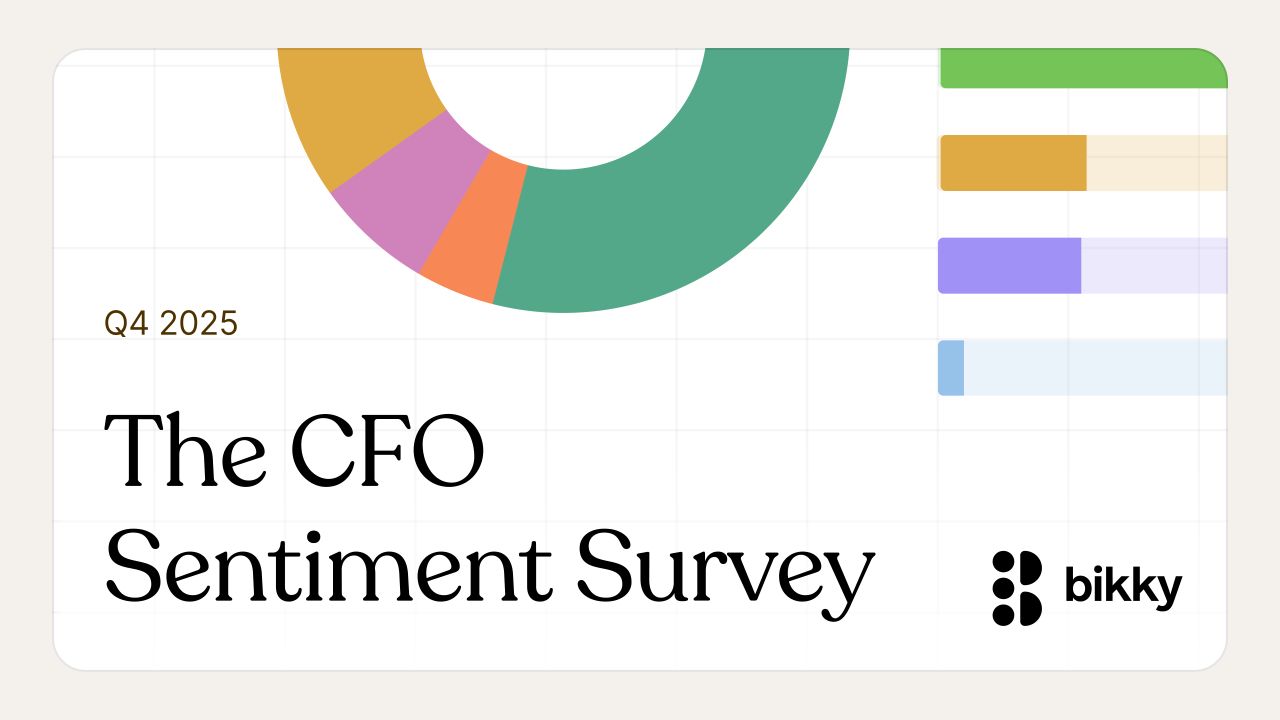
As a holiday stocking stuffer, we're releasing the results of our inaugural CFO sentiment survey. We spoke with nearly 50 CFOs, mostly from emerging brands (>70% are under 100 units, all of them are under 500 units). It was surprising to me how the sentiment for this group of folks is exactly the opposite of the doom and gloom we've heard from large brands. McDonald's, Chipotle, Domino's, and others have all warned about consumer softness heading into the end of the year. They are losing trial, transactions, and frequency across demographics. But these results tell a different story. Overall, over 80% of the finance leaders surveyed believes that traffic will be positive for their brand in 2026. This makes sense. In a world where frequency / repeat trips are declining (as we've outlined in our review of demographic data with other Bikky clients), then first-time visits become the anchor for positive traffic. These smaller brands have significant headroom for growth. With smaller footprints and lower brand penetration, they're still in the phase where most guests entering their funnel are first-timers. Combined with compelling value propositions and the operational excellence (70% expect margins to be the same or better next year), this creates a real opportunity to scale through new customer acquisition. Take a look at the full results at the link below - there's also an interesting tension we noted around the true incrementality of loyalty programs and third-party delivery. In short, marketers believe that loyalty promotions and first-party digital are critical to driving traffic in this environment. But their finance counterparts continue to struggle to understand if these guests would have come anyway, and if they're just now discounting to these folks. Tug of war as old as time. Click here for our full breakdown: https://lnkd.in/eqqgmPSi
- LINKEDIN · IMAGERecorded 10 Sept 2026
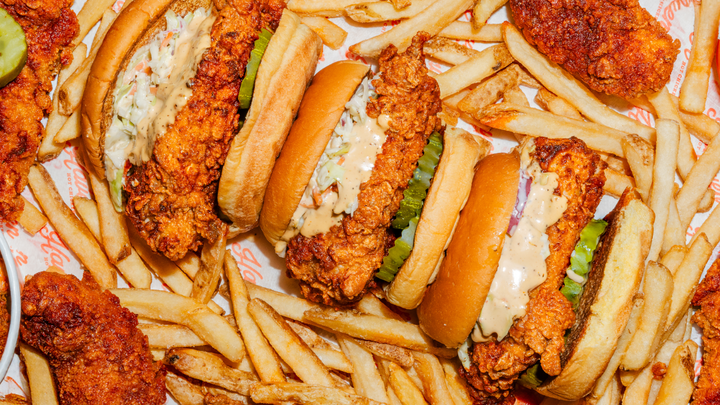
When I think about the restaurant brands I meet that go on to scale, they almost always share one trait: they think and act bigger than they are. That was clear the moment I met the Haven Hot Chicken team in the spring of 2024. Even at just eight locations, Craig Sklar, Jason Sobocinski and Etkin Tekin were focused on building an enduring guest experience while laying the groundwork to bring great hot chicken far beyond New England. Our early conversations were centered on fundamentals: what drives loyalty, what drives profitability, and what drives a guest to come back. And the questions they were asking sounded like a brand ten times their size: • Which ordering channels bring in the highest-value guests? • How does daypart mix impact retention and frequency? • Which menu items increase loyalty versus contribute to churn? • Did each LTO actually drive incremental visits? • How do we re-engage guests showing early signs of churn? • What is a typical return cycle for a HHC guest, and how do we shorten it? Not long after they onboarded Bikky, the data validated the instincts they had when we first met and provided clarity on questions they cared most about: ‣ Launching the "Tendie Duo" shifted 5 percentage points of demand from dinner to lunch, opening up a daypart that had previously been underdeveloped. It gave guests a lighter, faster option and strengthened their overall unit economics. ‣ The Caesar Salad, despite low order volume, was one of their strongest retention drivers, showing that some items play an outsized role in keeping high-value guests loyal even if they are not top sellers. ‣ Guests who visited four or more times in 90 days had dramatically higher lifetime value and lower churn, highlighting how important it is to move guests into this fully onboarded segment rather than simply adding one-time visits. These were not lucky discoveries. They were the natural result of the thoughtful questions Haven was asking from day one. So when the team announced a 25-location franchise deal, including new stores coming to Franklin, Massachusetts and Durham, North Carolina, it did not surprise me. Their decision-making at eight locations already reflected the mindset of a brand preparing for national scale! At Bikky, we are fortunate to support many founder-led teams who operate this way. I am thrilled to watch what comes next for Haven Hot Chicken and have a feeling it involves bringing incredible hot chicken to a community near you!! 🍗 🐔 ---------- Read more about our work together here: https://lnkd.in/eHnVGpYF Read about their franchise growth plans here: https://lnkd.in/eyuC4bsC
- LINKEDIN · IMAGERecorded 10 Sept 2026
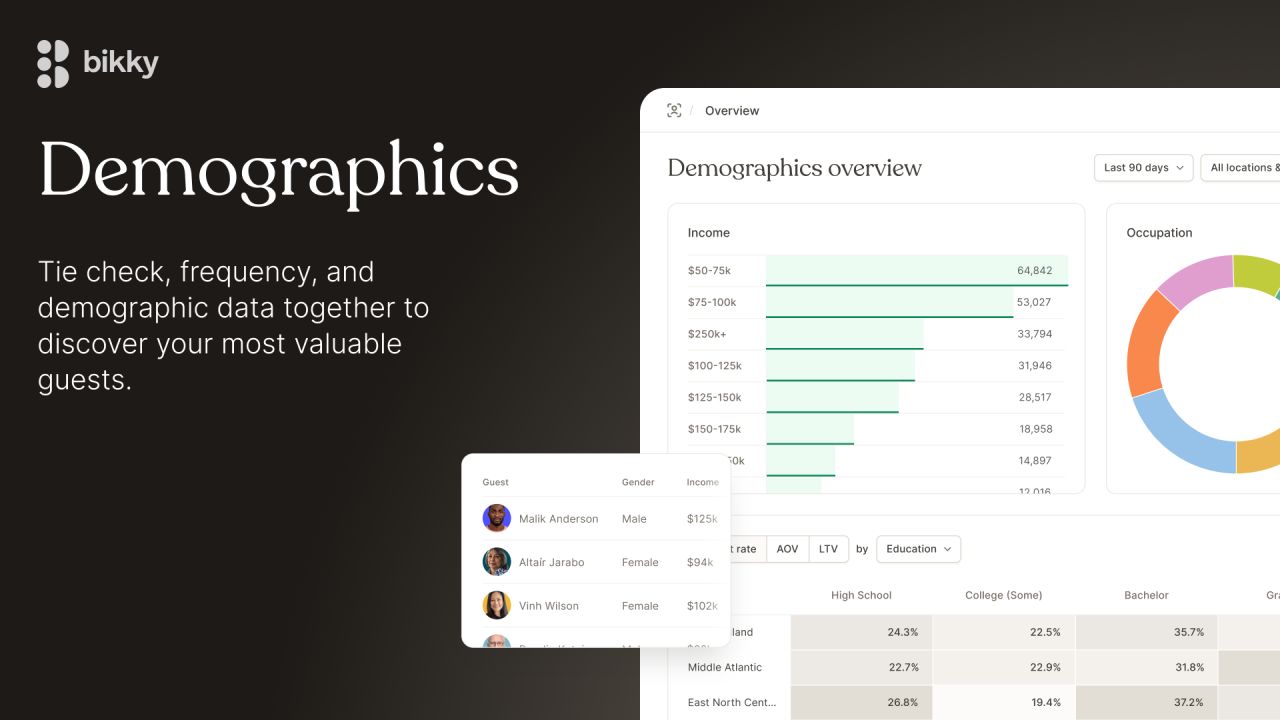
In this challenging environment, getting a deeper understanding of your guests is a material competitive advantage. To that end, we have seen growing interest in a lesser know, but powerful part of our platform: Demographics. It's a topic that comes up on every major restaurant brand earnings call: ➡️ "We are losing share of lower income consumers..." ➡️ "We are gaining transactions across all income cohorts..." ➡️ "We know that Gen Z loves this LTO..." Understanding the guest behind the transaction is a foundational part of their growth model - and yet, most operators typically settle for: 1️⃣ Expensive, time consuming research studies; or 2️⃣ Talking to their managers or sitting in the store and observing who's there at the same time of day as you (note this doesn't work for drive thru heavy concepts or digital guests). These can be fine approaches - if you have the money or time (which usually seem in short supply in this business!), then you may be right to trust your gut or settle for an overview of your "average" guest. But what about your best guests? What about the ones that actually drive your frequency? Do you know how old they are? How much they make? If they're married with kids? Bikky's demographics offering ties together check, frequency, and demographic data to give brands a clear picture into who's driving growth. You can now have all the core metrics you need to succeed in this business - new guest acquisition, retention, frequency, average check, and overall sales - broken out by age, income, marital status, and more. This is obviously a game changer for marketing. We've seen the early standard use cases like making paid ad spend more efficient by understanding *who* you need to target in top of funnel campaigns. We have however seen more novel, advanced use cases that move the needle on traffic in new ways. These include: ➡️ one brand realizing that their guest base skewed more female than expected, so they tested, validated, and scaled an entirely new menu category designed to attract a different audience. ➡️ one brand looking at year over year traffic changes by income cohort to identify their most price sensitive guests, then unlocking higher ROI on promotions by targeting that group specifically. ➡️ one brand looking at top guests by lifetime value, and realigning their location expansion strategy to find markets that demographically overlap with their most valuable guests ➡️ one brand launching a voice AI "agent" who's brand voice / tone is trained entirely on the demographic data 🤯 With this offering all Bikky partners now have the same capabilities as the largest brands in the industry - to understand who drivers their growth, what they buy, and what makes them loyal. You can learn more about our demographics offering at the link below, or DM me. We'd love to see how we can help you find, engage, and serve your best guests. https://lnkd.in/ep-8kQmM
- LINKEDIN · IMAGERecorded 10 Sept 2026
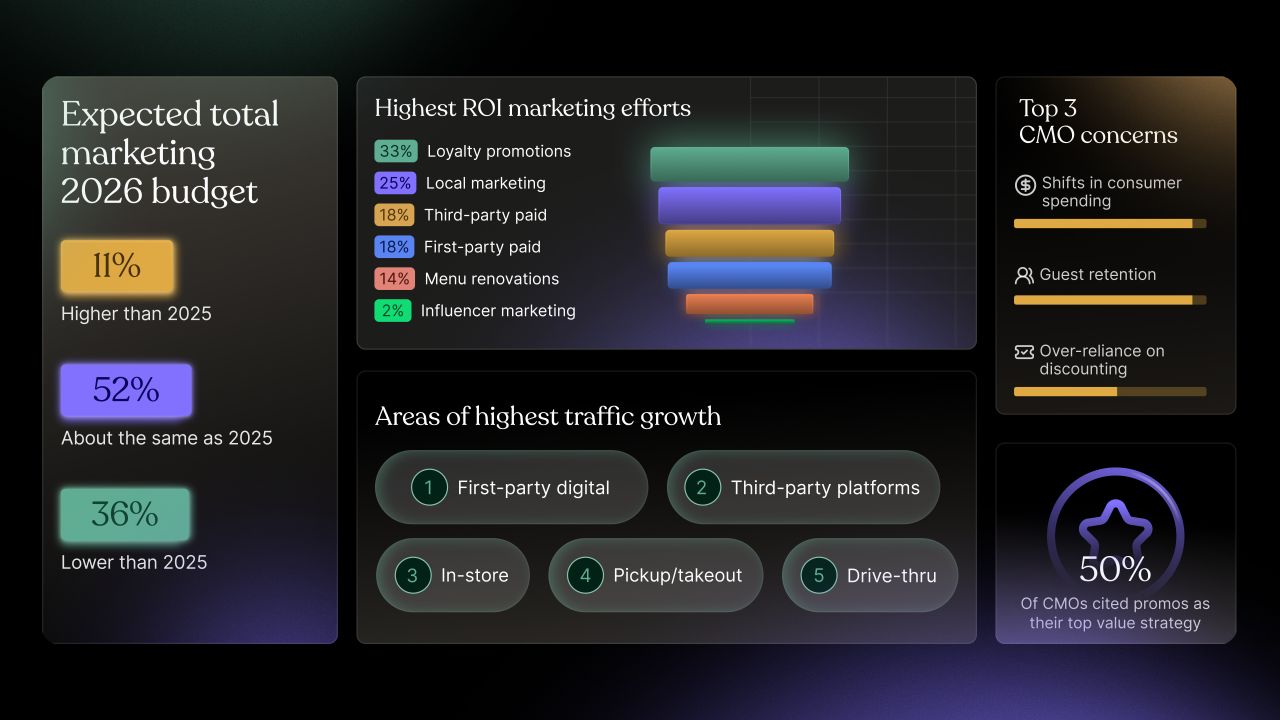
The results from our inaugural CMO Survey are in. Nearly 50 multi-unit restaurant marketing leaders shared what’s driving traffic and ROI in 2025, and what they expect in 2026. High-level takeaways: ➡️ Traffic is mixed. ➡️ Budgets are largely flat. ➡️ Many are worried about further consumer pullback. The biggest surprise: 45% say they’ll invest less in third-party marketplace ads next year. Third-party marketplaces have been (and still are) a reliable growth channel. In our survey, 27% ranked them as their fastest-growing traffic channel, second only to first-party digital (32%). The latter is the first sign that aggressive investments in first-party ecosystems are starting to pay off. Regardless of how consumers order, a good digital experience is the bare minimum they expect. The expected pull-back on third-party ads is interesting though. My hypothesis: Marketplace ads are different than Instagram ads. These apps are utilities, not something we use to cure our boredom. As a utility, the amount of potential inventory / bidding space is comparatively fixed. A consumer is only hungry at certain times in the day, the range of cuisines they want to order is typically limited, and the consideration set is narrowed by the restaurants that are physically close to them (i.e. reasonable delivery estimates). In a tough traffic environment though, brands will look for growth wherever they can. So they doubled-down on the channel that historically delivered that growth. This, combined with marketplaces offering incentives (commission concessions, co-funding) to run higher-margin ads, has led to more dollars chasing that fixed ad inventory. When everyone's putting ad dollars in the same channel at the same time (as Jared Cohen pointed out in a recent post on the wall of promotions when you open a marketplace app), it makes auctions noisier and pressures ROI. Our survey echoes this point as well: third-party ads tied for third on ROI (behind loyalty promotions and local store marketing). Put together, the cycle looks like: chase growth → invest more aggressively → saturation → lower ROI → pullback. I’m still bullish on third-party ads. There’s no reason they can’t be the restaurant industry’s best performance marketing channel. But the next leg might require traditional ad optimization (aggressively testing creative, promotion types/sizes, audiences, and on-platform UX). Brands will need to experiment with the right level of investment, drive greater efficiencies, and may reallocate excess dollars to other fast-growing, high-ROI areas like first-party digital and loyalty promotions. That raises a separate question: how do you avoid becoming overly promotional and hurting your brand? We’ll unpack the worries around that slippery slope in a future post. Until then, you can read the full results here: https://lnkd.in/e6K2k8cj
- LINKEDIN · IMAGERecorded 10 Sept 2026
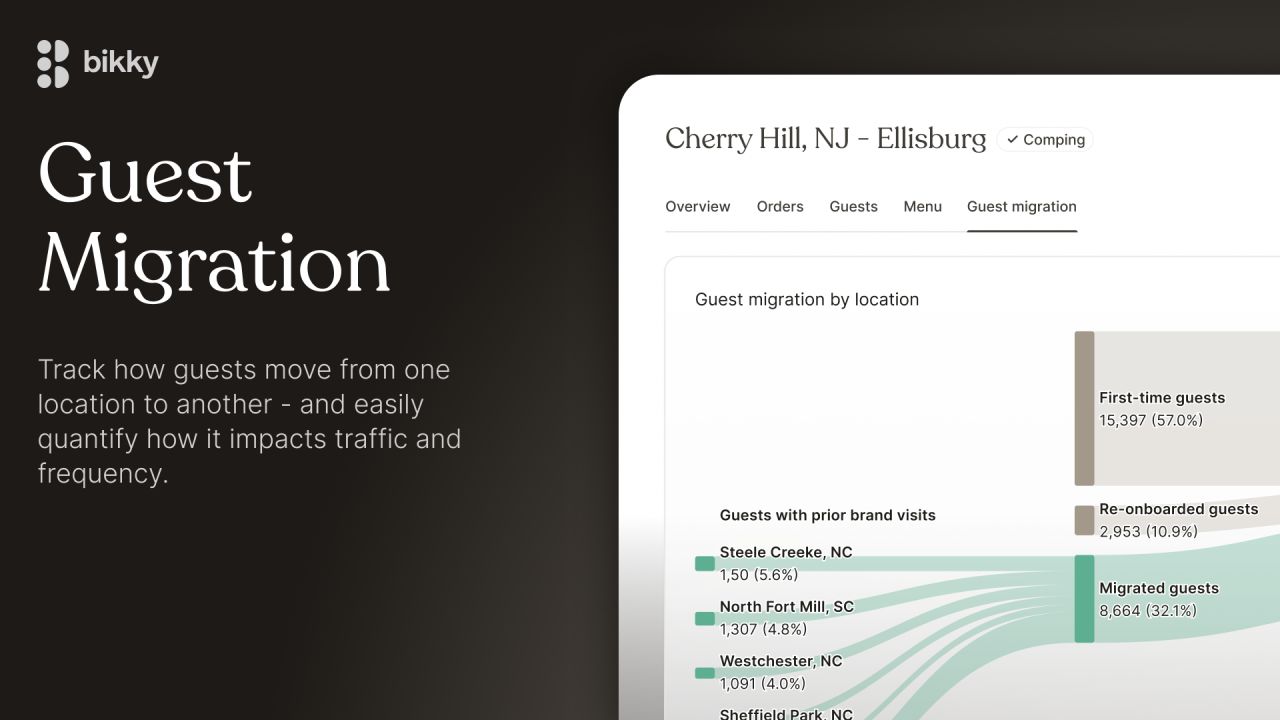
How much do new stores cannibalize existing ones? It's the question every growing brand faces. You want to meet guests where they are, so you expand your footprint, build density, and try to be as accessible as possible. But there's always that nagging doubt: are you truly growing the pie, or just shuffling the same guests around? Today, the industry standard for answering this question is painful: ‣ Wait 6-12 months to see if new stores hit target AUVs ‣ Spend countless hours in spreadsheets trying to track customer movement ‣ Hope your franchisees and operators trust your analysis when you tell them everything's fine Last week we introduced Location Analytics. Buried in that announcement was something I'm particularly proud of: Guest Migration. It transforms months of analysis and debate into three simple answers: 1️⃣ What % of a new location's guests came from other stores 2️⃣ Whether those guests spend more after switching 3️⃣ Exactly which locations are losing guests to the new store In our research, we’ve found that it's normal for 2-8% of guests to switch stores when you open another one nearby. That's not the problem. The problem is when those guests don't increase their frequency, so you’re just moving transactions instead of growing them. The good news? In early release, we saw that migrated guests typically increase their order frequency. One brand saw an additional 1.3 orders per guest after they switched locations. I'm very proud of this feature. It represents the absolute best of what we do at Bikky. Take a seemingly simple, but hard to answer question, do deep research to better understand the operator's perspective, and uniquely solve it in a simple, accessible way through the power of customer data. Guest Migration is live for all Bikky customers. If you're expanding (or planning to) and want to get ahead of the cannibalization question, please reach out. We’d love to learn more about your brand and see where we can help.
- LINKEDIN · IMAGERecorded 10 Sept 2026
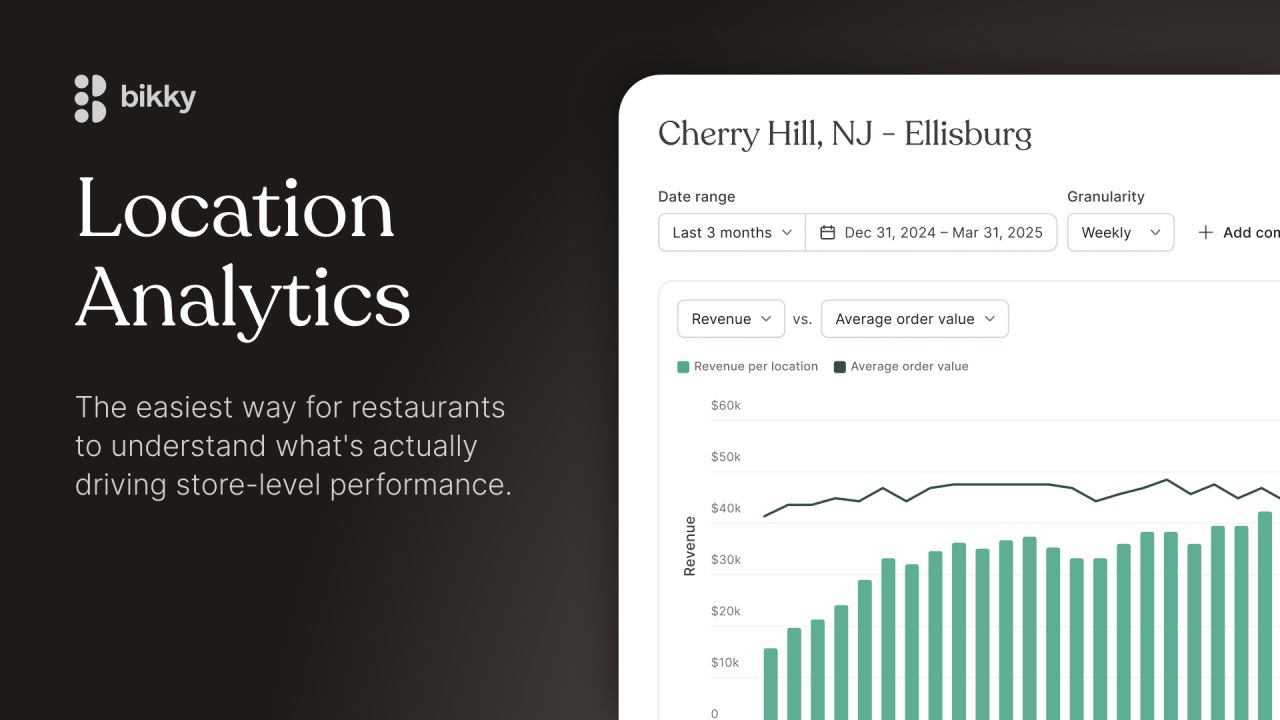
Today we're introducing Location Analytics - the easiest way for restaurants to understand what's actually driving store-level performance. Everyone looks at sales. It's the easiest measuring stick. It goes up, it goes down. But really, it's just the output of everything happening on the ground. Without insight into what's changing under the hood and why, it's hard for marketing, ops, and franchisees to align on what's actually driving those results (let alone what to do about it). With Location Analytics, brands can see the *inputs*. From standard metrics like changes in average check, basket size, transactions, dayparts, and channels, to Bikky-specific insights like traffic patterns across new, frequent, lapsed, and returning guests. For the first time, you can see exactly where you're gaining or losing transactions across the guest lifecycle, at the location level. Here's how we've seen it used in early release: ➡️ One brand struggled to figure out why a specific store underperformed, until Location Analytics showed that their new guest retention was 5 points lower than their best performing stores. ➡️ One brand spent thousands of dollars on a remodel. Location Analytics showed them the exact impact (pre and post) on guest acquisition and frequency, helping them quantify the ROI of a notoriously hard to measure decision. ➡️ One brand built a PR and marketing playbook for new restaurants - timing campaigns to sustain new guest traffic just as the "halo effect" for the new store starts to wear off. Everyone already knows when sales are up or down - or that some locations are stars and some are dogs. The important thing isn't that it's happening, but *why* it's happening. Our Location Analytics finally give corporate, franchisees, and operators that shared understanding. Because at the end of the day, aligned teams make better decisions. And better decisions at the store level compound into better outcomes for the entire brand. If you'd like to learn more about this feature - or Bikky generally - please reach out. We'd love to better understand your brand and where we can help.
6 of 49 adsSign up to see every Bikky ad, filter by format and date, and get alerts on new ones.
See all 49 adsQuestions about Bikky’s ads
Is Bikky running LinkedIn ads?
We recorded no live LinkedIn ads for Bikky on 10 Nov 2026.
How many LinkedIn ads has Bikky run?
LinkedIn’s ad library lists 74 ads for Bikky. We recorded 49 LinkedIn ads for Bikky, first recorded on 10 Sept 2026 and last recorded on 23 Oct 2026.
Which ad formats does Bikky use?
The 6 LinkedIn ads on this page include 6 image ads.
Watch the companies you care about.
Filter every ad by industry, country, format and network, and get alerts when a company you watch starts running new ads.