On air · 1 of 3 networks
DevZero
- devzero.io
- Software (horizontal)
- US
- 26 employees
DevZero’s ads on LinkedIn, Meta and Google, recorded by adsrunning. Browse the latest here for free. Sign up free to see all 68. Watch DevZero with Starter to get each new one in your feed.
Watchlist with Starter · $49/mo
| Network | Status | Live ads | Nov 2025LinkedIn activity · 52 weeksOct 2026 | Checked | Next step |
|---|---|---|---|---|---|
| Running | 46 | Checked 30 Oct 2026 | See all 68 ads → | ||
| Meta | Not checked | — | |||
| None recorded | 0 | No ads found on the Google Ads Transparency Center | Checked 27 Oct 2026 | Collect them with the API → |
DevZero has 46 live LinkedIn ads. We recorded no Google ads on 27 Oct 2026.
Latest ads
- LINKEDIN · IMAGESince 13 Mar 2026
I’ll be at KubeCon + CloudNativeCon Europe 2026 next week. I spend most of my time looking at Kubernetes clusters, and one pattern shows up again and again: workloads are heavily over-provisioned compared to what they actually use. That usually means a lot of idle compute. We can show you how we’re helping teams reduce Kubernetes costs by around 30% and help you do the same, or we pay €10k.* If you’re interested in how teams are actually fixing this in production environments, feel free to book some time: https://lnkd.in/eQ-VMSis Always enjoy talking with other infra teams at KubeCon. *Conditions apply.
- LINKEDIN · IMAGESince 23 Feb 2026
You shouldn’t have to choose between safe overprovisioning and surprise cloud bills. DevZero plugs into your Kubernetes cluster and shows exactly where CPU, memory, and GPUs are underutilized. Then it continuously rightsizes workloads based on real usage, without downtime or manual babysitting. You keep shipping. Your apps stay fast. Your cluster stops wasting resources in the background.
- LINKEDIN · IMAGESince 23 Feb 2026
Kubernetes doesn’t need another dashboard. It needs action. DevZero gives you always-on optimization across CPU, memory, and GPUs, with real-time visibility into what your workloads actually use. It continuously rightsizes and consolidates without downtime or manual tuning. Less ops tax. More efficient clusters. Performance stays intact while waste gets eliminated in the background.
- LINKEDIN · IMAGESince 17 Feb 2026
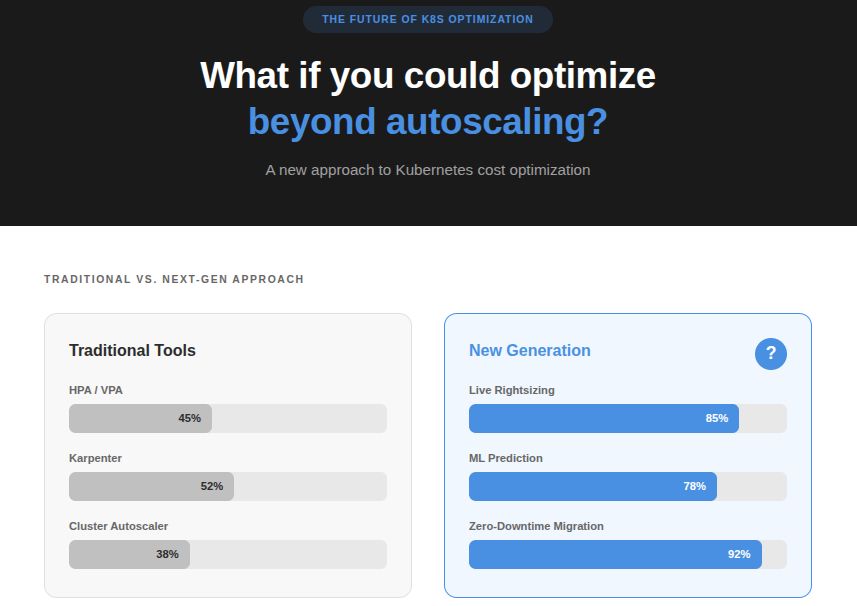
73% of your Kubernetes budget is paying for resources you'll never use. Here's why: Kubernetes forces you to declare resource requests BEFORE your pods run. CPU: "I might need 2 cores" Memory: "I might need 8GB" Keyword: MIGHT. So you overprovision. Because underprovisioning = OOM or CPU throttling. The result? Every pod runs with a "safety buffer." And that buffer costs you 6 figures. Let me show you the math: Average K8s cluster resource utilization: 27% For a $200K/month K8s bill: → $146K is waste → $54K is actual usage "Just use autoscalers": you're thinking HPA scales replicas. VPA restarts pods to adjust resources. Cluster autoscaler adds nodes. But here's what they DON'T do: Adjust resources on RUNNING pods without restarts. Every pod restart = 30-180 seconds of: → Lost cache → Dropped connections → Cold starts → Degraded performance For AI/ML workloads, that means model weights reloading, inference queues backing up, and angry customers. The industry has accepted this as "normal." It's not. There's a better architecture: Live rightsizing. Instead of guessing what pods need upfront...Learn what they ACTUALLY use over time. Instead of restarting pods to adjust resources... Resize the pods in-place. Instead of reactive scaling...Use ML to predict resource needs 6 hours ahead. The technology exists: - CRIU (Checkpoint/Restore) for zero-downtime migration - In-place resource modification without pod restarts - XGBoost models that predict usage patterns Most teams don't know this is possible. They're stuck in the "set requests/limits and pray" paradigm, paying the 73% tax. Here's what changes when you stop overpaying: Real example - 180-node EKS cluster: → Before: $340K/month, 31% utilization → After: $118K/month, 76% utilization → Savings: $222K/month ($2.66M annually) Same workloads. Same performance. Zero downtime. Kubernetes doesn't have a cost problem. It has a utilization problem. And utilization is solvable. This is what DevZero enabled us to do. The shift from reactive to predictive optimization changed everything. Try out DevZero yourself: https://lnkd.in/dGW4hv_T
- LINKEDIN · IMAGESince 9 Oct 2025
I’m hosting a workshop with Mubeen Syed (NVIDIA) to dig into why most GPU and CPU clusters are run at just 15-25% utilization. We’ll show you how to measure what’s actually being used, uncover why utilization lags, and implement fixes that boost performance while cutting waste. Bring your questions and join us here: https://hubs.la/Q03MqNgn0
- LINKEDIN · IMAGESince 26 Sept 2025
“We’re processing 40% more data streams than last quarter, but our GPU costs went up 180%. Our cost-per-alert has nearly doubled.” An engineering leader at a real-time AI monitoring platform company told me that last week. That's the kind of red flag I can’t ignore. When infrastructure spend grows faster than actual workload, you've got an efficiency problem. We dug into their Kubernetes cluster together. The numbers told the story... On paper: 96 A100 GPUs fully allocated across 3 availability zones In reality: - Average GPU utilization: 23% - 12 model replicas handling real-time social media ingestion - 31 replicas sitting idle, allocated for "peak traffic" that happens 2 hours per day - Memory requests set to 32GB per pod when most workloads used <8GB - Zero visibility into which models were actually processing events vs. sitting empty 𝘊𝘭𝘢𝘴𝘴𝘪𝘤 𝘰𝘷𝘦𝘳-𝘱𝘳𝘰𝘷𝘪𝘴𝘪𝘰𝘯𝘪𝘯𝘨 𝘥𝘳𝘪𝘷𝘦𝘯 𝘣𝘺 𝘧𝘦𝘢𝘳. The team had been burned by an outage during a major news event, so they allocated worst-case resources everywhere. When we implemented DCGM telemetry with proper Grafana dashboards, the waste became impossible to ignore: - 47 GPU replicas hadn't processed a single inference request in 72 hours - Memory utilization averaged 12% across active pods - Queue depths showed most models could handle 3x current load After right-sizing: - Reduced active replicas from 43 to 28 during normal hours - Implemented HPA scaling for the 2-hour daily peaks - Result: 34% cost reduction while maintaining sub-200ms p99 latency The real win? Cost-per-processed-event dropped 40% while actually improving reliability through better resource allocation. If you're running real-time AI workloads on K8s, you're probably seeing similar waste patterns. The economics don't work unless you can see what's actually happening under the hood. Join me and Mubeen Syed from NVIDIA for a practical workshop on measuring and eliminating GPU waste in production ML systems. 👉 Save your spot here: https://hubs.ly/Q03KzxB50



6 of 68 adsSign up to see every DevZero ad, filter by format and date, and get alerts on new ones.
See all 68 adsWatch the companies you care about.
Filter every ad by industry, country, format and network, and get alerts when a company you watch starts running new ads.