On air · 1 of 3 networks
Holistics Data
- holistics.io
- Data
- SG
- 67 employees
Holistics Data’s ads on LinkedIn, Meta and Google, recorded by adsrunning. Browse the latest here for free. Sign up free to see all 57. Watch Holistics Data with Starter to get each new one in your feed.
Watchlist with Starter · $49/mo
| Network | Status | Live ads | Nov 2025LinkedIn activity · 52 weeksOct 2026 | Checked | Next step |
|---|---|---|---|---|---|
| Running | 5 | Checked 29 Oct 2026 | See all 57 ads → | ||
| Meta | None recorded | 0 | No active ads recorded on the Meta Ad Library | Checked 21 Oct 2026 | Collect them with the API → |
| Not checked | — |
Holistics Data has 5 live LinkedIn ads. Its Facebook page had no active ads on 21 Oct 2026.
Latest ads
- LINKEDIN · IMAGESince 21 Sept 2026
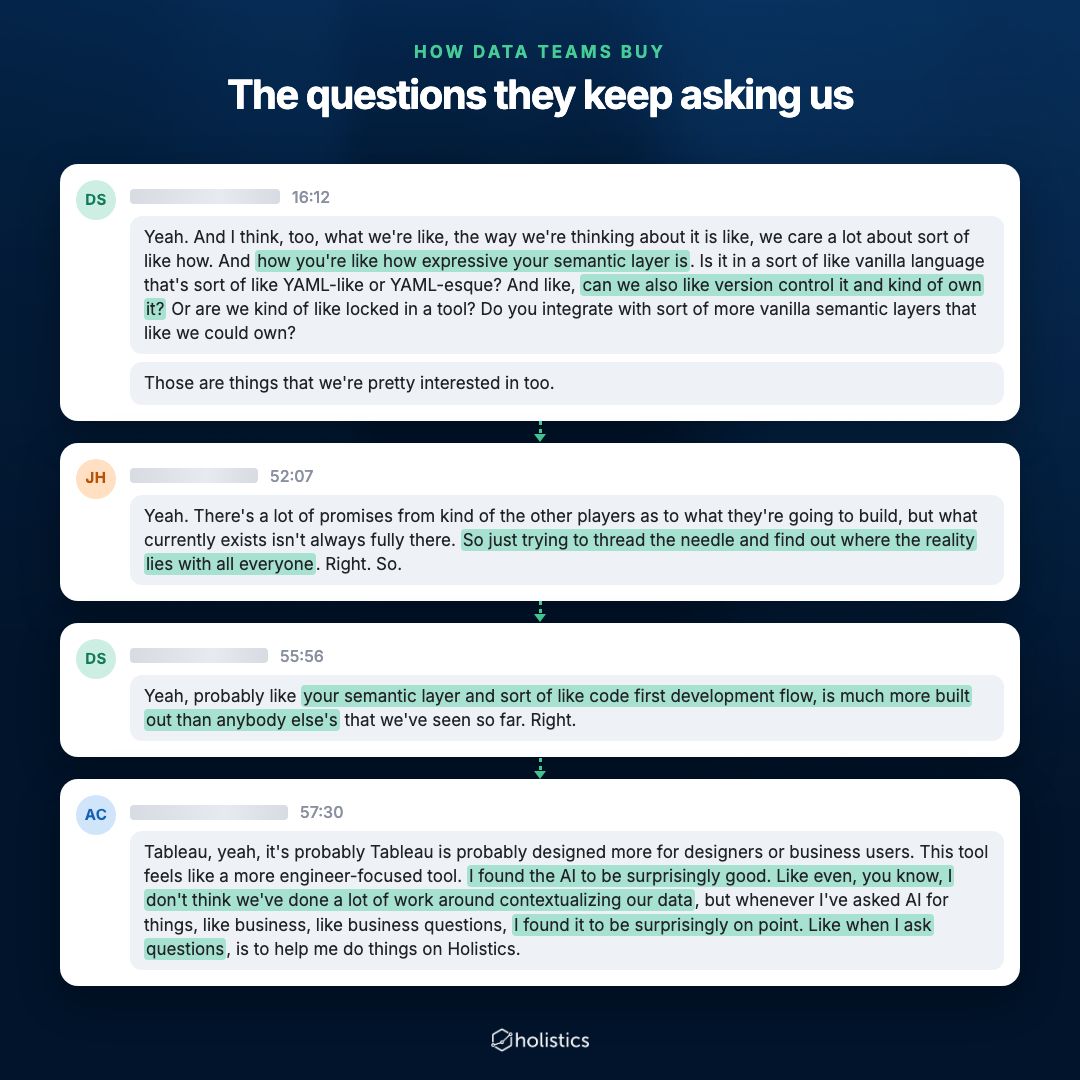
(This is how data teams are buying BI tools: see the screenshots) Half the data teams we spoke with over the last three weeks asked about the same set of questions. The wording varies, but it's always some version of: 1/ Do you have a semantic layer? 2/ How expressive is your semantic layer? 3/ Do you have a code-first development flow? And in most cases, our answer is the same: Yes. Let me show you. Yes. And they're skeptical of that answer, as any good data practitioner should be. They know all too well how B2B vendors over-promise and under-deliver. They know how easy it is to bolt a natural language interface onto legacy BI and call it AI analytics. Stuck between hearing the same AI pitch for the hundredth time and fielding the hundredth Slack DM asking for a quick metric pull, they've gotten good at filtering out options fast. So they ask us what they need to ask. They ask about the semantic layer to ground AI in shared metric definitions. They ask about a code-based development flow so they can govern and version-control it, the way they would in software engineering. And they ask about expressiveness because they want one that can also handle the harder questions, like nested aggregation or period-over-period analysis, when most semantic layers handle the OLAP basics (lookup, slice-and-dice, filter/group, top-N). They already know that if the layer can't express a question natively, AI either falls back to raw SQL (bringing back hallucination risk) or just returns nothing. They ask what they need to ask. And these are good, important questions, because without them, they'd never find and try out Holistics, and they'd never tell us what they told us: "Holistics AI is surprisingly good, even when we hadn't done much work contextualizing our data." -- P.S. Like any good data practitioner, you should be skeptical of this post too. But if you want to see how we win over even the biggest skeptics, book a demo with us.
- LINKEDIN · IMAGESince 21 Sept 2026
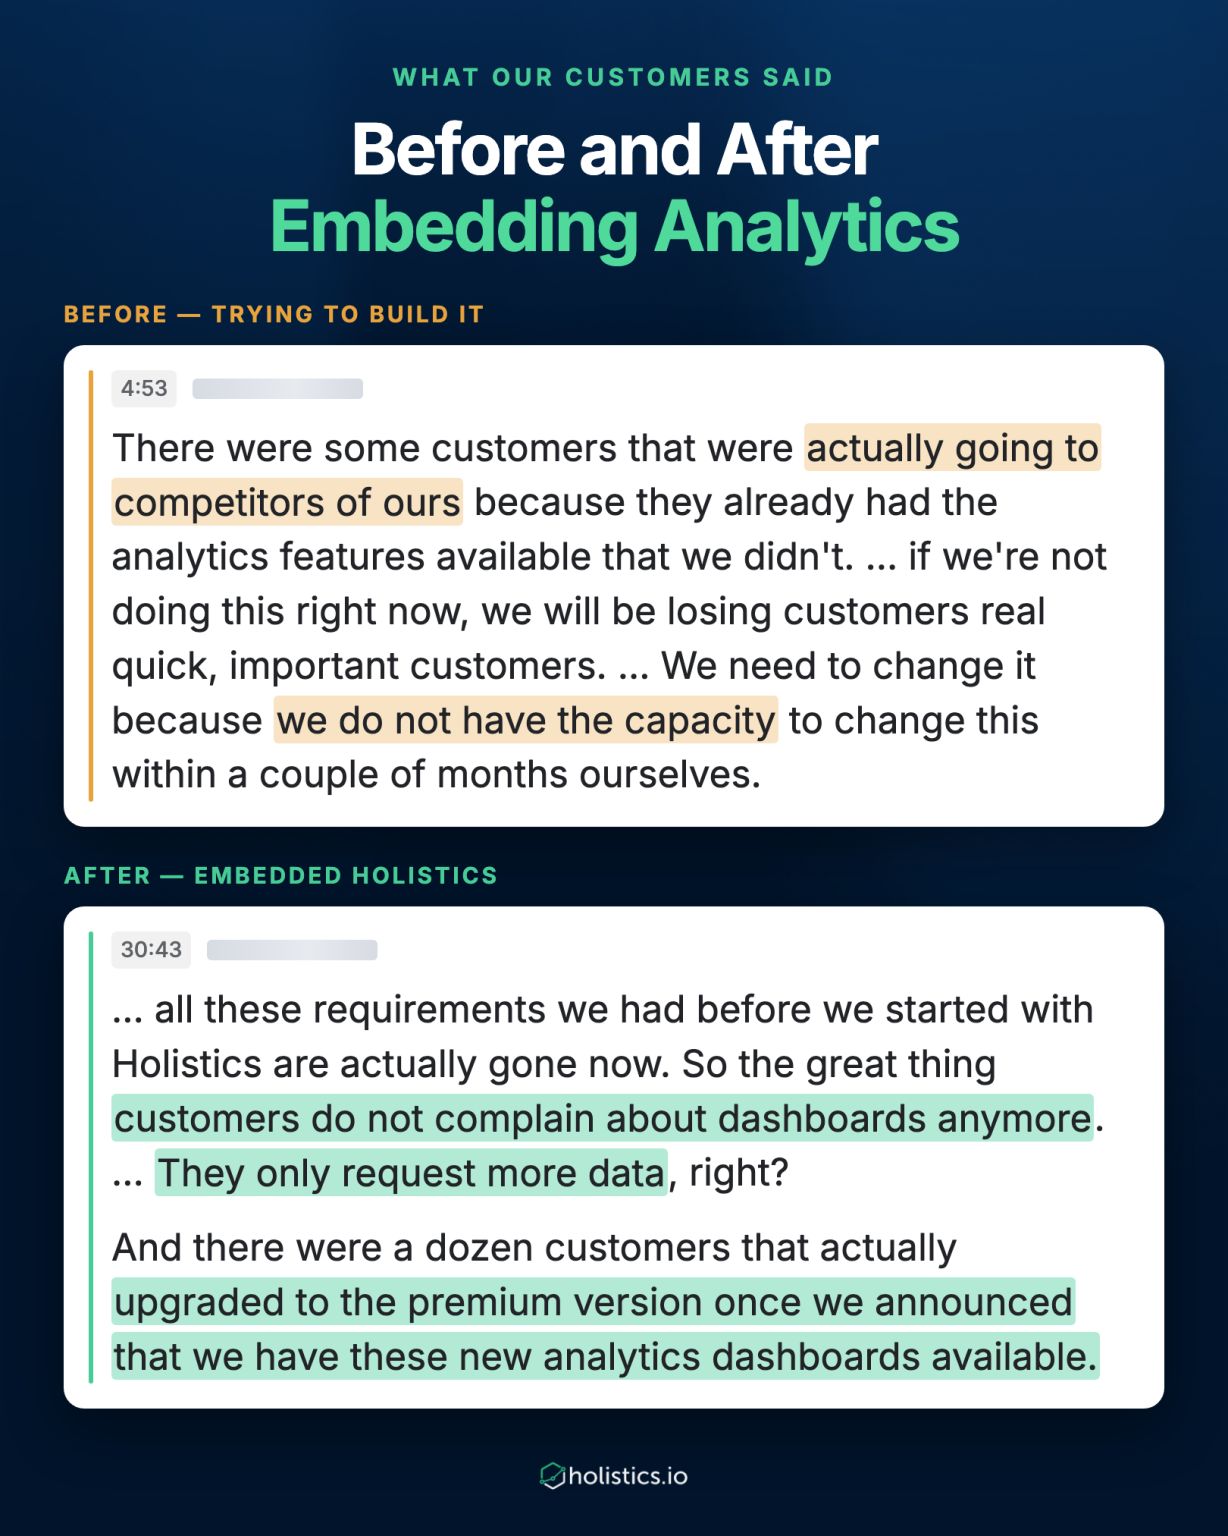
Doing nothing costs money, but spending money makes more money. Such is the paradox of in-app analytics. But that's only the first paradox. There are two, and both show up for just about every product engineering team that starts looking into an in-app analytics module. If you work in B2B SaaS and your customers ask for dashboards, you know the first one well, and you're almost certainly living the second. The plot is as predictable as Campbell's hero's journey: 1/ You're a small team building B2B SaaS. Fewer than 100 people, serving, let's say, around 1,500 customers, SMBs and enterprises both. 2/ Your Customer Success team starts getting the same kind of request over and over: data. At first you point them to the export button. 3/ Then they ask whether they can slice and dice it. Filter the numbers down to one product, compare them across time periods. 4/ Now Customer Success is buried in data requests they aren't equipped to handle. They take it to product engineering, who have their own fires to put out. 5/ Product weighs buy against build and, like any proud product engineering team, decides it can't be that hard to build. 6/ It turns out it isn't too hard, but it just takes A LOT of time to get it right (not looking like a random dashboard bolted onto your UI, row-level permissions, cross-filter and drills), time you could have spent on the core features of your product. 7/ So it drags on, neither here nor there. You ship a half-baked analytics module while the rest of your roadmap gathers cobwebs, and customers start threatening to leave for your competitors. The money is on the table, and it should have been collected much much sooner. 8/ Customer Success, meanwhile, is stuck between two teams: passing analytics requests to product, and still bugging engineering or the data team for one-off dashboards. Which leads us to the second paradox. It's this: if you want to know how well your in-app analytics is performing, you don't just ask product or data. You ask Customer Success too. Because when the analytics is doing its job, a whole category of message goes missing: the feature requests, the "can you pull this for me" asks, the support threads that used to stack up high. They're simply gone. What replaces them is a far easier ask, and a better one: “more data, please”. And, “Where do I upgrade to the premium plan with the analytics?” That's how it went for our customers. It can go that way for you too, with Holistics.
- LINKEDIN · VIDEOSince 21 Sept 2026
The best analyst you've ever worked with was probably a little annoying. You'd ask for a number. They'd ask you five questions back. "What are you actually trying to decide?" "Are you comparing to the forecast or last year?" "Do returns count?" They’d say. You'd sit there, thinking "I just want the number, why do you ask so many unnecessary questions", until realize you were about to decide on the wrong one. This is what separates a good analyst from a great one: they ask, a lot. They always challenge the question before answering it. They want full context, and they are as invested in solving your problem as you, even you don't even see what exactly the problem is yet. It's also exactly what most AI skips. You type a prompt, you get a chart. It’s fast, but it’s often slightly off from what you actually need. Nobody pauses to ask. ✨ Holistics AI now pauses to ask. Before running the analysis, our AI checks your intent with clarifying questions. "By region or by product?" "Including returns?" "Compared to forecast or last year?" After it generates results, it suggests what to investigate next. We know that AI can't fully replace the judgment of a great analyst. But it can learn the most important part of the job: asking before answering.
- LINKEDIN · VIDEOSince 21 Sept 2026
Your number is down. Should you be worried? If you can't tell, that's a problem. When you can't separate signal from noise, you either waste time chasing something irrelevant or miss something going badly wrong. And you don't want to bother your analysts every time; what if they do all that work only to find it was normal variance all along? Now you can do it yourself, with the help of Holistics AI: find out whether a change is worth worrying about, and what actually drove it. Simply right-click any data point that looks off, choose Analyze increase or Analyze decrease, and Holistics AI runs a two-step investigation for you: 1/ Triage first: The Anomaly Detection skill checks the historical data to decide whether the move actually matters or is just statistical noise. 2/ Then explain: The Contribution Analysis skill breaks down exactly which dimensions and segments drove the change, and by how much. Analyze Changes is the first release under Smart Analysis, our step toward BI that investigates with you, not just something you look at. Soon, you'll ask one question - "how's revenue been lately?" and Holistics AI will run the whole investigation itself: a trend read, an anomaly check, an attribution breakdown, each output feeding the next, then tell you what's actually worth digging into. If you're interested in trying it out, drop us a message! :) #agenticBI #businessintelligence
- LINKEDIN · VIDEOSince 21 Sept 2026
"I find your AI to be surprisingly accurate". A customer told us this a while back, and it's a compliment we've had mixed feelings about ever since. The "accurate" part we're glad to hear. An AI chatbot that isn't accurate doesn't have much reason to exist. That’s its entire job. But why the surprise? Is it because the gap between what data vendors promise and what they actually deliver has grown to the size of a sinkhole - big enough that an AI simply not making things up now counts as a pleasant surprise rather than the baseline? Or is it that we haven't done a good enough job marketing our AI? The former is collectively an industry problem, and not much we can do about it on our own. The latter, though, we can control. So here's something you might not know our AI can do: EVERYTHING, actually. In this 3-minute video, our product manager shows how he used our latest feature, Local Agentic Development, which lets you bring the coding agents you already know - in this case, Claude Code - and pair them with Holistics through MCP to go from raw schema to a fully functional, well-governed dashboard in just a few minutes. Have a look. And if you already use Holistics, give it a try.
- LINKEDIN · VIDEOSince 21 Sept 2026
Dashboards are unfortunate creatures. Nobody wants them to be what they are. Executives wish they were self-updating slide decks. Instead of charts in a boring grid, they wish for dazzling visuals, a big header, one metric per tab, while still seeing the applied filters and changing them on the fly. Marketing wishes it were a story. Instead of rows of numbers, they wish for a narrative so convincing that everyone nods along to whatever wild idea comes next, and agrees that the metrics colored in red are probably the market's fault. Revenue wishes it were a crystal ball, handing out predictions and projections built on historical CPL, CAC, and whatever else it can get its hands on. They all wish the dashboard could be more. But most of the time a dashboard is the place to look at, not the place to act on. Now it can be more. Our new HTML Layout frees you from the fixed canvas. You can just use HTML and CSS to build highly tailored data experiences - storytelling slides, print-perfect reports, or even data game. This update also makes Holistics much more vibe-coding-friendly: the output is now plain HTML, a language AI already writes fluently, rather than a proprietary layout format. Soon you'll be able to just describe the data experience you want and Holistics AI will build it for you.
6 of 57 adsSign up to see every Holistics Data ad, filter by format and date, and get alerts on new ones.
See all 57 adsWatch the companies you care about.
Filter every ad by industry, country, format and network, and get alerts when a company you watch starts running new ads.