On air · 2 of 3 networks
Fairing
- fairing.co
- Marketing & Advertising
- US
- 19 employees
Fairing’s ads on LinkedIn, Meta and Google, recorded by adsrunning. Browse the latest here for free. Sign up free to see all 38. Watch Fairing with Starter to get each new one in your feed.
Watchlist with Starter · $49/mo
| Network | Status | Live ads | Nov 2025LinkedIn activity · 52 weeksOct 2026 | Checked | Next step |
|---|---|---|---|---|---|
| Running | 38 | Checked 30 Oct 2026 | See all 38 ads → | ||
| Meta | Not checked | — | |||
| Running | 5 | Ads on the Google Ads Transparency Center | Checked 29 Oct 2026 | Collect them with the API → |
Fairing has 38 live LinkedIn ads. We recorded 5 Google ads on 29 Oct 2026.
Latest ads
- LINKEDIN · IMAGERecorded 18 Sept 2026
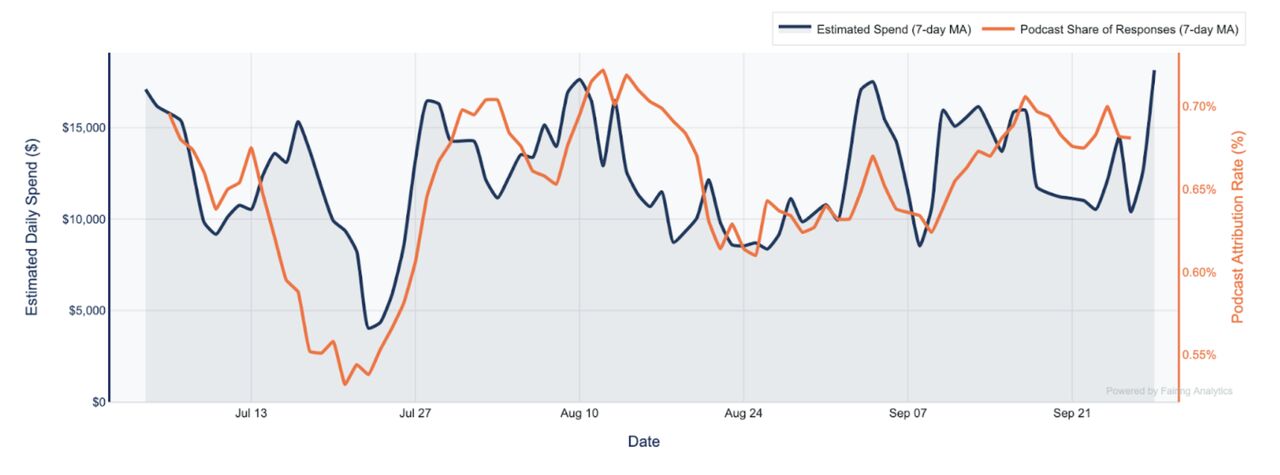
You can’t run incrementality tests on every channel, and host-read podcasts are one of them. So how do you prove they work? This is where post-purchase survey (PPS) signals come in. When you measure impact through PPS, you uncover clarity dashboards can only dream of. Take this example 👇 As podcast ad spend rises, so does the share of customers saying they heard about us from podcasts. That near-perfect sync, shown here as 7-day moving averages, proves two things: 🎯 Post-purchase surveys work. They capture real signal from podcast campaigns — not noise. 🎙️ Podcast ads drive measurable impact. Traditional analytics miss upper-funnel influence, but PPS surfaces it directly from customers. If iOS14 made your attribution murky or your dashboards leave you guessing, here’s your reminder: just ask your customers. It’s not just a pretty correlation, it’s confidence you can act on.
- LINKEDIN · IMAGERecorded 18 Sept 2026
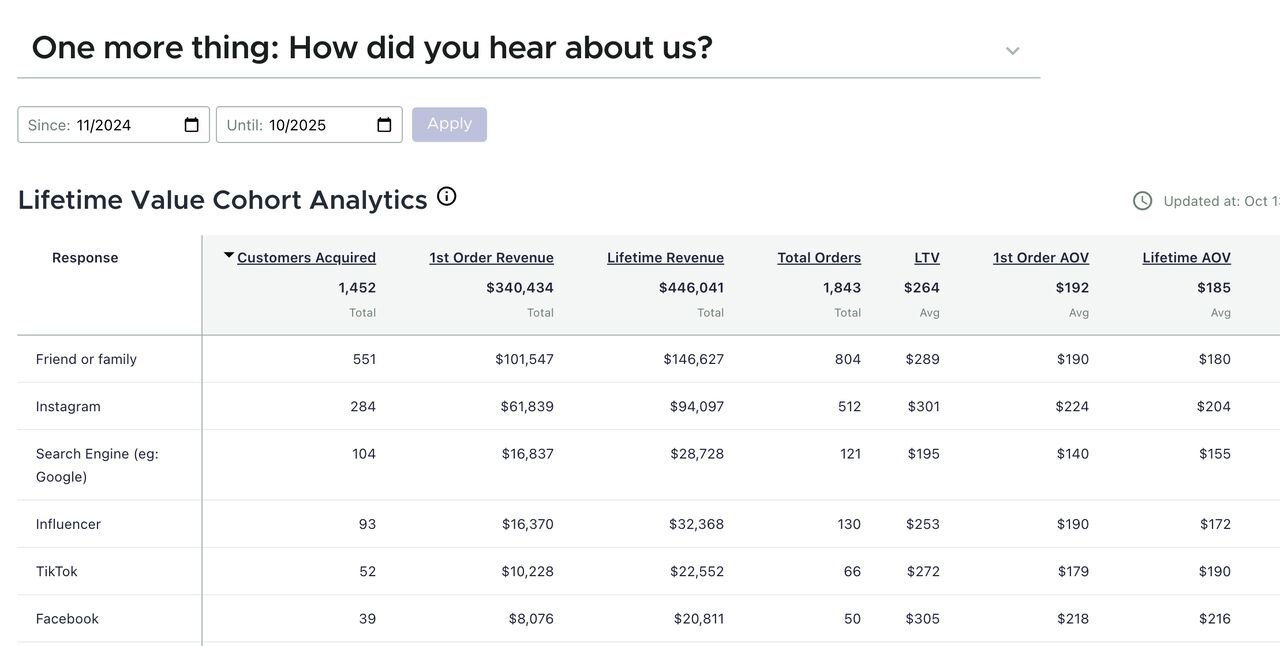
🎁 Holiday campaigns drive volume, but which channels bring customers back? Quick Fairing pro tip 👇 1️⃣ Enable LTV Analytics (included in every plan, Shopify-only) 2️⃣ Set your range: Nov–Dec 2024 → Present 3️⃣ Compare 1st order revenue vs. lifetime revenue & LTV You’ll instantly see which channels from last year drove long-term value, not just a holiday spike. If you’re pushing ROAS this season thinking you’ll “make it up later,” check last year’s data first. Your LTV report might tell a different story.
- LINKEDIN · IMAGERecorded 18 Sept 2026
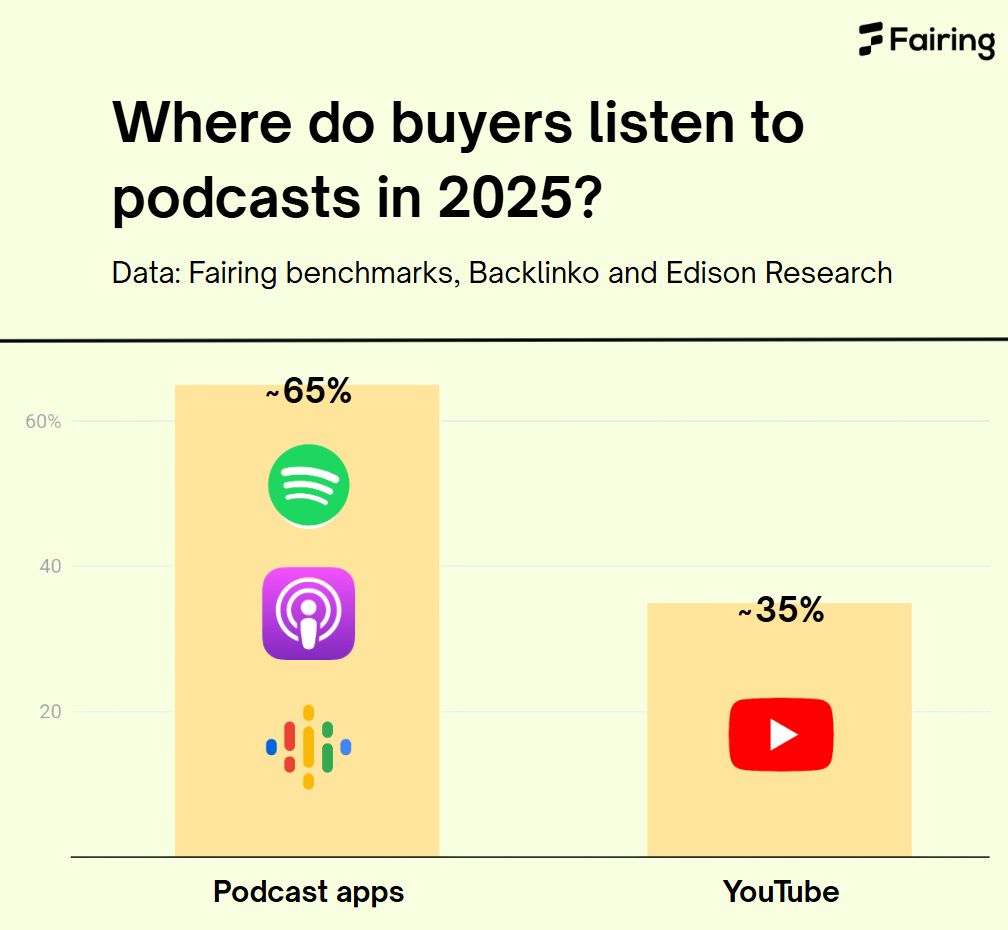
🎧 Where do your customers listen to podcasts? We spent 3 hrs digging into the data and here's what we found: If your first thought is "podcast apps," you're only seeing part of the picture. While most listeners still use traditional apps, YouTube has become a podcasting giant too big to ignore. Our own benchmark analysis shows that while podcast apps account for ~65% of listeners, a massive ~35% are using YouTube. And this isn't an isolated trend. The latest industry data backs this up: → Backlinko reports that 39% of weekly U.S. podcast consumers use YouTube the most. → Edison Research found that 31% of weekly listeners name YouTube as their primary podcast service. The mix can swing widely by show, but the message is clear: a huge chunk of your audience is consuming podcast content on a video platform. Action item: If you run post-purchase surveys (like a "How Did You Hear About Us?"), split "Podcast" and "YouTube" into two distinct options. After the user selects an answer, add a "Which show?" auto-suggest follow-up question to capture the specific podcast driving discovery. If you don't, you will misattribute your marketing efforts and miscalculate your channel ROI. Your audience is everywhere. Your survey should be too.
- LINKEDIN · IMAGERecorded 18 Sept 2026
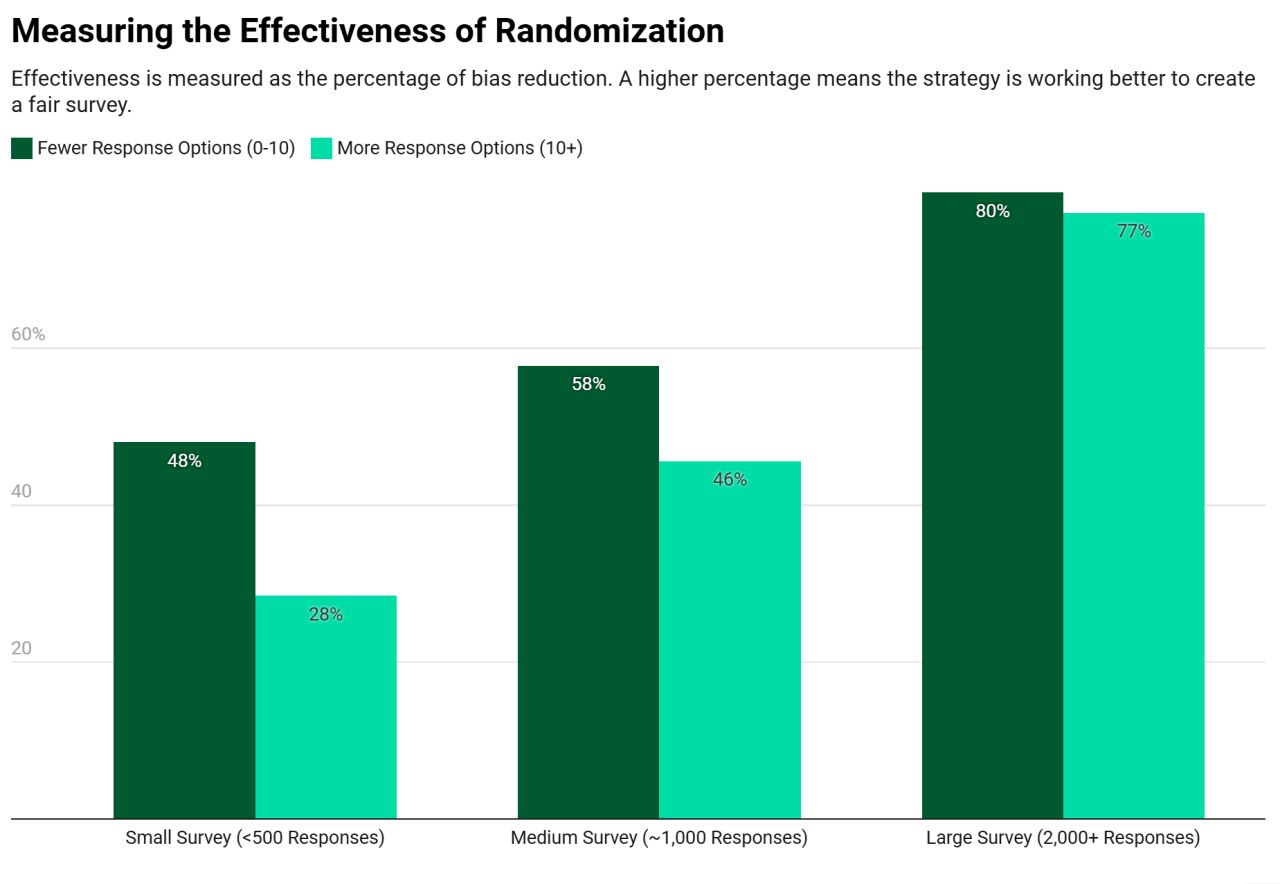
Randomizing survey answers is overrated. It sounds more "scientific" but it might actually make your data worse. 🤯 🤯 🤯 Most marketers and researchers randomize answer options to reduce bias, especially on mobile. The assumption: if everyone sees a different order, no single option will consistently benefit from being at the top. In theory, that makes sense. But in practice? It only works if you have enough responses to spread the bias around. We ran a Monte Carlo simulation to test this and here's what we found: - Under 200 respondents: Randomization is mostly useless. The bias doesn’t “cancel out”, it just moves around. You may even hurt data quality - 500–1,000 respondents: Now there’s some benefit. Randomization starts to balance out positional effects, but it’s still moderate. 2,000+ respondents: This is the sweet spot. At this scale, randomization becomes genuinely effective for reducing bias and improving result accuracy. TAKEAWAY Don’t assume that checking the “randomize” box is a free win. If your sample is small, you're better off refining your question design like shortening option lists, or ordering by relevance than relying on a statistical fix that hasn’t kicked in yet. Data quality is a system, not a checkbox.
- LINKEDIN · IMAGERecorded 18 Sept 2026
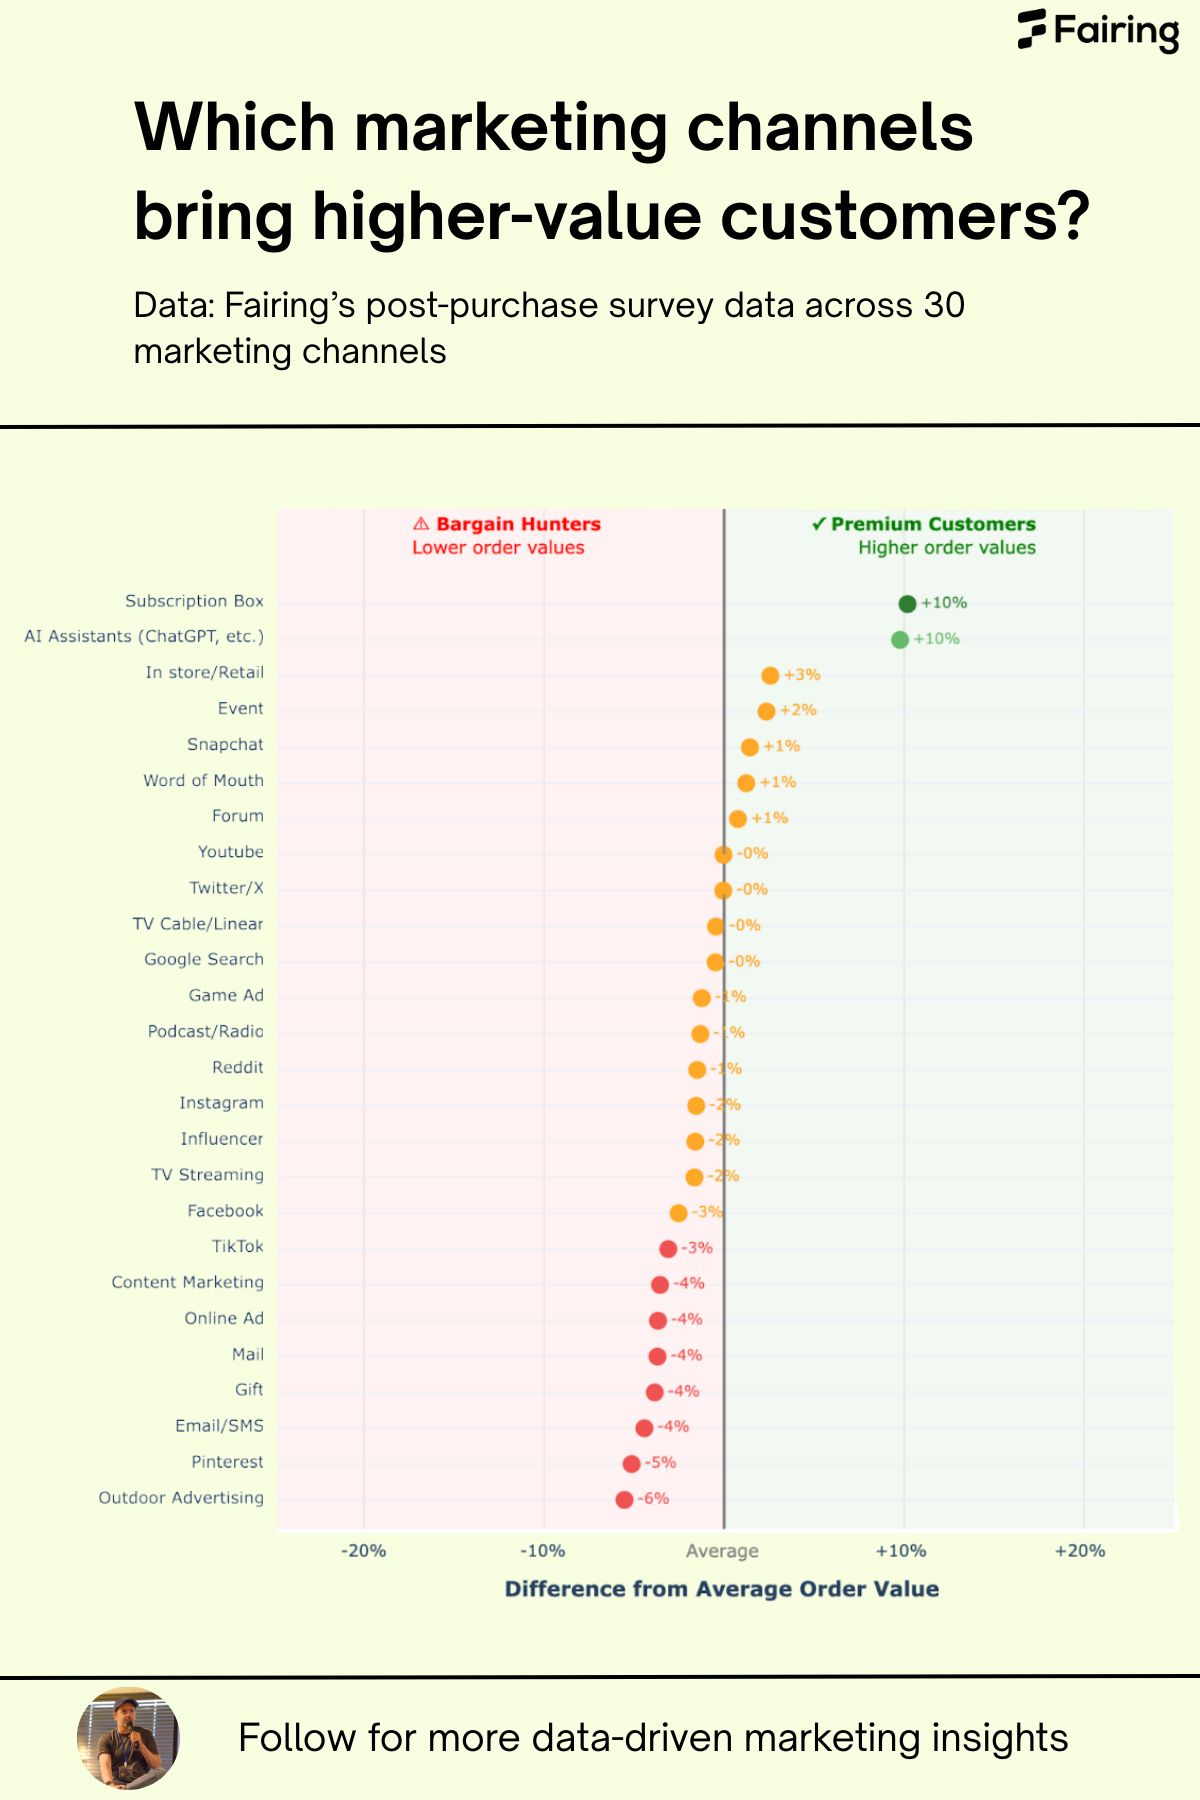
Not all customer acquisition channels are created equal. Marketers often obsess over conversion rates and CAC, but what about AOV?? Using Fairing's post-purchase survey data, we analyzed 30 marketing channels to see which ones attract customers who spend more. Here are the results: ✅ Premium customer channels: - AI Assistants (ChatGPT, etc.): +10% Higher AOV - Subscription Boxes: +10% Higher AOV (is this surprising to anyone else?) 🟡 The baseline: - Word of Mouth, Google Search, TV, and Radio all hover right around the average. They are reliable, but not bringing in premium spenders. 🔻 The "Bargain Hunters" channels: - Facebook & TikTok: -3% Lower AOV - Email/SMS: -4% Lower AOV - Pinterest & Outdoor Ads: -5% to -6% Lower AOV TLDR: Some of your highest-volume channels (like popular social media platforms) might be attracting lower-value first-time buyers. Meanwhile, niche or high-intent channels are quietly delivering more profitable customers. TAKEAWAY → Don't treat all conversions equally: A 10% higher AOV can have a massive impact on your margins and LTV. → Rethink your budget allocation: Your most "efficient" channel by CAC might not be your most profitable. The real magic happens when you look at both the quantity and quality of your customers. The difference between a –4% and a +10% AOV channel might look small on paper, but at scale it’s the difference between breaking even and building a profit engine. P.S. Are you seeing similar results in your marketing channels?
- LINKEDIN · IMAGERecorded 18 Sept 2026
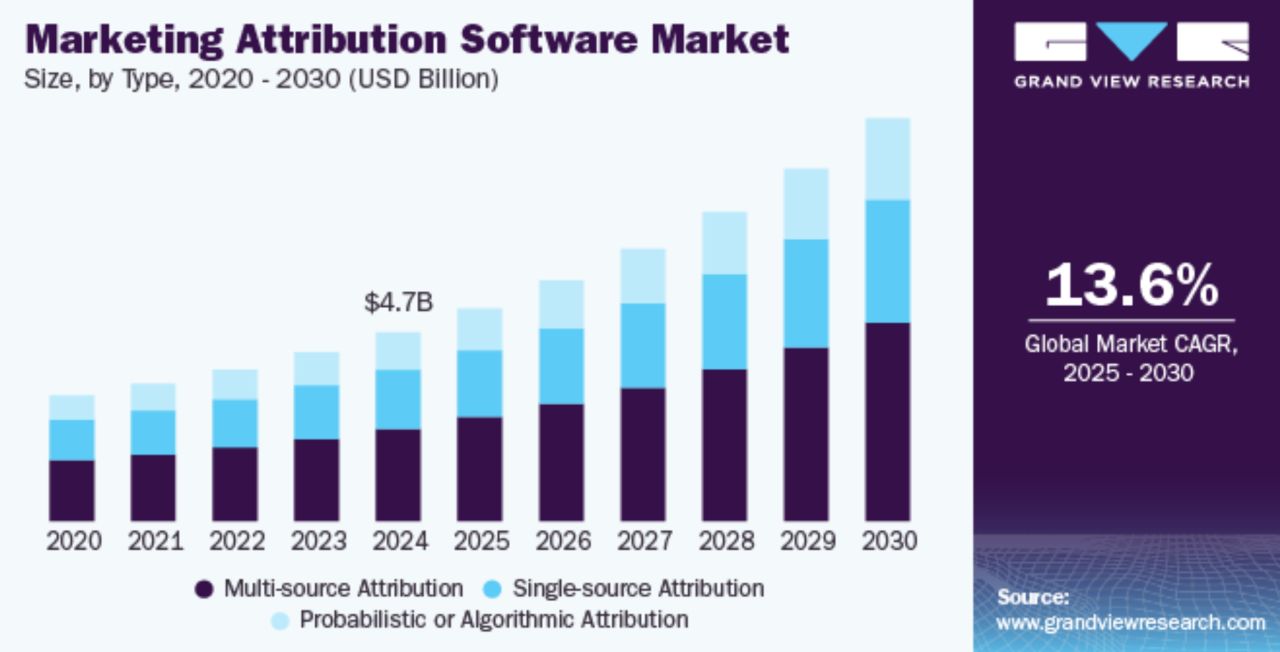
Marketing measurement is going through a historic reset. The attribution software market is set to quadruple from $3B → $13B and it’s not by accident. If you want to understand why modern marketing feels harder and why budgets are under more scrutiny than ever, it all starts here. Here are 5 reasons driving this massive shift: 1. Privacy changes broke the playbook When Apple introduced App Tracking Transparency (ATT), it broke the traditional performance marketing playbook. Brands lost the ability to reliably connect clicks to purchases, forcing them to adopt privacy-resilient ways to measure impact. 2. Buyer journeys are messier than ever The "last-click" era worked when the journey was simple. Today, a buyer might hear about you on a podcast, see you on Instagram, get a friend’s recommendation, and finally Google you weeks later. Tools like GA4 weren’t built for this chaotic, multi-touch world. The result? Marketers dramatically under or over-credit channels, creating misaligned budgets and wasted spend. Without proper attribution, brands end up flying blind, guessing which touchpoints really drive conversions. 3. ROI pressure is higher than ever In an era where CFOs scrutinize every line item, marketers are under intense pressure to show direct ROI from their programs. Strong attribution can help transform marketing from a perceived cost center into a strategic growth engine which is critical if you want to keep budgets (and your seat at the table). 4. Multi-channel is the new normal Modern marketing isn’t about one channel; it’s about creating an ecosystem of touchpoints across paid, organic, influencer, events, and more. Attribution software like Fairing helps brands understand how these channels work together (and which combinations actually drive revenue. 5. Advanced modeling is going mainstream Approaches like marketing mix modeling (MMM), once reserved for big-budget consumer brands, are now becoming accessible and essential for growth-stage companies too. Why? They provide a macro-level view of channel effectiveness without relying on user-level tracking, which is increasingly restricted. Teams are getting savvier, moving beyond platform metrics to understand true incremental lift. So what does this mean? You can’t win today’s attention war with guesswork. You also can’t rely on outdated models or vanity metrics anymore. It’s about building a measurement strategy that’s as modern and dynamic as your buyers. One that helps you confidently defend budgets, prioritize channels, and prove real impact. Adapt or watch your marketing dollars (and budget) disappear. How confident are you with your current measurement stack?
6 of 38 adsSign up to see every Fairing ad, filter by format and date, and get alerts on new ones.
See all 38 adsWatch the companies you care about.
Filter every ad by industry, country, format and network, and get alerts when a company you watch starts running new ads.