On air · 1 of 3 networks
eRoots Analytics
- eroots.tech
- Climate & Energy
- ES
- 25 employees
eRoots Analytics’s ads on LinkedIn, Meta and Google, recorded by adsrunning. Browse the latest here for free. Sign up free to see all 28. Watch eRoots Analytics with Starter to get each new one in your feed.
Watchlist with Starter · $49/mo
| Network | Status | Live ads | Nov 2025LinkedIn activity · 52 weeksOct 2026 | Checked | Next step |
|---|---|---|---|---|---|
| Running | 3 | Checked 28 Oct 2026 | See all 28 ads → | ||
| Meta | Not checked | — | |||
| None recorded | 0 | No ads found on the Google Ads Transparency Center | Checked 28 Oct 2026 | Collect them with the API → |
eRoots Analytics has 3 live LinkedIn ads. We recorded no Google ads on 28 Oct 2026.
Latest ads
- LINKEDIN · IMAGESince 20 Oct 2026
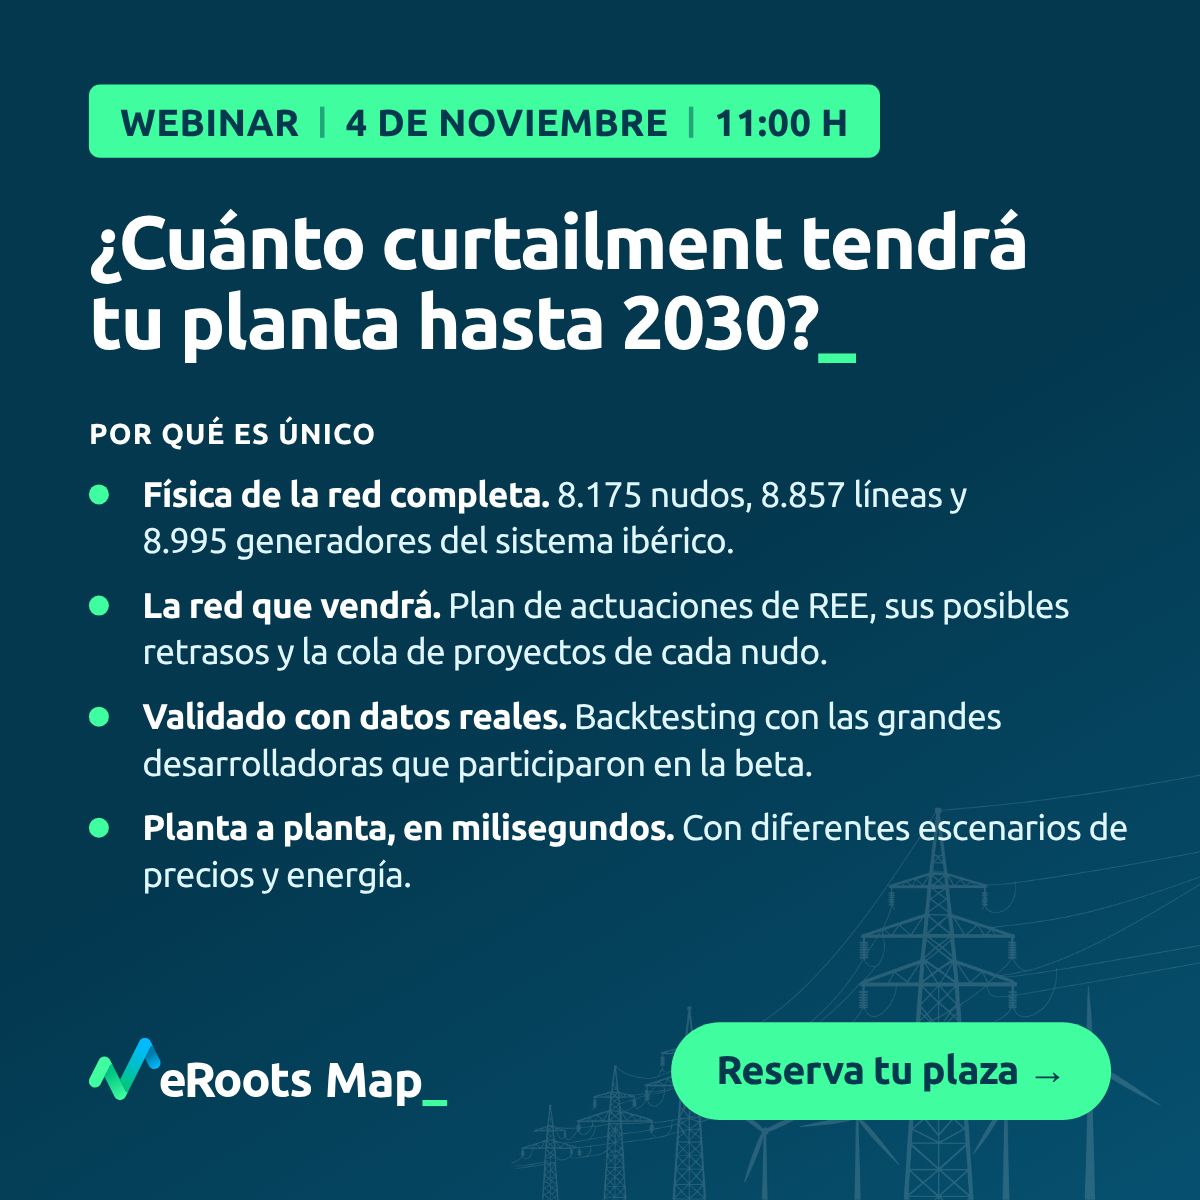
El 4 de noviembre a las 11:00 h presentamos la previsión de curtailment de eRoots Map. Calcula el vertido esperado de tu planta hasta 2030 sobre la física de la red completa, su evolución y distintos escenarios. El curtailment pesa cada vez más en la rentabilidad de los proyectos renovables en España. Aun así, casi siempre se estima con datos del pasado, y la red del futuro será muy diferente. En 45 minutos, Josep Fanals, CEO de eRoots, mostrará en directo: ▪ El modelo del sistema ibérico, con 8.175 nudos, 8.857 líneas y 8.995 generadores ▪ La red que vendrá y la evolución del curtailment, con el plan de actuaciones de REE, sus posibles retrasos y la cola de proyectos de cada nudo ▪ Resultados planta a planta en milisegundos, con diferentes escenarios de precios y energía Las plazas están limitadas a 50 personas.
- LINKEDIN · VIDEOSince 13 Oct 2026
Desde hoy, eRoots Map proyecta el curtailment futuro en cada punto de conexión de la península. El cálculo se hace sobre la red futura, con los escenarios energéticos y de precio que tú defines: - Horizonte a cinco años. Fijas año a año el crecimiento renovable, la demanda, el almacenamiento y los precios de combustible. - Retrasos de la red. Desplazas la entrada de los refuerzos planificados entre cero y cinco años y ves cómo cambian las restricciones técnicas. - Topología real. Cada escenario se resuelve como un flujo de potencia sobre la red completa, así que el resultado distingue entre nudos vecinos. - Curtailment valorado. La energía recortada se entrega por planta y por mes, en MWh y en euros al precio proyectado del mercado diario. El modelo cubre 8.175 nudos, 8.857 líneas, 7.479 subestaciones y 8.995 generadores del sistema ibérico, con partes de la distribución de 132 kV. Tras año y medio de desarrollo y siete meses trabajando con las principales desarrolladoras de energía, productores, consultoras y constructoras de centros de datos, la plataforma ya permite predecir el curtailment con criterios de REE.
- LINKEDIN · VIDEOSince 13 Oct 2026
Tras año y medio de desarrollo y siete meses trabajando con las principales desarrolladoras de energía, productores, consultoras y constructoras de centros de datos, la plataforma ya permite predecir el curtailment con criterios de REE. Desde hoy, eRoots Map proyecta el curtailment futuro en cada punto de conexión de la península. El cálculo se hace sobre la red futura, con los escenarios energéticos y de precio que tú defines: - Horizonte a cinco años. Fijas año a año el crecimiento renovable, la demanda, el almacenamiento y los precios de combustible. - Retrasos de la red. Desplazas la entrada de los refuerzos planificados entre cero y cinco años y ves cómo cambian las restricciones técnicas. - Topología real. Cada escenario se resuelve como un flujo de potencia sobre la red completa, así que el resultado distingue entre nudos vecinos. - Curtailment valorado. La energía recortada se entrega por planta y por mes, en MWh y en euros al precio proyectado del mercado diario. El modelo cubre 8.175 nudos, 8.857 líneas, 7.479 subestaciones y 8.995 generadores del sistema ibérico, con partes de la distribución de 132 kV.
- LINKEDIN · VIDEOSince 25 Jun 2026
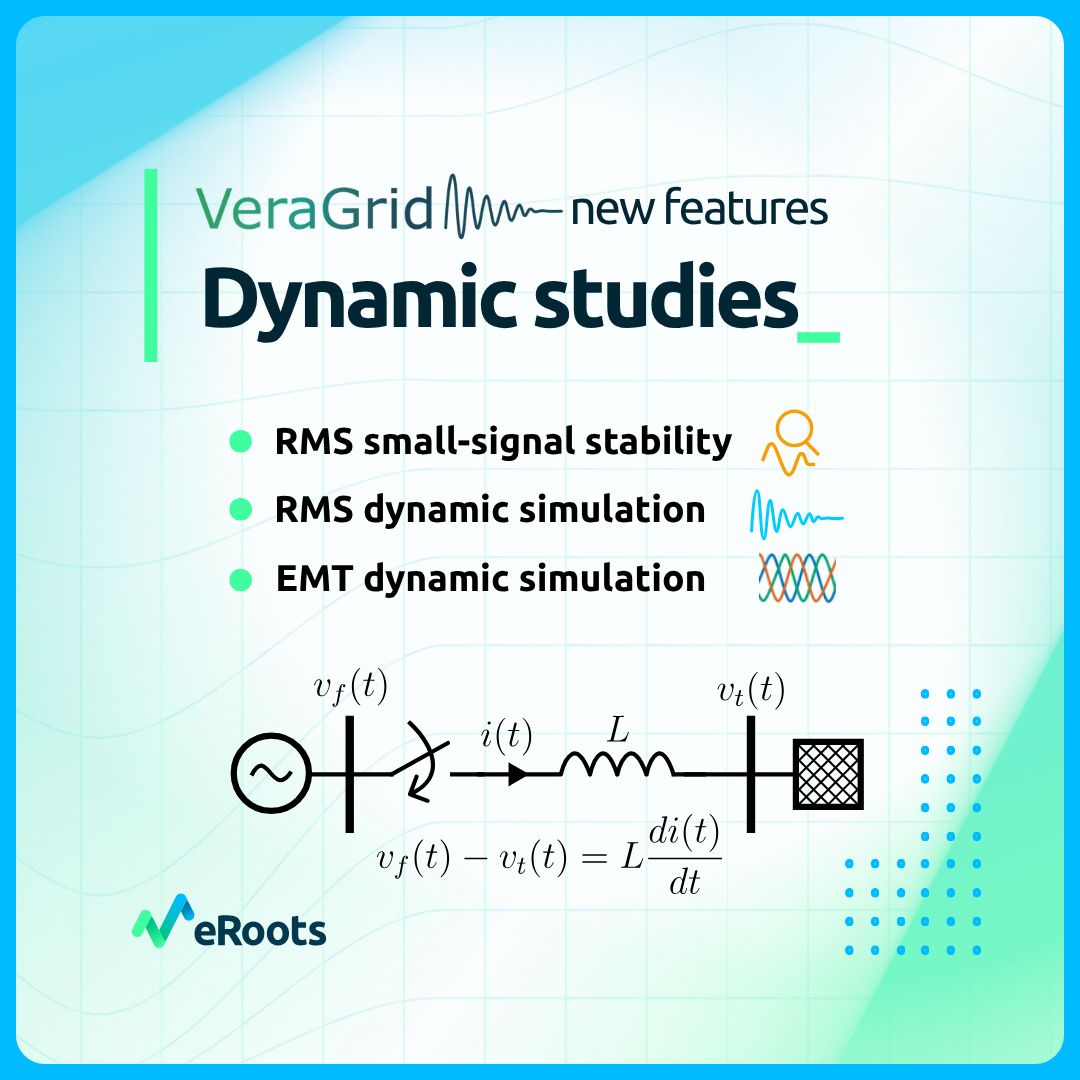
The modern grid moves in microseconds. Until now, the tools that could simulate it were closed, scattered, and highly-priced per seat. Not anymore. VeraGrid Dynamic Studies brings RMS, EMT and small-signal stability to one open platform. For every engineer on your team. No seats to ration, no restriction on who gets access. Free and open-source. And dynamics is just one in a much larger toolset: the same open platform carries your investment planning, your optimal power flow, your contingency, and your short-circuit work. VeraGrid reads CGMES, PSS/E, PowerFactory and PyPSA natively, so you don't need to rebuild anything. Want to see what happens when an open-source tool finally outperforms all commercial ones? Let us show you. VeraGrid is free, open-source and ready.
- LINKEDIN · IMAGESince 14 Jun 2026
What happens to the grid in the seconds after a disturbance? In the milliseconds? In the microseconds before anyone even notices? As renewables and power electronics reshape the rhythm of modern power systems, those questions have never mattered more. VeraGrid now answers them all. With native RMS small-signal stability, RMS dynamic simulation, and EMT dynamic simulation, the full dynamic study stack is available in one open-source platform for the first time. How does it work? 1️⃣ Small-signal stability linearizes the system around an operating point to expose its eigenvalues, oscillatory modes, damping ratios, and participation factors. 2️⃣ RMS dynamic simulation plays the grid forward in time using phasor representations, capturing how mangitudes evolve over seconds and minutes after a fault, a generator trip, or a major contingency. 3️⃣ EMT dynamic simulation drops down to microsecond resolution, resolving the instantaneous waveform itself. This is the depth required to validate inverter converter controls and the fast phenomena that increasingly govern grids dominated by power electronics. This lets you: ↳ Run small-signal, RMS, and EMT studies on the same VeraGrid model, without re-importing data or migrating between disconnected tools. ↳ Validate dynamic behavior in grids dominated by inverter-based resources, where the assumptions of legacy simulators no longer hold. ↳ Combine dynamic studies seamlessly with power flow, OPF, contingency, short-circuit, and state estimation inside one workflow. ↳ Deliver reproducible, auditable studies on an open-source platform that anyone can inspect, extend, and trust. Until today, the full dynamic toolkit lived behind expensive proprietary licenses or scattered across a patchwork of specialized packages. VeraGrid brings it together in one open environment, ready for the grid the energy transition is building. VeraGrid is free, open source, and ready. 👉 Download VeraGrid V6.1 here: https://lnkd.in/esWjAwdn
- LINKEDIN · IMAGESince 14 Jun 2026
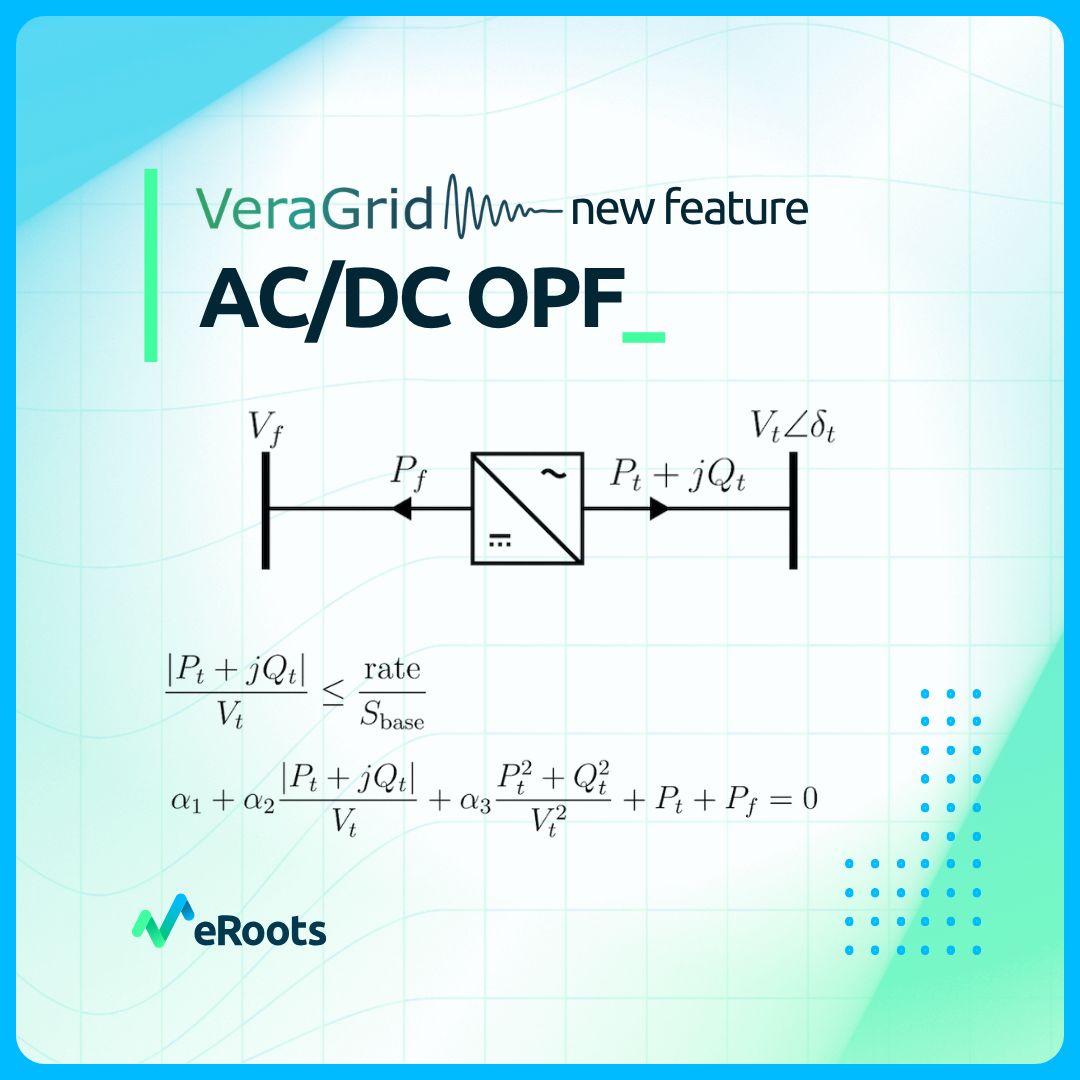
How do you optimize a grid containing AC/DC converters? VeraGrid now supports AC/DC optimal power flow (OPF), with particular focus on converter modeling and the coupling between AC and DC subsystems. How does it work? 1️⃣ Building on our earlier work on the unified AC/DC power flow, the physical system is constructed as a single set of algebraic equations in which AC nodes, DC nodes, and converter stations are solved simultaneously rather than sequentially. 2️⃣ The OPF extends this formulation by introducing a set of equality and inequality constraints alongside an objective function, turning the problem into a constrained nonlinear program. This lets us guarantee that: ↳ Converters operate within their current and power limits, including the coupling between active and reactive power at the AC terminal. ↳ HVDC link flows are dispatched optimally rather than fixed a priori. ↳ Optimal converter setpoints are determined consistently, regardless of whether they operate in grid-following or grid-forming mode. ↳ Converter losses are respected, making them non-ideal components. The whole problem is solved through our interior point solver (IPS), which converges to a point satisfying the Karush-Kuhn-Tucker (KKT) conditions. Because the solver is native to VeraGrid, there is no dependency on external optimization packages. This development closes the loop: VeraGrid users can now model modern hybrid AC/DC grids end to end, with full flexibility and no artificial limitations. VeraGrid is free, open source, and ready. 👉 Download VeraGrid V6.0 here: https://lnkd.in/eVbrFGcz
6 of 28 adsSign up to see every eRoots Analytics ad, filter by format and date, and get alerts on new ones.
See all 28 adsWatch the companies you care about.
Filter every ad by industry, country, format and network, and get alerts when a company you watch starts running new ads.