On air · 2 of 3 networks
Blok
- blok.co.za
- Real Estate & PropTech
- ZA
- 61 employees
Blok’s ads on LinkedIn, Meta and Google, recorded by adsrunning. Browse the latest here for free. Sign up free to see all 96. Watch Blok with Starter to get each new one in your feed.
Watchlist with Starter · $49/mo
| Network | Status | Live ads | Nov 2025LinkedIn activity · 52 weeksOct 2026 | Checked | Next step |
|---|---|---|---|---|---|
| Running | 87 | Checked 30 Oct 2026 | See all 96 ads → | ||
| Meta | Running | 17 | Active ads on the Meta Ad Library, all countries | Checked 27 Oct 2026 | Collect them with the API → |
| Recently | 29 | Ads on the Google Ads Transparency Center | Checked 12 Oct 2026 | Collect them with the API → |
Blok has 87 live LinkedIn ads. Its Facebook page had 17 active ads on 27 Oct 2026, and we recorded 29 Google ads on 12 Oct 2026.
Latest ads
- LINKEDIN · IMAGESince 27 Oct 2026
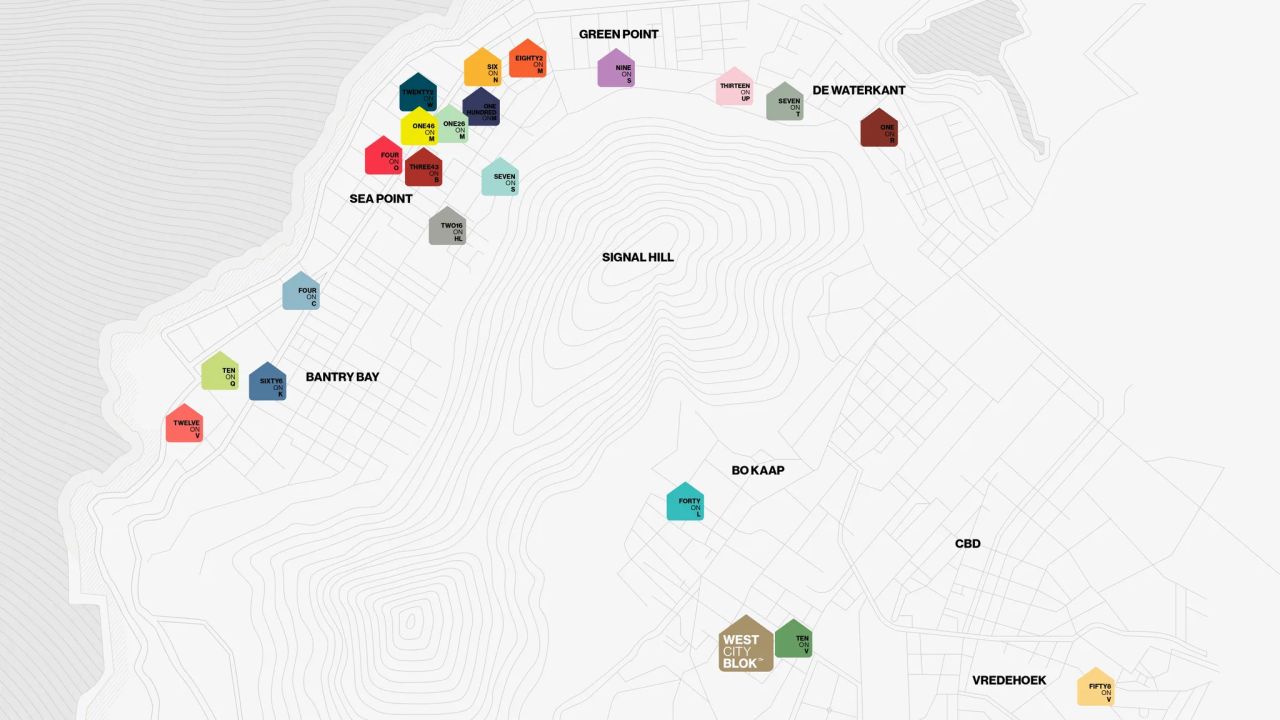
We tend to celebrate the outcomes, but rarely the thousands of ordinary days that made them possible 💪 Perseverance and consistency have played a huge role in some of the things I'm most grateful for in life - one of the places I've seen this play out most clearly is at Blok. 📋 For the past few years, we've followed a simple weekly ritual. Our leadership team meets every Monday and agrees on our MITs (Most Important Tasks) for the week ahead. We then publish these commitments to our entire company, alongside how we performed against the previous week's priorities. There's one rule we've always stuck to. Once a task goes onto the list, it cannot simply disappear. It has to get done. No hiding from unfinished commitments. Especially as leaders. 📈 In 2020, BLOK was selling approximately R250m in property annually. In 2026, we're tracking towards R1.6bn. That's more than 6x growth in six years. Of course, there have been countless contributors to that growth - both internal and external. An incredible team, strong partnerships, good decisions and plenty of mistakes we've learned from along the way. But I genuinely believe this simple discipline of doing what we said we'd do, every single week, has been one of the biggest contributors. 🏙️ Looking at this map of our developments across Cape Town - I see years of people showing up, solving problems, keeping commitments and getting things done. One week at a time. It's easy to get excited about big strategies and ambitious goals. It's much harder to consistently execute the small things that move you towards them. And that's probably one of the biggest lessons I've learned in business. You don't always need the next big idea. Sometimes you just need to keep showing up!!
- LINKEDIN · IMAGESince 25 Aug 2026
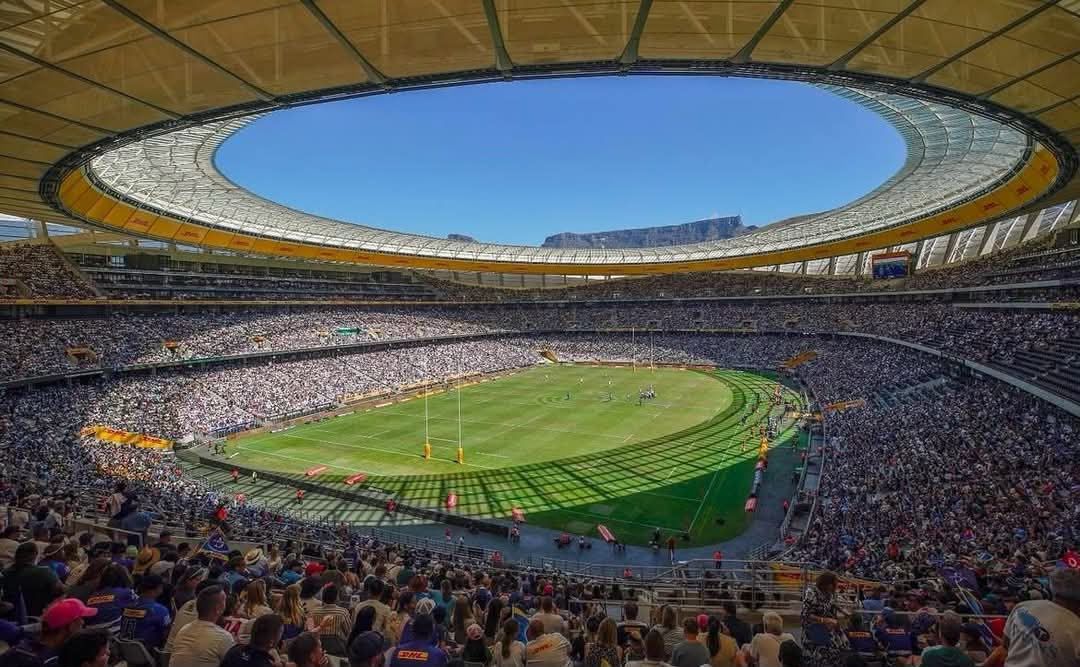
Cape Town is about to host ~62,000 people for the Springboks vs All Blacks at DHL Stadium this Saturday. But the interesting number isn’t 62,000. It’s R5.2 billion. That’s the estimated economic impact DHL Stadium generated for Cape Town in the 2024/25 financial year - up from R3.3bn the year before. Accommodation. Restaurants. Uber trips. Flights. Retail. Security. Event staff. Suppliers. Tourism. And then the harder-to-measure value of broadcasting City of Cape Town to millions of people around the world. It got me thinking about the economics of the stadium itself. Cape Town Stadium cost approximately R4.4bn to build for the 2010 World Cup. In 2024/25 alone, its independently assessed direct, indirect and induced economic impact was R5.2bn. Of course, economic impact is not the same thing as profit or cash returned to the City. The stadium also still requires public support. The City's operating contribution was approximately R19.5m in 2024/25, down from R33.2m the year before. With another view - the annual economic activity associated with the stadium is now measured in billions, while the City's operating shortfall is measured in tens of millions. And the broader events economy is becoming a serious industry in its own right. In 2025, just 15 major Cape Town events generated more than R2.5bn of economic activity - an average of more than R165m per major event. This weekend is exactly why cities invest in infrastructure like this. A Springbok vs All Blacks Test isn't simply 80 minutes of rugby. It's thousands of visitors arriving in Cape Town, filling rooms, restaurants and bars, moving through the city and spending money - while one of the most recognisable cities in the world gets another global shop window. There was plenty of debate after 2010 about whether Cape Town needed a R4.4bn stadium. Sixteen years later, I think the more interesting question is: What would Cape Town's events economy look like today if we hadn't built it? The value of good infrastructure isn't always visible in year one. Sometimes the return compounds over decades. And Cape Town is increasingly showing what happens when infrastructure, tourism, events and a great city all start reinforcing one another. Let's go Bokke!! 🇿🇦 🏉 🇳🇿
- LINKEDIN · IMAGESince 24 Aug 2026
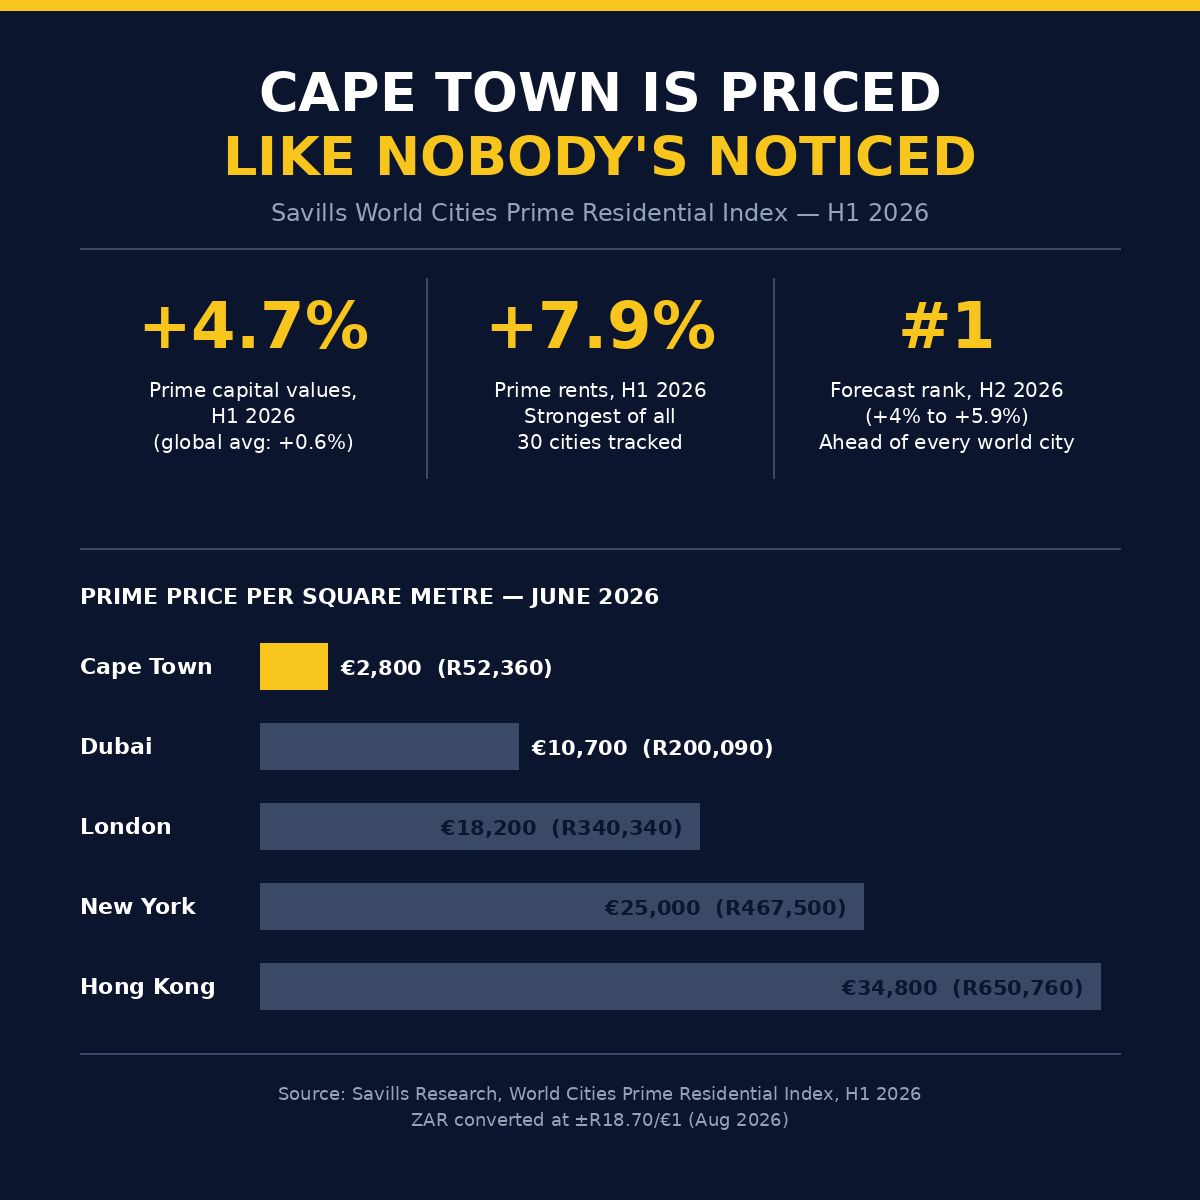
Savills just released their H1 2026 World Cities Prime Residential Index. 30 cities - one, beautiful underdog outperforming it's peers - and it's ours. Cape Town While the global average for prime capital values crawled up 0.6% in H1 2026, Cape Town posted 4.7% growth. Rents rose 7.9%, the strongest rental growth of any city in the index. Cape Town prime property averages €2,800 per square metre (R52,360 at current exchange rates). That is the second cheapest of all 30 cities tracked, just above Kuala Lumpur. Compare that to; - London at €18,200 (R340,340) - New York at €25,000 (R467,500) - Hong Kong at €34,800 (R650,760) Meanwhile the cities that dominate the global prime conversation are cooling off fast. Dubai fell 4.5% on capital values and 6.7% on rents in H1, with Savills forecasting a further 10% drop through H2 as oversupply changes market dynamics. London is still 24.5% below its 2014 peak. And the forecast for H2 2026? Savills projects Cape Town to lead all 30 world cities, with capital values expected to rise 4% - 5.9% (ahead of Singapore, Seoul, Lisbon, Madrid and every other market in the index - insane) The driver is fairly simple; demand keeps outstripping a limited pool of high-quality prime stock, and Savills expects the pricing gap between prime and non-prime areas to keep narrowing through the year. Source: Savills Research, World Cities Prime Residential Index, H1 2026 (ZAR conversions at ±R18.70/€1, August 2026)
- LINKEDIN · IMAGESince 20 Aug 2026
Selling a property is less simple than you think... Often people think that the maths is very straight forward when it comes to selling a property; You take the selling price, less agent commission and keep some of the profit aside for capital gains tax (if you are thinking that far). Some of the additional costs that you may not think about are; - bond cancellation fees (bank dependant and if adequate notice is not given) - bond attorney cancellation fees - certificates of compliance fees for issuing certificates - any repair work that is needed to get valid COC's (somehow there is always work) - If sectional title, levy clearance fees (normally about 3 months of levy payments) - rates clearance (normally about 3 months of rates payments) - VAT on the agent's comm The above does not only affect your calculated return, but can also have a large impact on your cash flow leading up to the transaction which you may not have budgeted for. it should be noted that items like your rates and levy clearance figures can be claimed back pro-rata in relation to when transfer takes place, but you will need to chase this up yourself in most cases. Speaking about cash flow, a further consideration you need to keep in mind when selling; If you had a tenant in the property and are now selling it vacant, the transfer can take up to 3 months and your monthly running costs like your bond, rates, and levies don't wait for you. This can have a massive impact on your calculated return on cash based on how much leverage you have. THEN... all of the above needs to be taken into account when considering your tax liability on the property which has multiple factors affecting it; - how long you held the property - how often you flip properties (it may be seen as trading rather than a capital gain) - what structure/entity you own in - what you spent on the property whilst you owned it (upgrades/improvements) The bottom line is that it is important to educate yourself and speak to a professional before you make a quick decision based on a 'shiny' return %. The devil is always in the detail.
- LINKEDIN · IMAGESince 17 Aug 2026
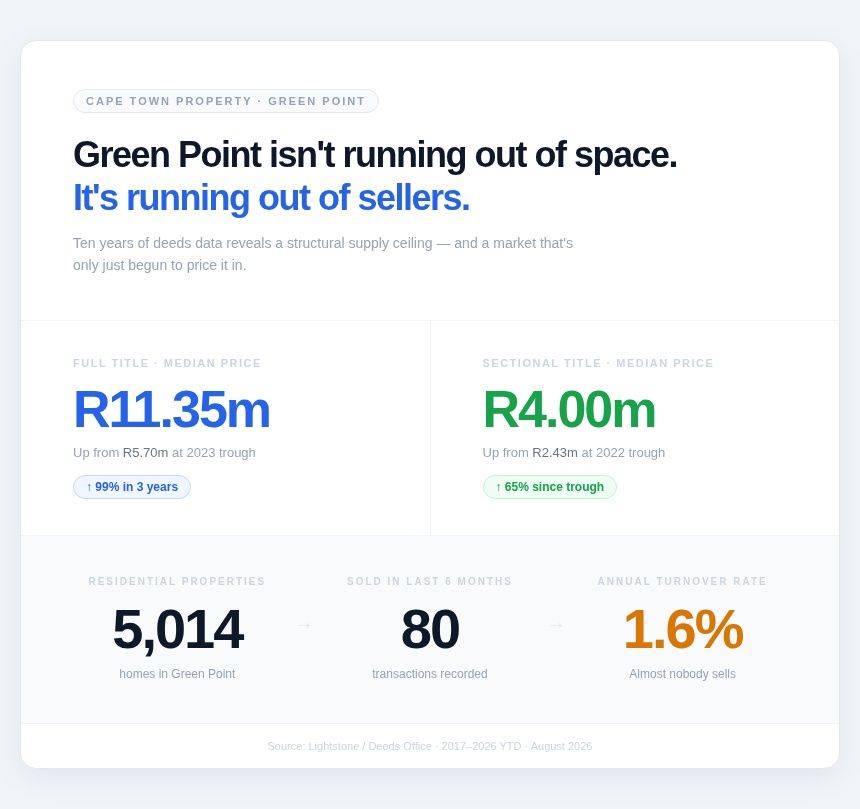
Green Point isn't running out of space. It's running out of sellers. 🏡📈 Everyone talks about Green Point's location. Very few talk about its liquidity. The numbers are fascinating: 🏠 More than 5,000 residential properties 👥 45% of owners have held their property for 11+ years 👴 Nearly two-thirds of owners are over 50 🔑 In the last 6 months, just 80 properties changed hands. ‼️ That's a turnover rate of roughly 1.6% ‼️ At the same time, prices continue moving higher. 📈 Sectional title median prices have risen from R2.43m in 2022 to R4.00m today (+65%). 🏡 Full-title median prices have increased from R5.70m in 2023 to R11.35m today (+99%). Why? Because Green Point isn't just supply constrained. It's resale constrained. ❌ Signal Hill, the Atlantic Ocean, the CBD and major transport routes already limit expansion. ❌ Add heritage protections and there are relatively few opportunities for meaningful new supply. ❌ Now combine that with an ownership base that rarely sells. When demand increases, there isn't a large pool of properties waiting to come to market - there are simply fewer willing sellers. Investment opportunities become most attractive when demand is growing faster than available stock. Green Point isn't just supply constrained. It's seller constrained. That is one of the strongest long-term investment theses on the Atlantic Seaboard.
- LINKEDIN · IMAGESince 3 Aug 2026
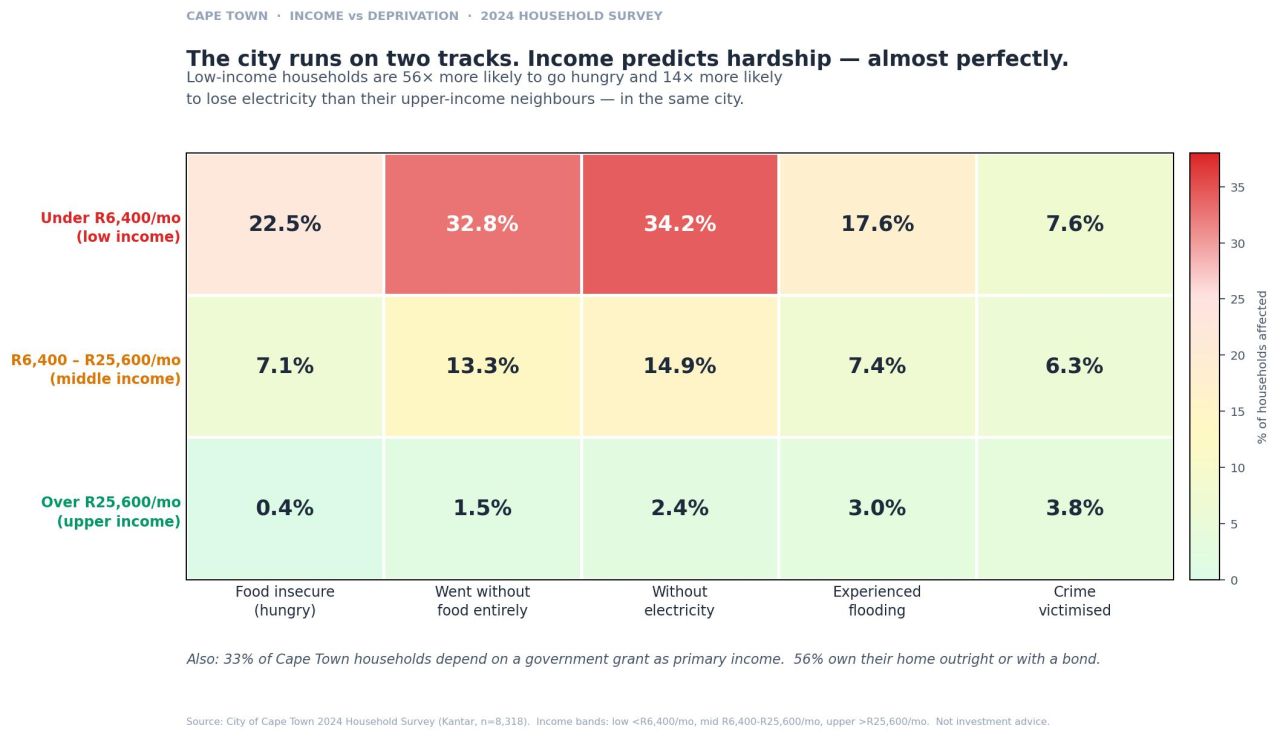
🏙️ A Tale of Two Cape Towns One city. Two completely different realities. Recently I came across the City of Cape Town's 2024 Household Survey. More than 8,300 households surveyed across the city.. 📊 A household earning under R6,400 per month is: ‼️ 56× more likely to go hungry. ‼️ 14× more likely to lose electricity. ‼️ Nearly 6× more likely to experience flooding. These aren't isolated statistics. 💰 Income shapes everyday life. One figure stood out even more. 33% of Cape Town households rely on a government grant as their primary source of income. To put that into perspective, South Africa's most common grant - the Child Support Grant - is only R580 per month, while the Old Age and Disability Grants are R2,400 per month. These grants are an essential safety net, but they are not designed to provide the level of income needed to escape poverty or build long-term financial security. Now combine that with South Africa's labour market. Official unemployment stands at 32.7% - meaning almost one in every three people actively looking for work cannot find a job. The survey suddenly tells a much bigger story. The biggest divide in Cape Town isn't simply geographic. It's economic. Higher household incomes don't just increase spending power. They reduce hunger. They improve access to reliable services. They create more choices. They reduce hardship. 📈 Economic growth and job creation won't solve every challenge our city faces. But if this survey tells us anything, it's that helping lower-income households earn more may be one of the most powerful ways to reduce suffering in our city.

6 of 96 adsSign up to see every Blok ad, filter by format and date, and get alerts on new ones.
See all 96 adsWatch the companies you care about.
Filter every ad by industry, country, format and network, and get alerts when a company you watch starts running new ads.