On air · 1 of 3 networks
Base Operations
- baseoperations.com
- Cybersecurity
- US
- 34 employees
Base Operations’s ads on LinkedIn, Meta and Google, recorded by adsrunning. Browse the latest here for free. Sign up free to see all 118. Watch Base Operations with Starter to get each new one in your feed.
Watchlist with Starter · $49/mo
| Network | Status | Live ads | Nov 2025LinkedIn activity · 52 weeksOct 2026 | Checked | Next step |
|---|---|---|---|---|---|
| Running | 118 | Checked 30 Oct 2026 | See all 118 ads → | ||
| Meta | Not checked | — | |||
| None recorded | 0 | No ads found on the Google Ads Transparency Center | Checked 9 Oct 2026 | Collect them with the API → |
Base Operations has 118 live LinkedIn ads. We recorded no Google ads on 9 Oct 2026.
Latest ads
- LINKEDIN · VIDEORecorded 10 Sept 2026
Security teams have been stuck with three bad options when it comes to assessing risk across their company operations. 1. Do nothing and stay in permanent react mode. 2. Manually gather threat data that's inconsistent, slow, and impossible to scale beyond a handful of locations. 3. Or use black box risk scores that lack context, cover limited geographies, aren’t granular enough, and update once a year. None of those options help protect global operations at scale. That’s why forward-thinking security teams are moving from reactive crisis management to proactive threat intelligence.
- LINKEDIN · IMAGERecorded 10 Sept 2026
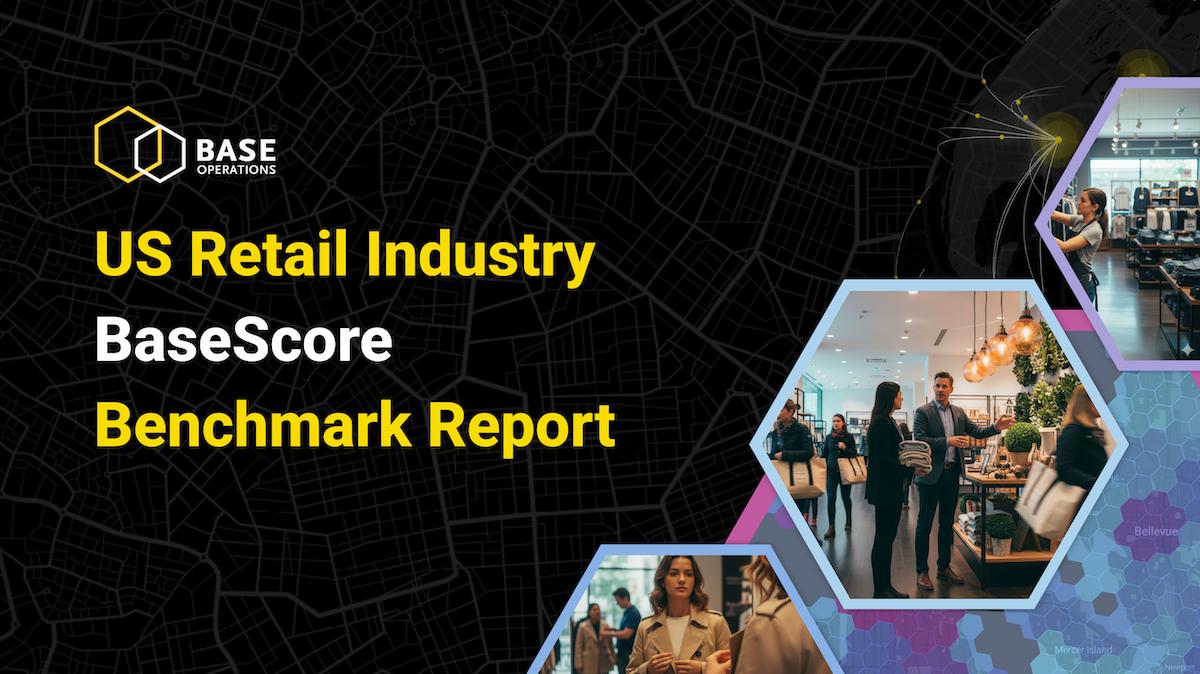
We analyzed the immediate threat landscape at 75,434 retail locations across America to create the most comprehensive benchmarks ever. And we’re making all of that analysis available for free. Retailers lack a universal standard for security risks across their company footprint. Too many security teams are stuck prioritizing resources based on gut instinct, lagging incident reports, or city-wide crime stats that miss what's actually happening at your stores. Our US Retail Industry BaseScore Benchmark Report gives you the framework to allocate resources with precision using street-level threat intelligence within 0.25 miles of each location. Inside the free interactive tool available here: https://lnkd.in/eECVYmFM • National and regional risk benchmarks (regional variation is big) • Individual benchmarks for the top 100 US retailers by sales • State-by-state comparisons • Granular threat breakdowns (property crime, violent crime, unrest) • A case study showing how to benchmark your entire footprint, identify your 10 highest-risk sites, and conduct standardized threat assessments This isn't city-wide, generic crime data. This is sub-mile intelligence broken down by threat type at 75,434 specific locations. Without a universal risk standard, retail security teams are left guessing. You're defending budget requests with anecdotes. You're reacting to incidents instead of preventing them. This benchmark shows what becomes possible when your entire security strategy is grounded in granular, standardized threat intelligence. Prove which stores need security infrastructure. Optimize guard deployments with data. Defend your budget with evidence executives actually understand. The gap between reactive security and strategic security is intelligence.
- LINKEDIN · VIDEORecorded 10 Sept 2026
Incredible response to our US Retail Industry BaseScore Benchmark Report so far. You can go right in and search any retailer from National Retail Federation's top 100. We’ve made our analysis publicly available in this interactive tool. Here’s how different regions rank vs the national benchmark of 24: • Midwest = 20 • South = 22 • Northeast = 25 • West = 32 The devil (and nuance) is always in the details. Eg, while the West has a higher average BaseScore, the Northeast has 10x more locations in the Very High Risk tier than any other region at 1m radius of analysis. Security leaders use BaseScore benchmark data like this to: • Get apples to apples comparison of risk across footprint • Prioritize high risk sites and build tiered approach to security • Make data-driven decisions about resource allocation We broke the data down by region, state, and even company to help security leaders benchmark their performance. If you want a custom BaseScore analysis of your location footprint, drop a comment here or send me a DM.
- LINKEDIN · IMAGERecorded 10 Sept 2026
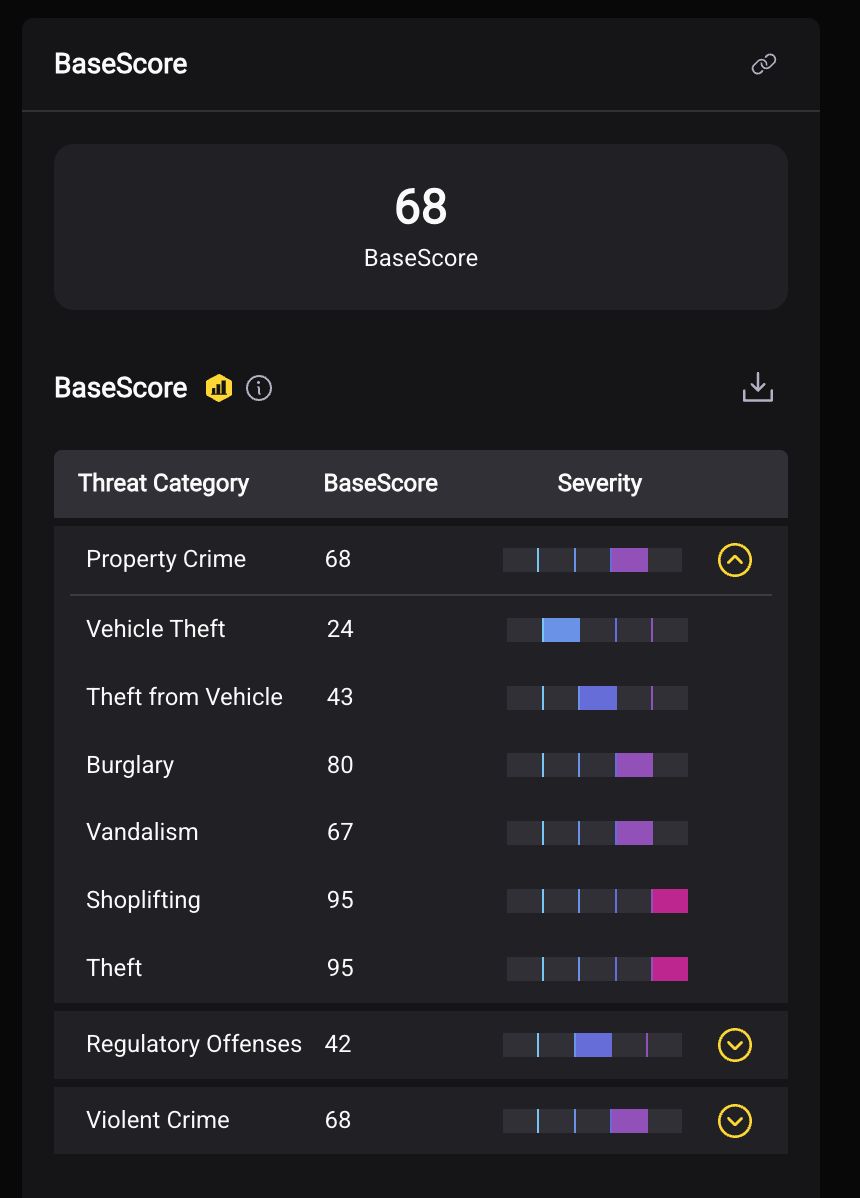
"Why is our London office high risk but Berlin is only medium?" Every quarter, security leaders face a similar question. Every quarter, they give the same weak answer. "That's what our intelligence provider says." A Fortune 500 security director told me his CFO's response to their risk heat map was brutal. "So we're making $2M decisions based on... colors?" When you can't explain your intelligence, you can't defend your budget. When you can't defend your budget, you're a cost center, not a strategic advisor. Now he presents differently. "London’s risk is elevated due to a 10% increase in civil unrest within 1 mile of our facilities. There’s been a 24% increase in property crime and 12% increase in petty theft over the last 6 months." CFO's response: "What do you need to mitigate this?" The difference is intelligence you can defend. Black-box risk scores make seasoned professionals sound like amateurs. Your expertise shouldn't be undermined by a map you can't explain. That’s why BaseScore gives you both an easy to understand score you can compare across any location AND the detailed breakdown of what is driving that score.
- LINKEDIN · IMAGERecorded 10 Sept 2026
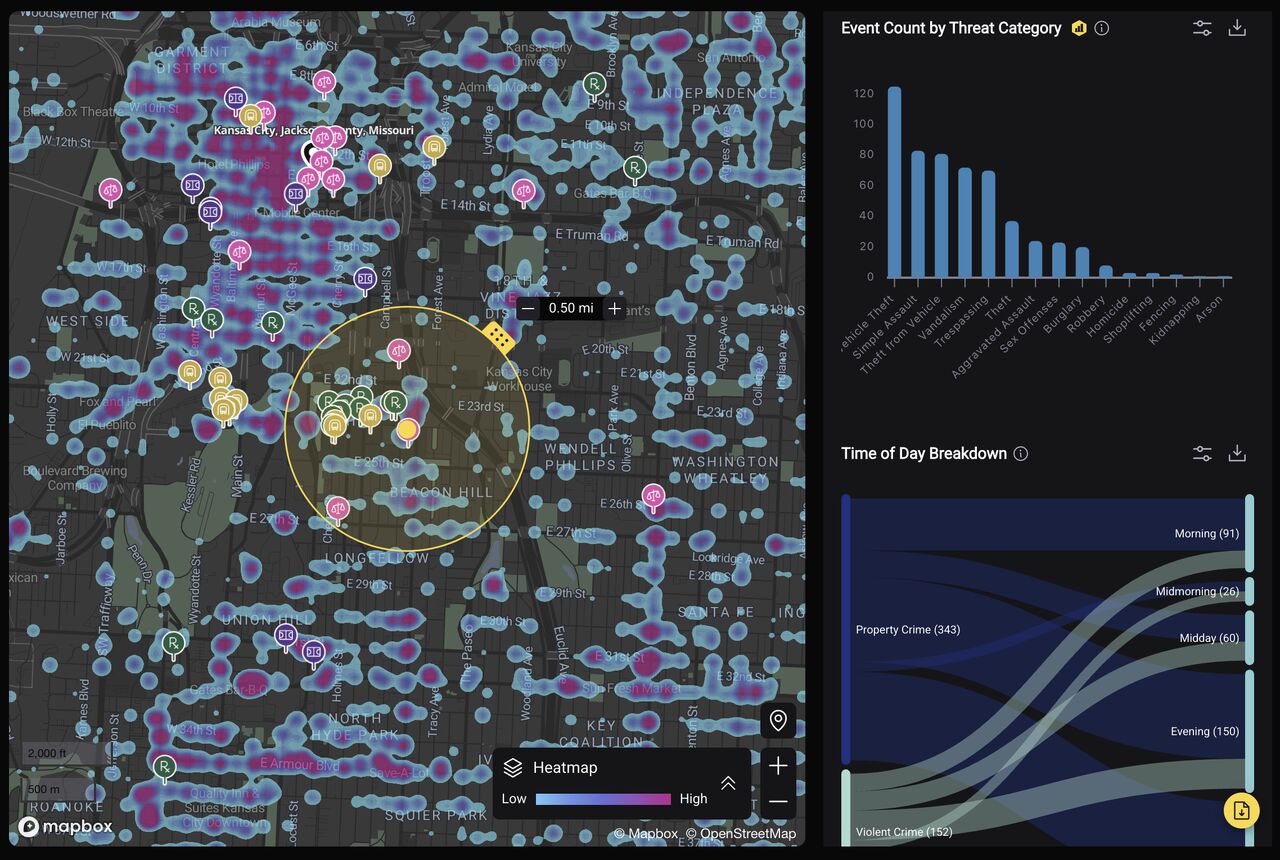
Security teams are making million-dollar real estate decisions with data that's about as useful as checking weather for your entire state instead of your specific address. "When investing in new locations, we'll compare 2 or 3 sites, sometimes only a few hundred meters apart, sometimes opposite sides of the city." That's how a Fortune 500 security leader described her site assessment process. They were frustrated by their current city-level risk analysis. They needed block-by-block intelligence to make real estate decisions worth millions. Here's what drives site selection: • Comparing locations within walking distance of each other • Understanding why one corner is low risk while another 200 meters away is high risk • Knowing how risk shifts from business hours to after dark • Identifying incident patterns around transit stops Most security vendors provide city-wide data because it's all they’re capable of. But when you're choosing between two office locations separated by a few blocks, citywide crime rates tell you nothing. You need hyper-local intelligence: • Property crime patterns after business hours • Violent crime clustering during peak times • Risk variations by day of week • Safety changes with proximity to transit If you're evaluating locations and need granular threat assessment, city-wide data won’t cut it.
- LINKEDIN · VIDEORecorded 10 Sept 2026
Global crime and unrest data is inconsistent and incomplete. Your security team deserves better. Base Operations delivers the first globally consistent, street-level threat intelligence model that gives you complete coverage. So you can say yes more often.
6 of 118 adsSign up to see every Base Operations ad, filter by format and date, and get alerts on new ones.
See all 118 adsWatch the companies you care about.
Filter every ad by industry, country, format and network, and get alerts when a company you watch starts running new ads.