On air · 1 of 3 networks
VIZION
- vizionapi.com
- US
- 78 employees
VIZION’s ads on LinkedIn, Meta and Google, recorded by adsrunning. Browse the latest here for free. Sign up free to see all 22. Watch VIZION with Starter to get each new one in your feed.
Watchlist with Starter · $49/mo
| Network | Status | Live ads | Nov 2025LinkedIn activity · 52 weeksOct 2026 | Checked | Next step |
|---|---|---|---|---|---|
| Running | 22 | Checked 30 Oct 2026 | See all 22 ads → | ||
| Meta | None recorded | 0 | No active ads recorded on the Meta Ad Library | Checked 28 Oct 2026 | Collect them with the API → |
| Recently | 1 | Ads on the Google Ads Transparency Center | Checked 15 Oct 2026 | Collect them with the API → |
VIZION has 22 live LinkedIn ads. Its Facebook page had no active ads on 28 Oct 2026, and we recorded 1 Google ad on 15 Oct 2026.
Latest ads
- LINKEDIN · IMAGERecorded 29 Oct 2026
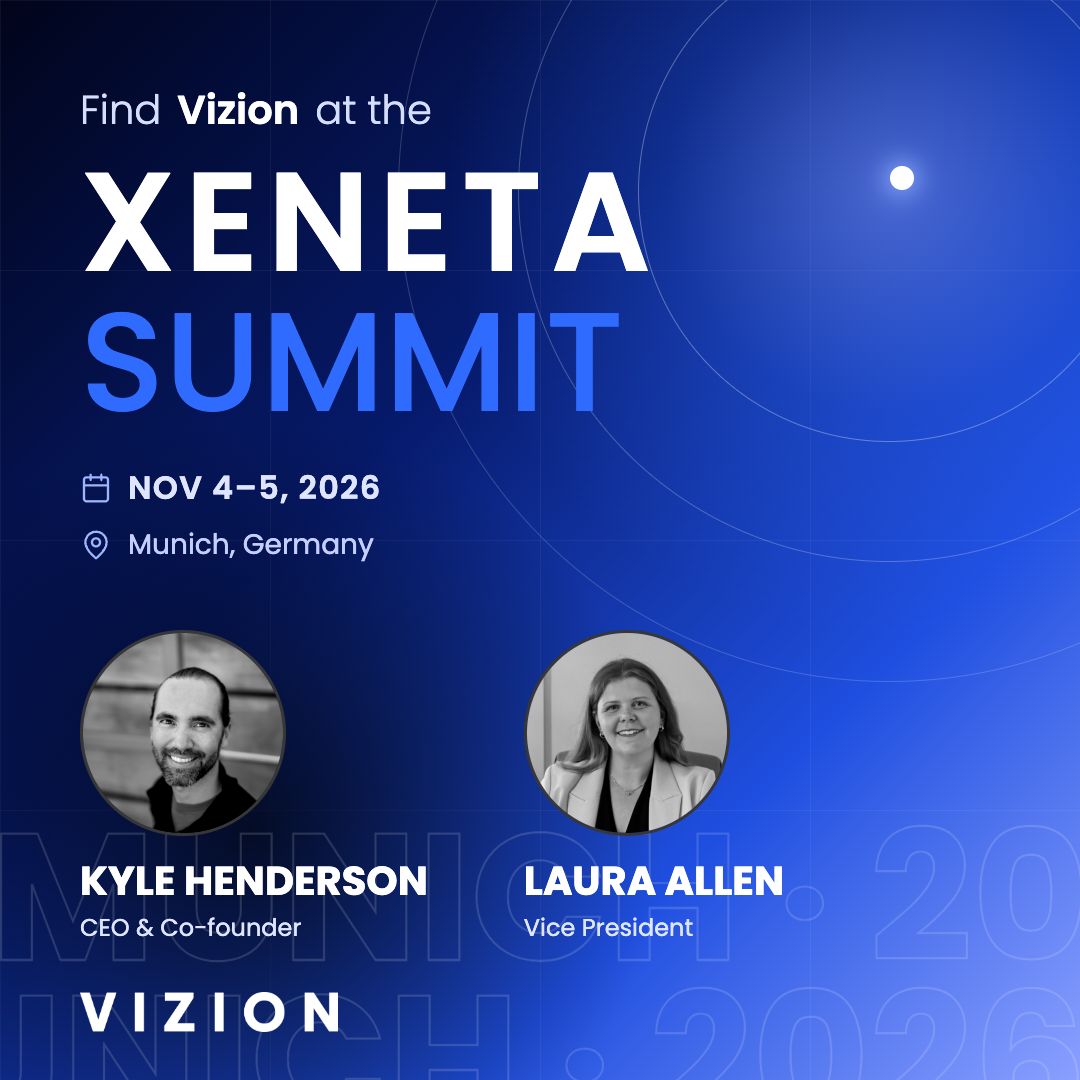
Vizion will be at Xeneta Summit in Munich, November 4-5. Through our partnership with Xeneta, we’re showing buyers what they get for the rate they pay: - Supply and demand: carrier booking demand and acceptance on each lane, plus early indicators of spot rate direction - Disruption risk: signals on booking acceptance, blank sailings, and rollovers at origin and transshipment - Service performance: measured transit times, reliability and exceptions, with services and routings ranked on actual performance We’ll walk through your own lanes with you. Book a time with the team in the comments. #XenetaSummit2026
- LINKEDIN · EVENTRecorded 24 Oct 2026
Port congestion is easing. But are containers actually moving faster? Improving vessel waiting times don't always translate to faster cargo movement. Recent Vizion data from Shanghai and Ningbo reveals a more complicated picture: even as vessel congestion improves, containers can still experience longer dwell times at terminals. Join us for this week's TradeView Live: Port Congestion vs. Container Delays and What Data Reveals. We'll take a global look at port performance across Asia, Europe, and North America to explore: 📊 Where port performance is improving and where delays are increasing 🚢 The difference between vessel congestion and container dwell times ⏱️ What these trends mean for global supply chains 🔎 How to monitor port conditions with Vizion's Port Dwell Performance Tracker Are improving congestion reports telling the full story? Join us as we go beyond the headlines and into the data. Register below. #portperformance #supplychainvisibility #oceanfreight #logistics
- LINKEDIN · IMAGERecorded 16 Oct 2026
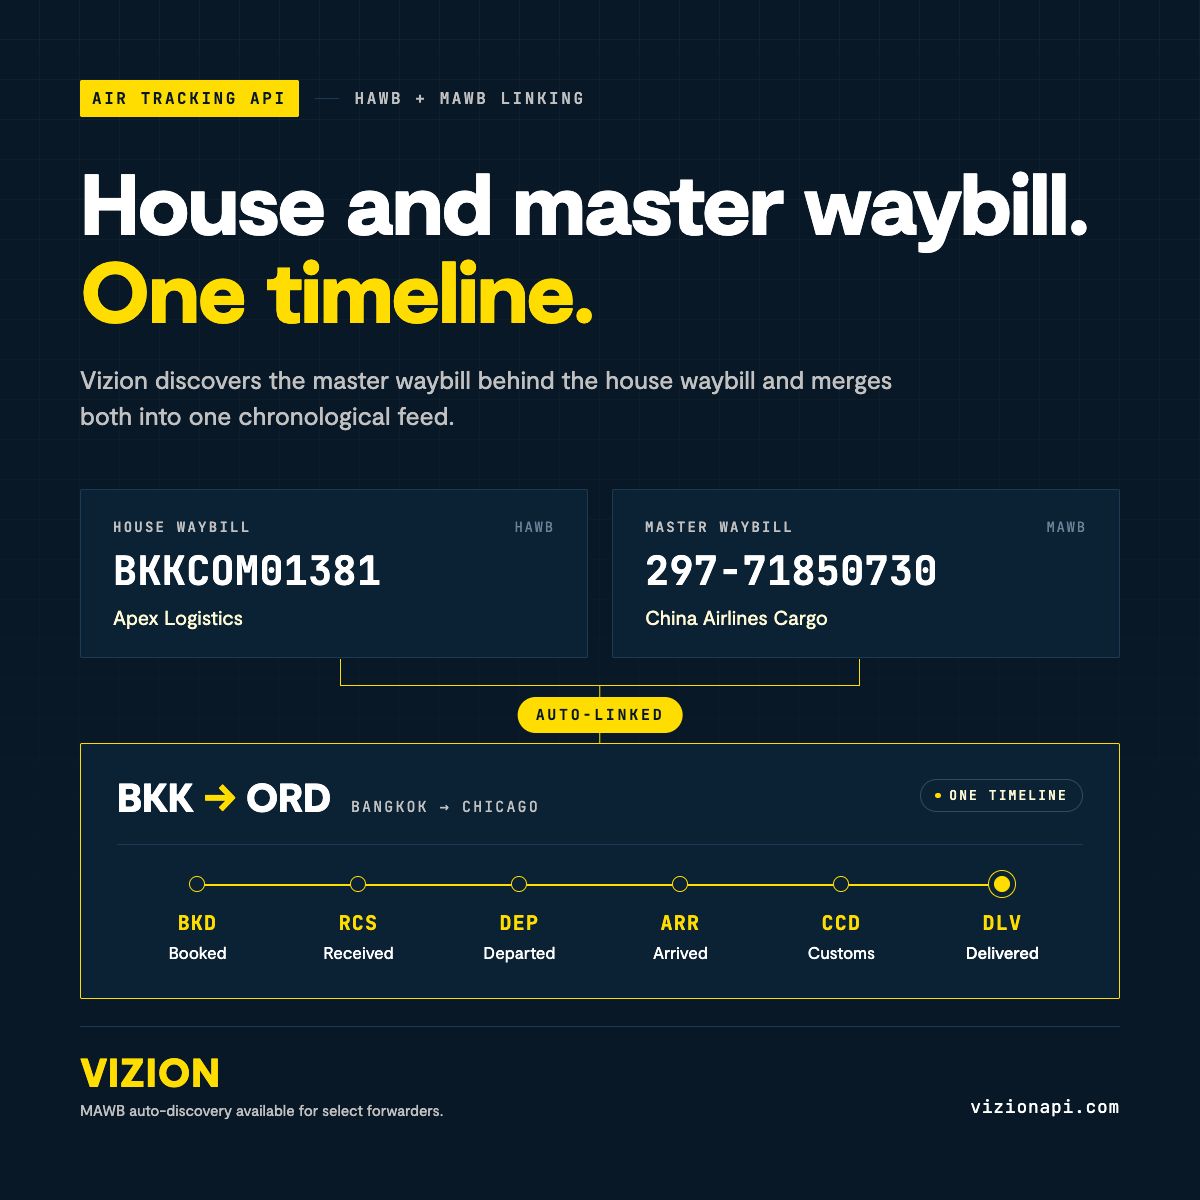
House and master air waybill, one timeline. Register a HAWB with Vizion Air Tracking and, for select forwarders, Vizion finds the master waybill behind it automatically. Forwarder milestones and airline flight events merge into one chronological timeline, from booking through customs clearance and delivery. 29 airline and forwarder connections. Standardized event codes. Active shipments checked at least hourly.
- LINKEDIN · IMAGERecorded 16 Oct 2026
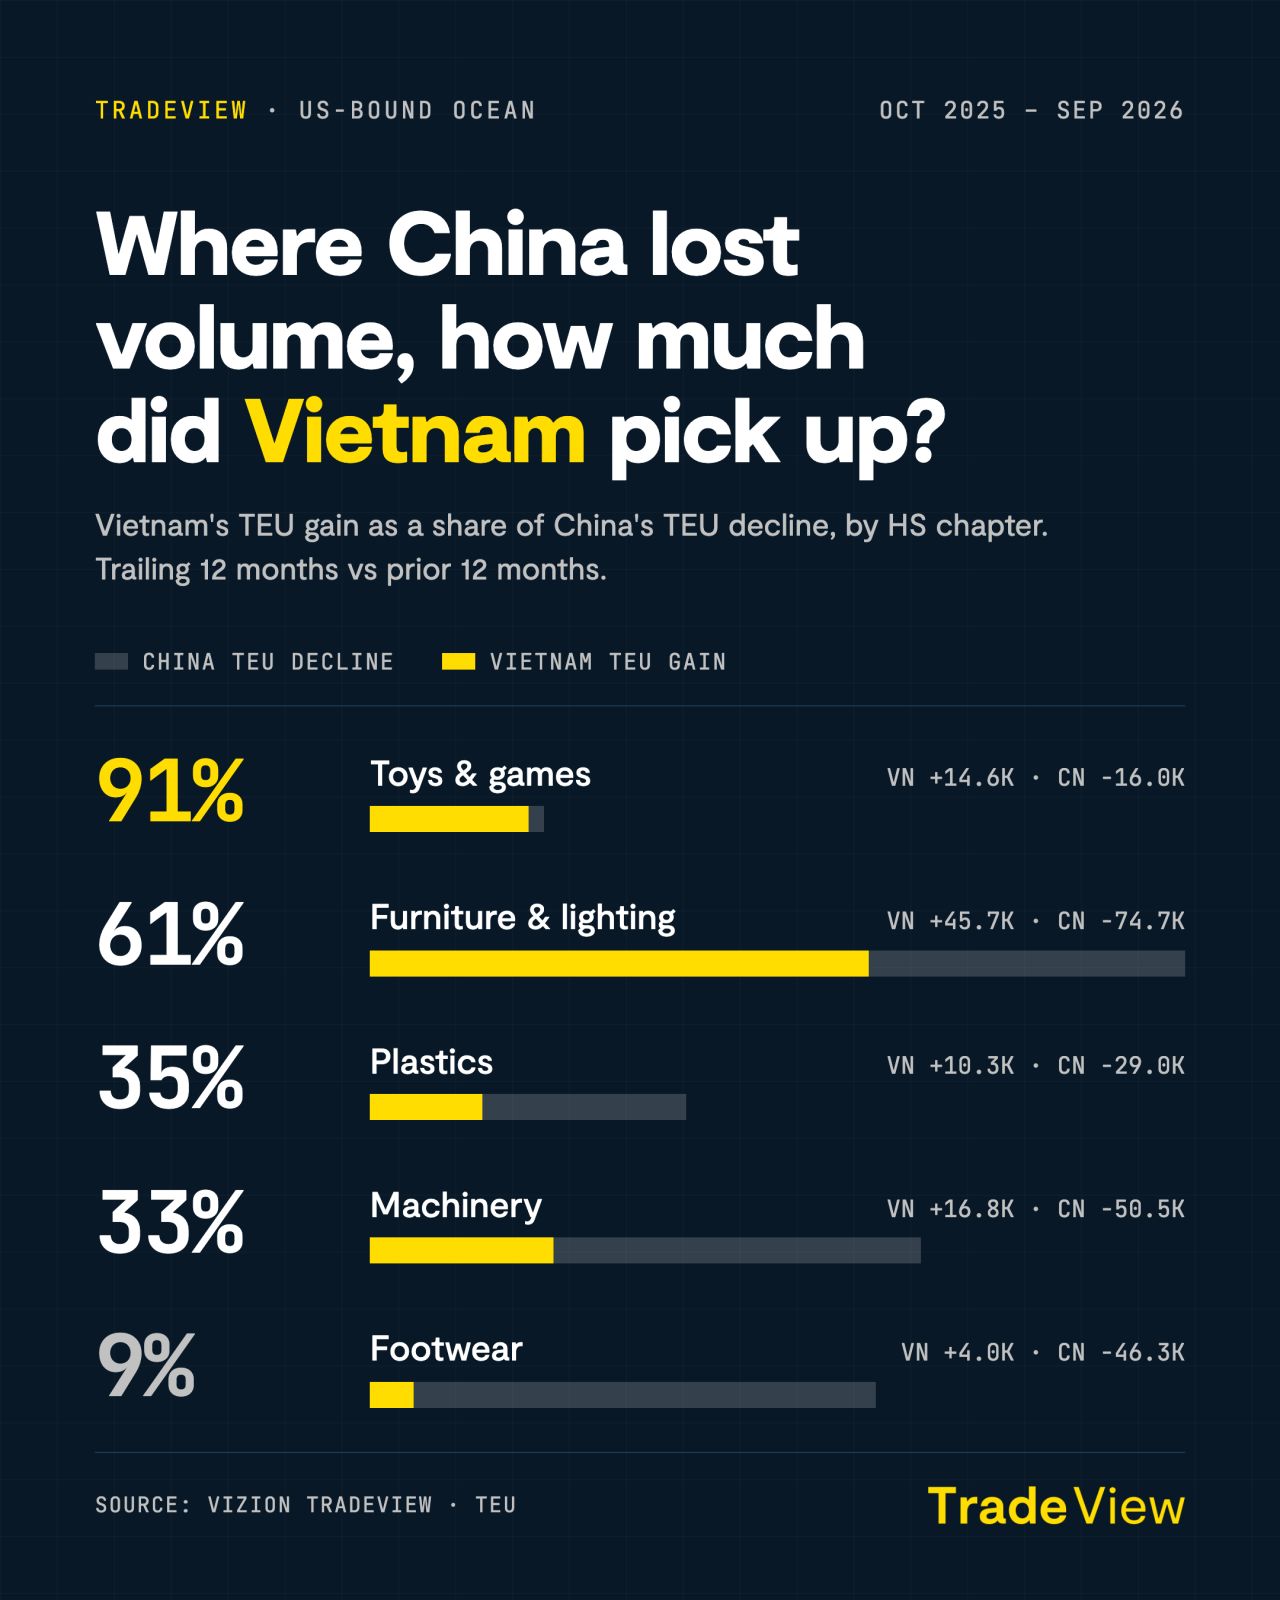
China lost US-bound ocean volume across every major consumer and industrial category over the past 12 months. Vietnam picked up part of it, and much more in some categories than others. Share of China’s decline matched by Vietnam’s gain: Toys: 91% Furniture: 61% Plastics: 35% Machinery: 33% Footwear: 9% Electrical machinery: 7% China shipped 46,300 fewer TEU of footwear and 50,600 fewer TEU of electrical machinery. Vietnam added 4,000 and 3,700. Category overlap shows where volume moved, not which buyers moved it.
- LINKEDIN · IMAGERecorded 9 Oct 2026
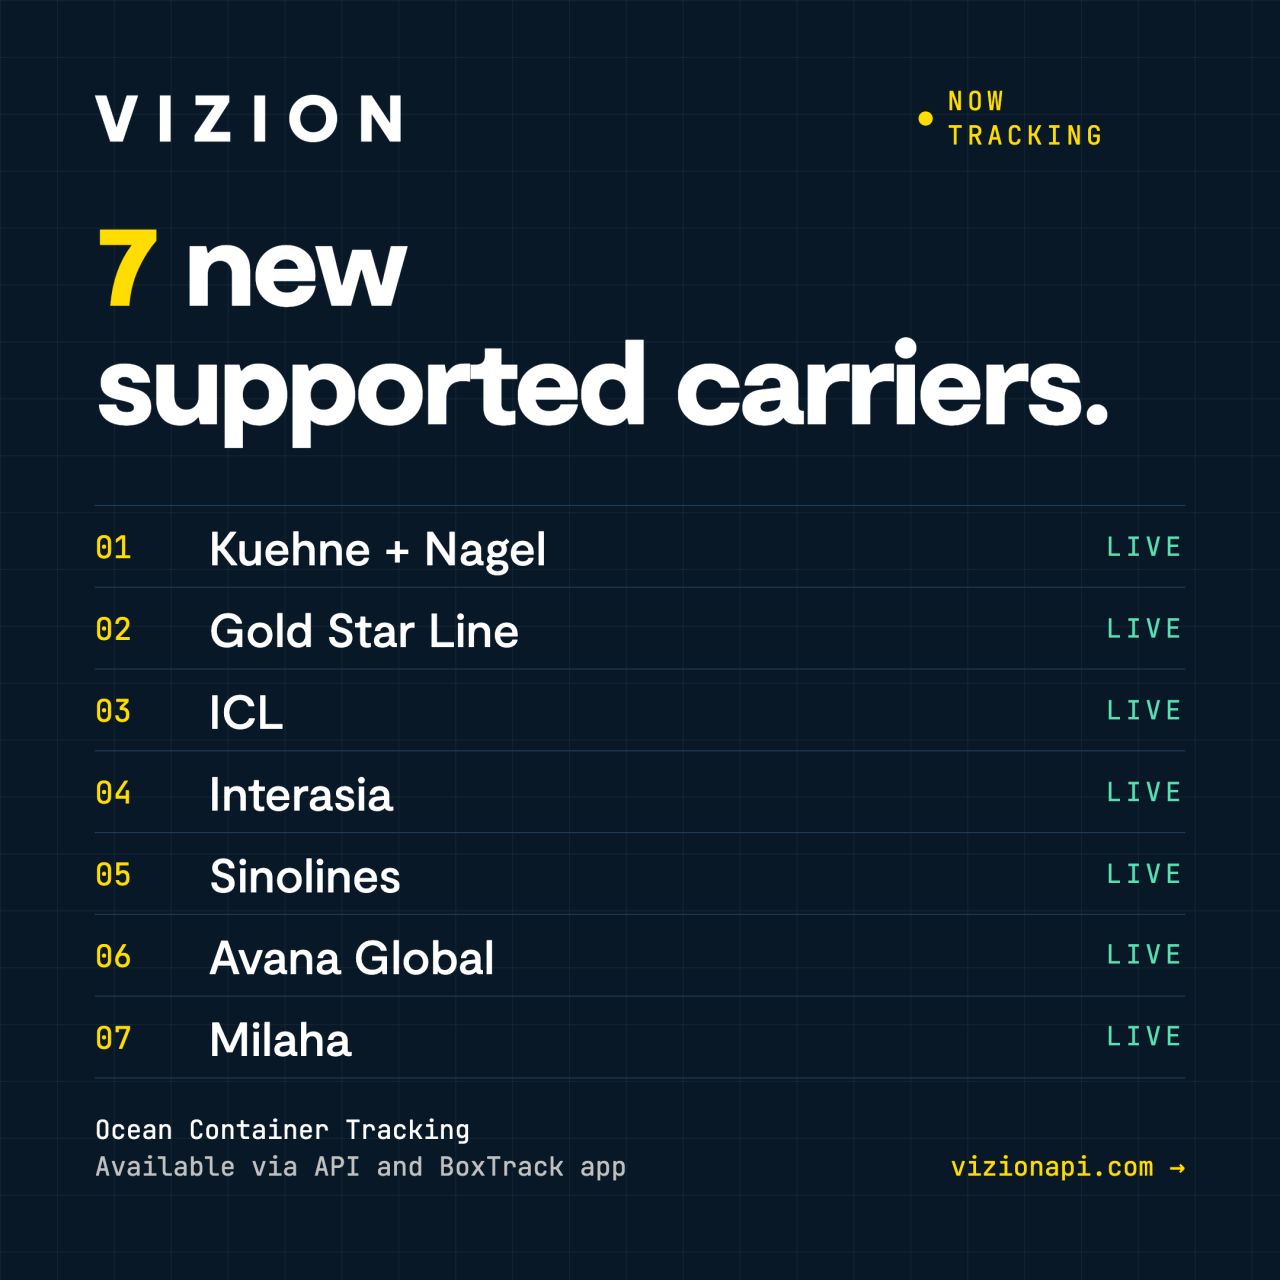
7 new carriers and partners are now live for ocean container tracking on Vizion! Kuehne + Nagel Gold Star Line ICL Interasia Sinolines Avana Global Milaha Container events from all 7 are available today through the API and in the BoxTrack app. No new integration work needed for existing customers. Just start tracking. #containertracking #supplychainvisibility #VizionAPI
- LINKEDIN · IMAGERecorded 2 Oct 2026
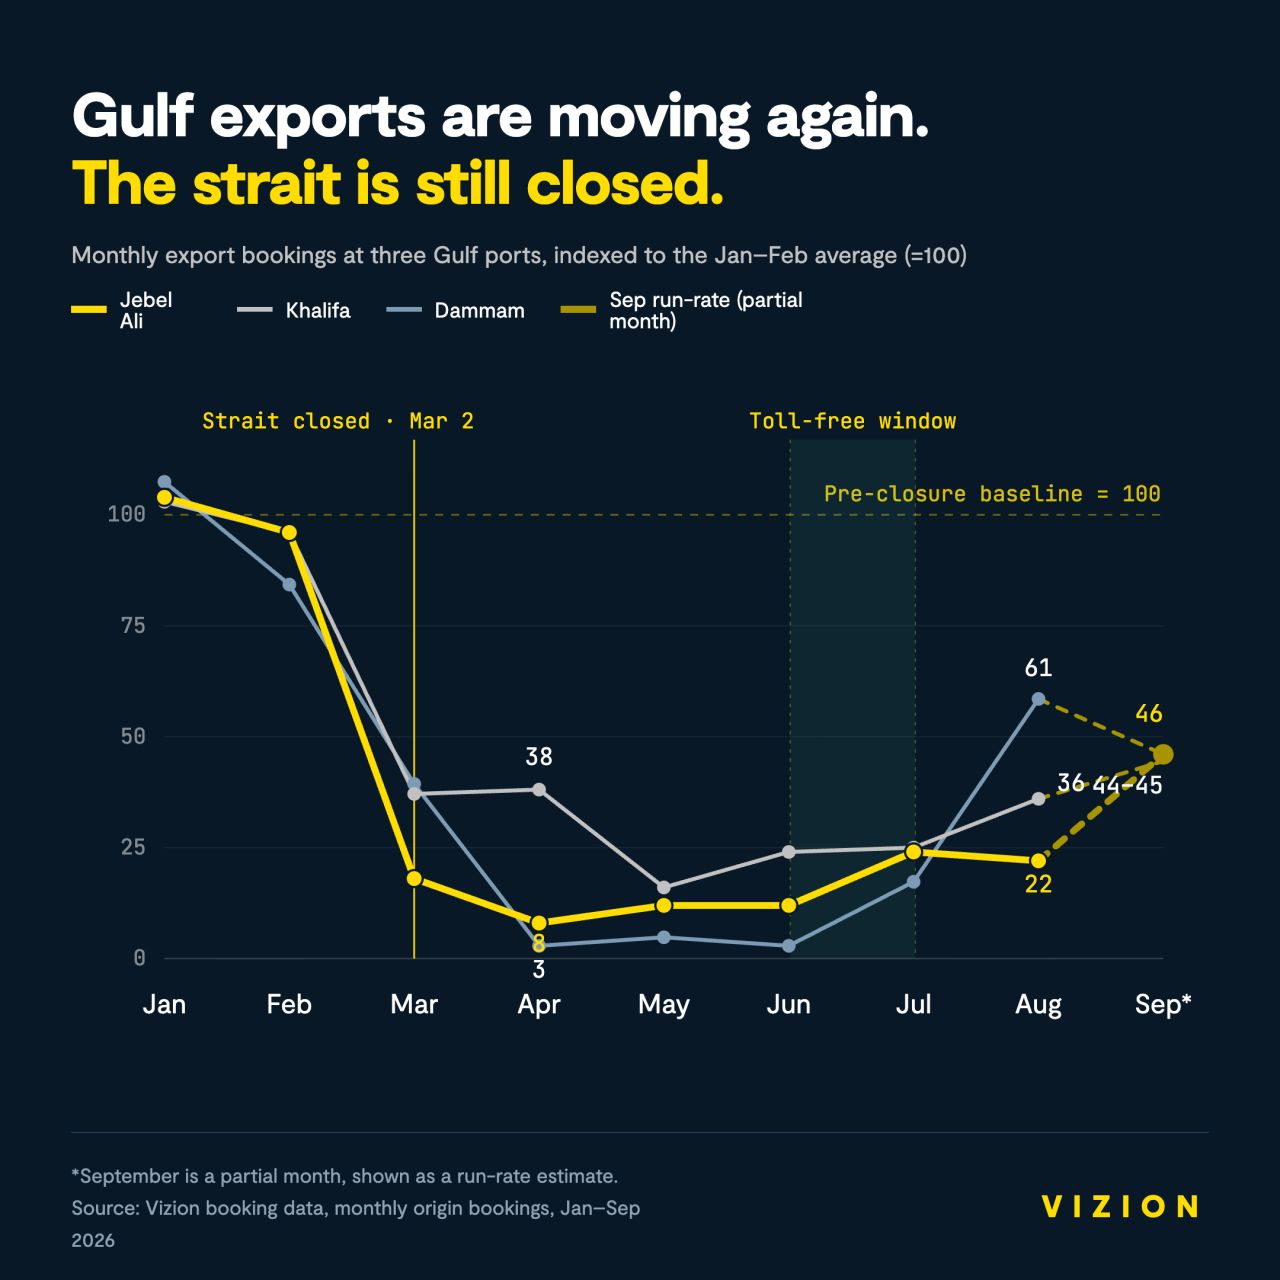
The split in the Gulf's export data is geographic, and it is exact. August export bookings vs the pre-closure baseline: Inside the strait: Jebel Ali -78%, Khalifa -64%, Dammam -39%, Jubail -97%. Outside it: Jeddah +113%, Salalah +138%, King Abdullah Port +110%, Sohar +34%. Saudi Arabia sits on both sides of that ledger. Dammam, on its Gulf coast, is still down 39%. Jeddah, on its Red Sea coast, has more than doubled as the land bridge carries export volume west. Same country, same cargo owners, opposite trajectories. The variable that decides a port's year: which side of Hormuz the berth sits on. The Omani ports carry the second story. Salalah and Sohar sit outside the strait and both are running well above baseline as Gulf cargo reaches deep-water services by relay.

6 of 22 adsSign up to see every VIZION ad, filter by format and date, and get alerts on new ones.
See all 22 adsWatch the companies you care about.
Filter every ad by industry, country, format and network, and get alerts when a company you watch starts running new ads.