On air · 1 of 3 networks
Statista
- statista.com
- DE
- 1,255 employees
Statista’s ads on LinkedIn, Meta and Google, recorded by adsrunning. Browse the latest here for free. Sign up free to see all 332. Watch Statista with Starter to get each new one in your feed.
Watchlist with Starter · $49/mo
| Network | Status | Live ads | Nov 2025LinkedIn activity · 52 weeksOct 2026 | Checked | Next step |
|---|---|---|---|---|---|
| Running | 80 | Checked 29 Oct 2026 | See all 332 ads → | ||
| Meta | None recorded | 0 | No active ads recorded on the Meta Ad Library | Checked 26 Oct 2026 | Collect them with the API → |
| Recently | 67 | Ads on the Google Ads Transparency Center | Checked 10 Oct 2026 | Collect them with the API → |
Statista has 80 live LinkedIn ads. Its Facebook page had no active ads on 26 Oct 2026, and we recorded 67 Google ads on 10 Oct 2026.
Latest ads
- LINKEDIN · IMAGESince 27 Oct 2026
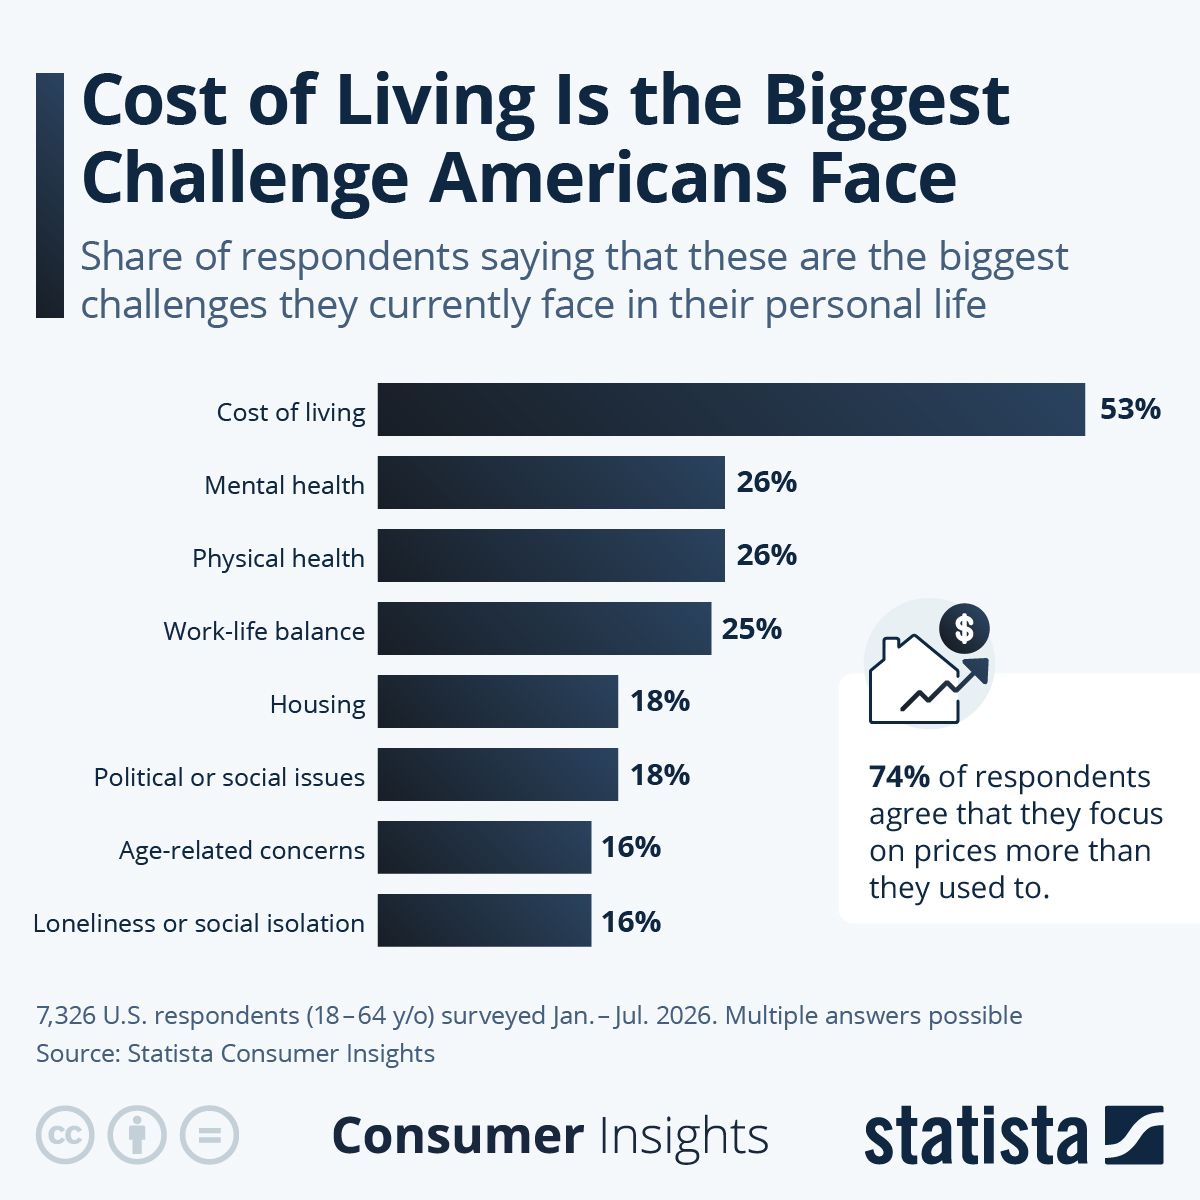
The war in Iran marked a significant setback in Americans' year-long battle with high prices. While inflation has long come down from its 2021/2022 highs, when it peaked at 9 percent, it remains elevated at 3.4 percent. More importantly though, people are still struggling to cope with the lasting effects of the inflation crisis. According to a Statista Consumer Insights survey conducted between January and July 2026, 53 percent of U.S. adults said that the high cost of living was one of the biggest challenges they currently face – making it by far the most common answer ahead of mental and physical health at 26 percent each. It is a common misconception that prices come down when inflation cools, when in reality a period of high inflation leaves a legacy of high prices. According to the Bureau of Labor Statistics, U.S. consumer prices have increased 26.7 percent since January 2021, with some categories seeing even steeper price increases than that. Food prices are up 27.2 percent, rents have increased more than 30 percent and transportation prices are up 35 percent. And yet, nominal wages have only grown 25.7 percent since January 2021, leaving many people worse off than they were five years ago.
- LINKEDIN · IMAGESince 27 Oct 2026
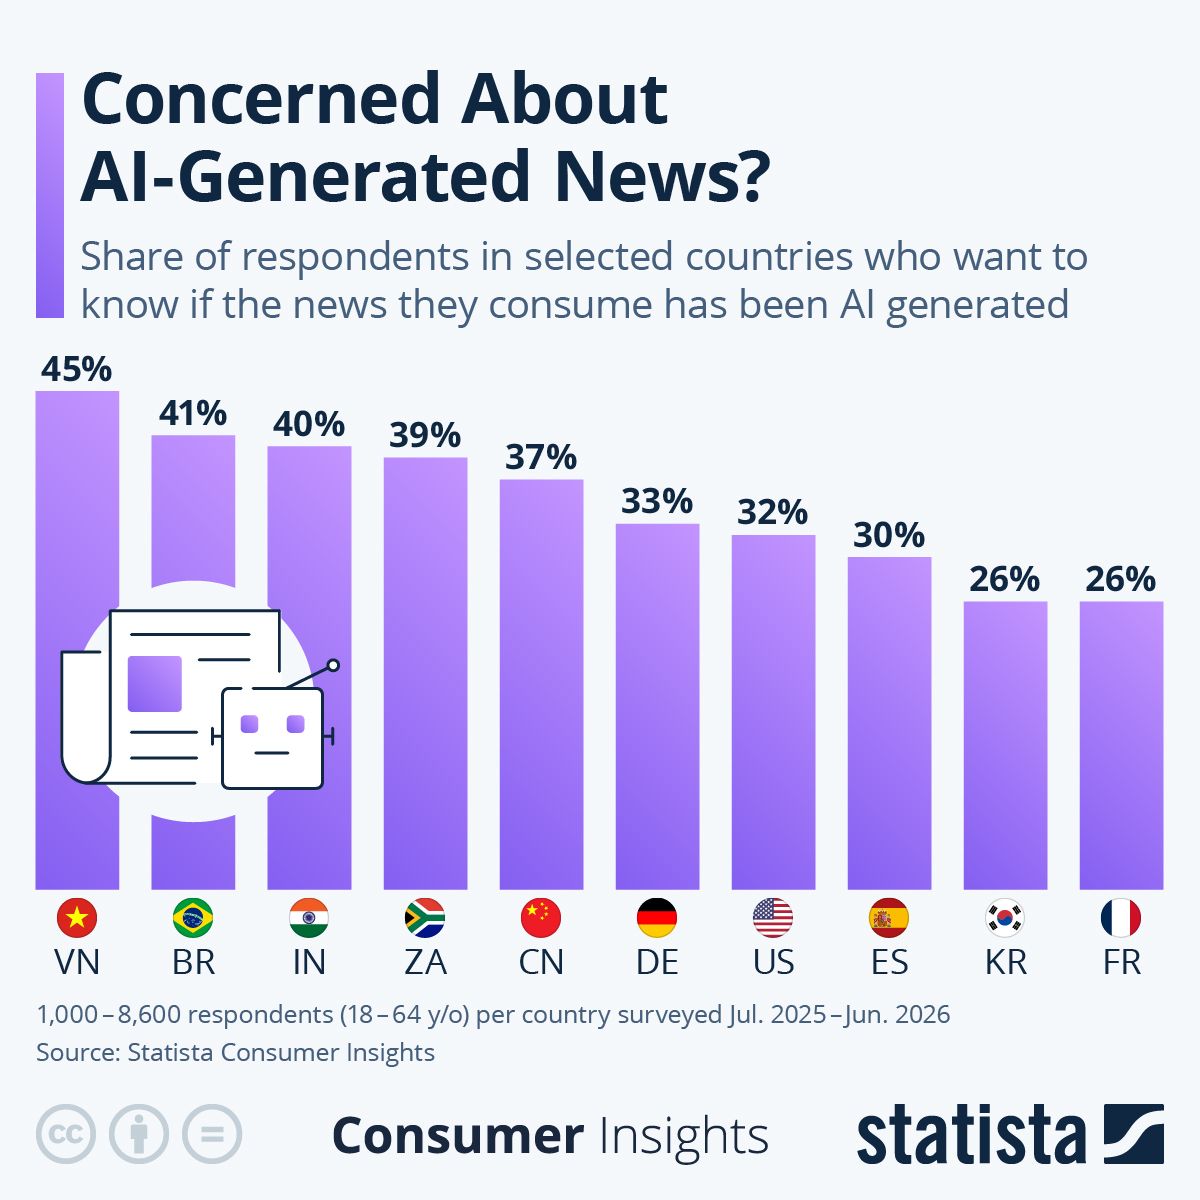
In a survey of 32 countries carried out by Statista Consumer Insights, a majority of respondents indicated that they were not overly concerned about AI-generated news. There was variation between nations, however, as between 16 percent and 45 percent of respondents said they would want to know if the news they consumed was AI generated in a multi-pick question. As part of the same question, respondents were asked, among others, if they worried about mainstream media news being manipulated, which between 24 percent and 51 percent said they did. The least interest in finding out about the potential AI-generated origins of their news was detected in Latin American countries Argentina and Colombia as well as in South Korea and Japan. In these locations, between 16 percent and 26 percent of people said they would want to know if AI wrote their news. This was followed by France, the Netherlands, Belgium and Mexico at 26–29 percent. The biggest concern was registered in Vietnam at 45 percent, Malaysia and the Philippines at 41–42 percent as well as Brazil, also at 41 percent. Meanwhile, even fewer people did in fact use AI proactively to write their news. In a separate survey by Reuters in 45 countries, only between 4 percent and 14 percent of respondents said they ask AI chatbots to display news for them.
- LINKEDIN · IMAGESince 27 Oct 2026
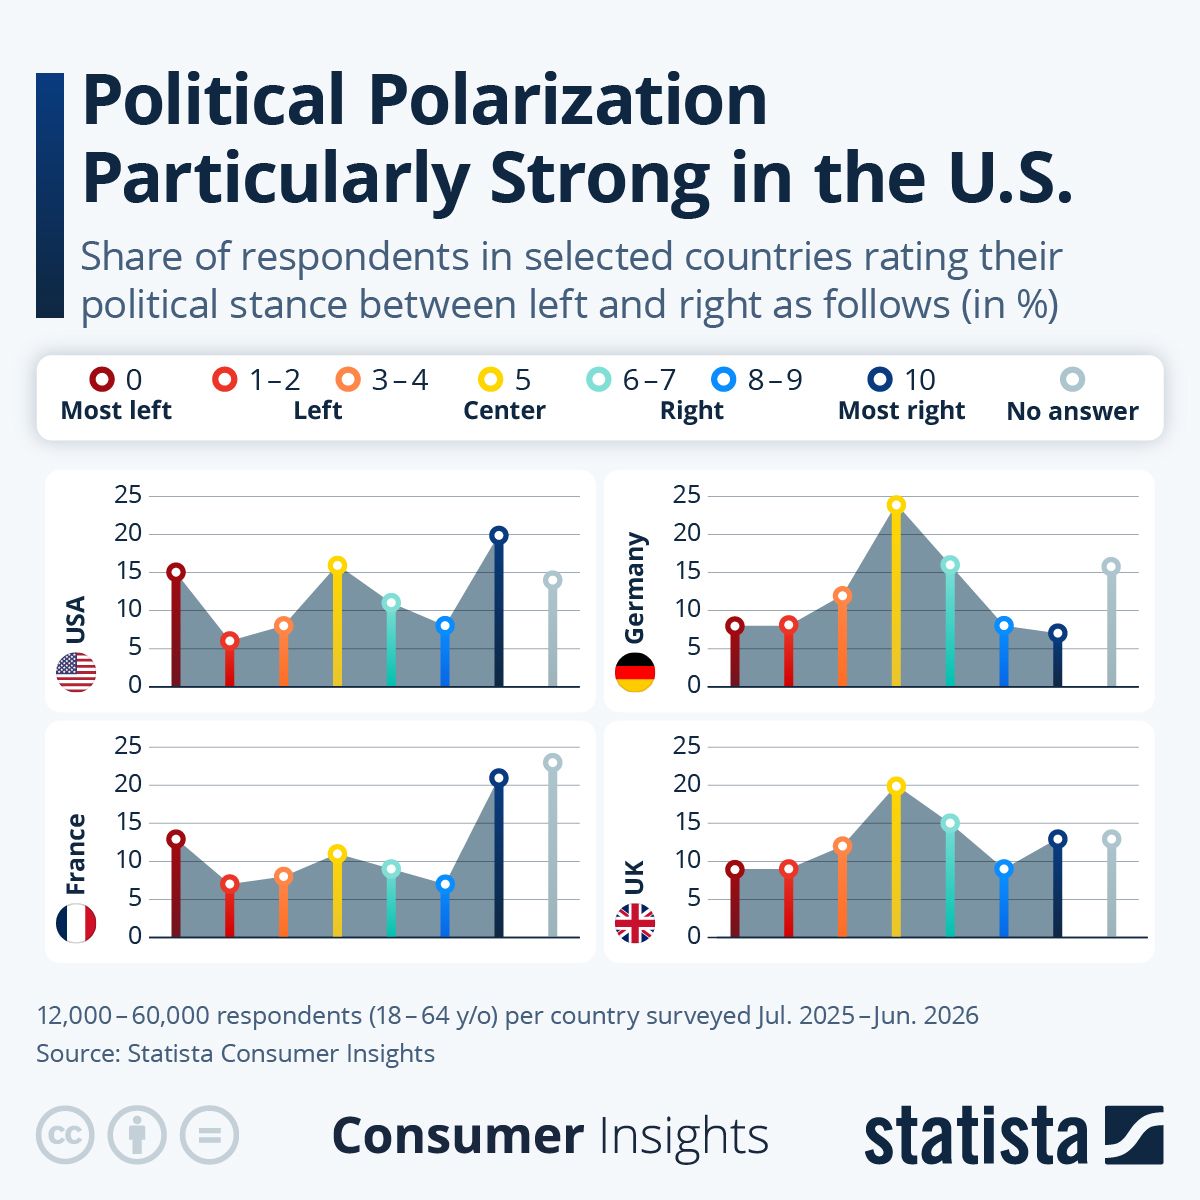
Find more valuable insights with Statista Consumer Insights, here: https://lnkd.in/ez-t93Nq The share of people who consider themselves on the far left or far right of the political spectrum is particularly high in the United States, according to a survey by Statista Consumer Insights. Among U.S. respondents surveyed between July 2025 and June 2026, 15 percent placed themselves on the far left (0 on a 10-point scale) and 20 percent on the far right (10 on the same 10-point scale). By comparison, only 8 and 7 percent of Germans placed themselves at the extreme left and right of the scale, whereas 24 percent idetified as firmly centrist versus 16 percent of Americans. In France, centrism is least prevalent, with just 11 percent identifying as such, while 13 percent place themselves on the far left and a notable 21 percent on the far right. It is also worth noting that 23 percent of surveyed French adults preferred not to answer, compared with 14 to 16 percent in the other countries studied. While similar shares of French and U.S. respondents identify with the left and right overall, positions at the far ends of the spectrum are slightly more pronounced in the United States. Attitudes in the United Kingdom broadly mirror those in Germany, though with a more pronounced shift toward the far-right end of the spectrum.
- LINKEDIN · IMAGESince 27 Oct 2026
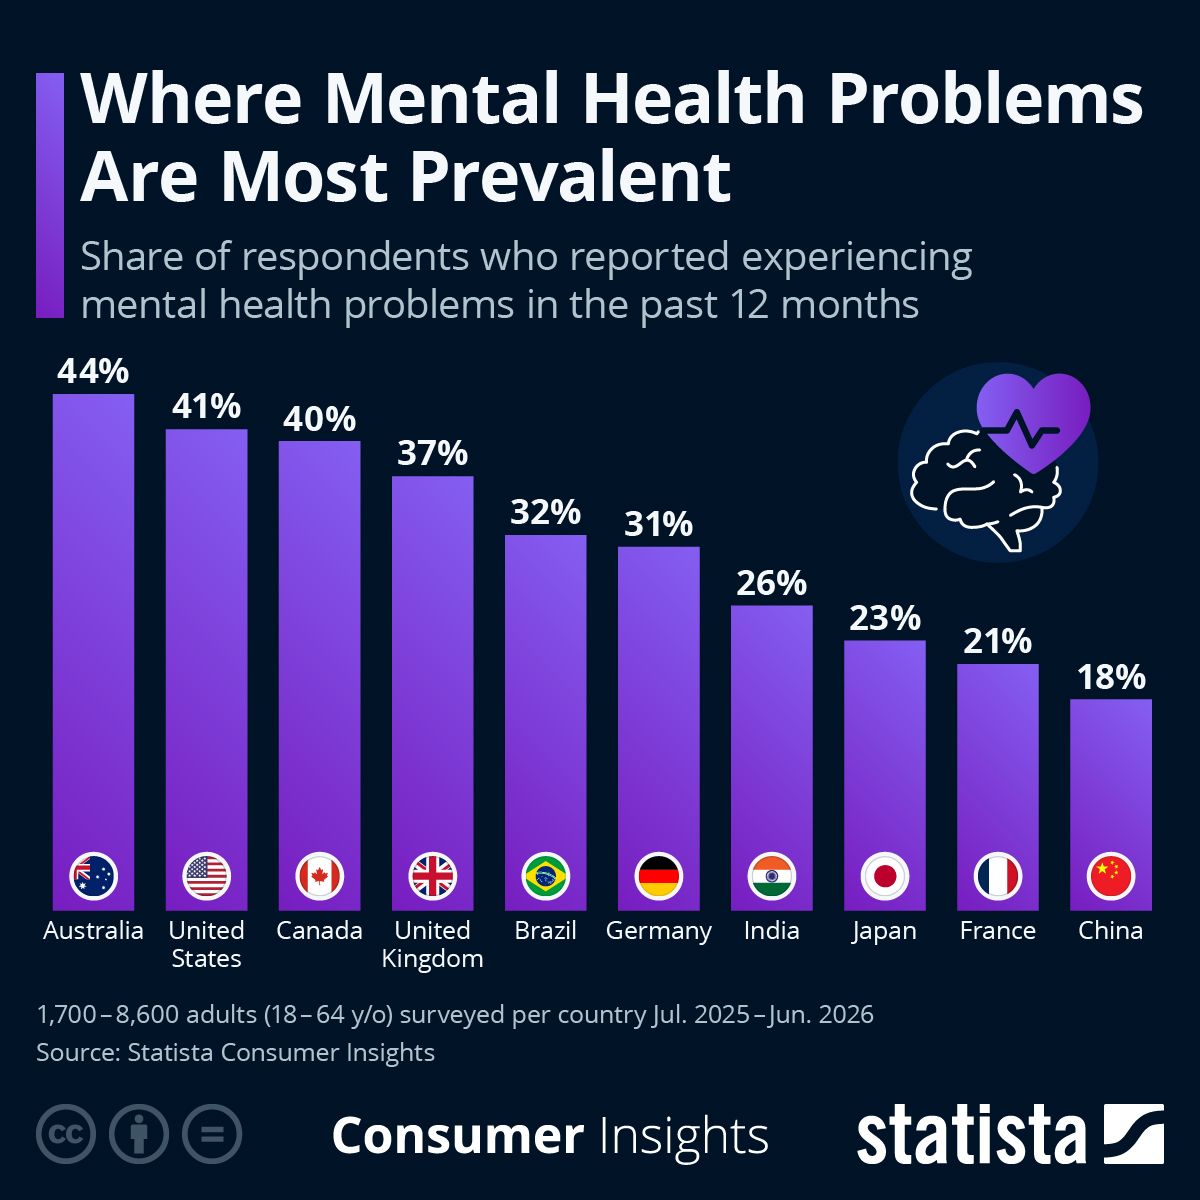
Over the past few years, a lot of progress has been made in accepting and understanding mental health problems. Having long been seen as a sign of weakness, mental health issues in their many varieties and severities have become much less of a taboo. The pandemic, which left many people feeling isolated, powerless or overwhelmed, accelerated that trend, as it not only caused a spike in symptoms of anxiety or depression, but also brought more people to open up about their problems. According to Statista Consumer Insights, roughly 4 in 10 adults in countries like Australia, the U.S. and Canada reported that they had experienced mental health problems, such as stress, anxiety or depression, in the 12 months preceding the survey, making an open discourse about the issue all the more important. As our chart shows, the prevalence of self-reported mental health problems varies greatly across countries, suggesting that people in some countries, e.g. China or Japan, may be more hesitant to open up about mental health or simply less likely to identify certain problems as mental health issues. If you are feeling overwhelmed, anxious or depressed, please reach out to your family or friends, a mental health professional or contact a crisis line in your area. You are not alone, help is available.
- LINKEDIN · IMAGESince 27 Oct 2026
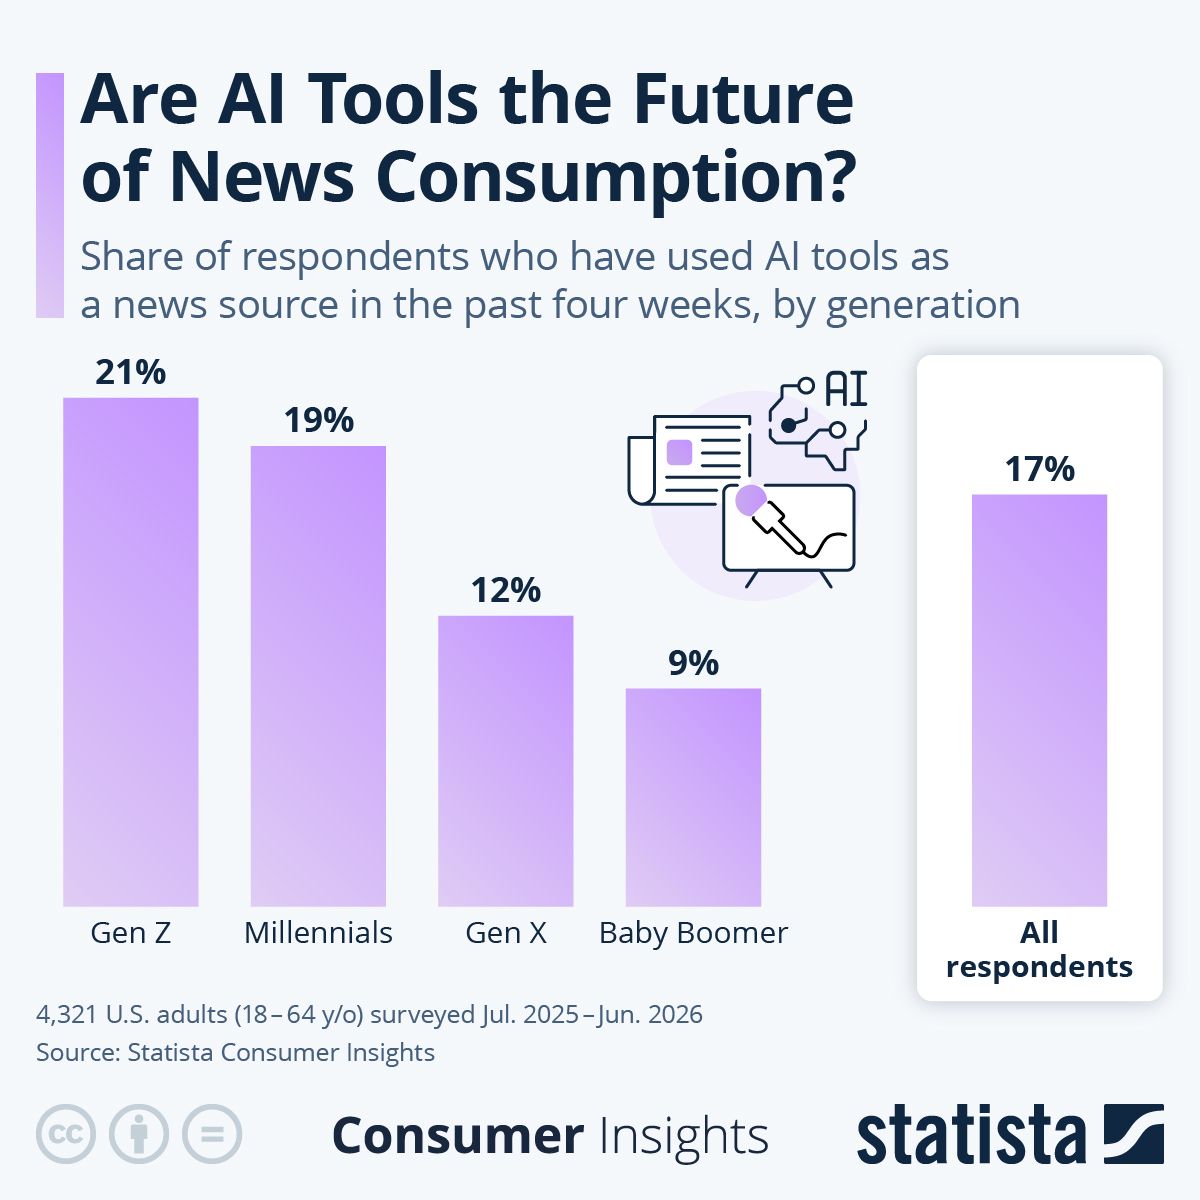
In the wake of social media becoming the number 1 news source for Americans over the past few years, #AI tools are setting out to bring yet another shift in news consumption, particularly for younger audiences. According to Statista Consumer Insights, 17 percent of U.S. adults surveyed said they had used AI tools as a news source in the past four weeks. The share was highest among Gen Z respondents at 21 percent, followed closely by millennials at 19 percent. Older respondents were significantly more hesitant to get news from AI chatbots, which mirrors their generally slower adoption of tools like ChatGPT. Among Gen X respondents, it was 12 percent, while 9 percent of baby boomers reported getting news from AI tools. For publishers, these figures point to another change in how audiences encounter news. While AI tools still trail many other news sources in terms of reach – most importantly social media, video platforms and TV – they will likely establish themselves as an important route to information going forward. The challenge for news organizations is to adapt to that emerging habit while giving readers a reason to seek out the original reporting, context and opinion behind the quick answers they may receive from an AI chatbot.
- LINKEDIN · IMAGESince 27 Oct 2026
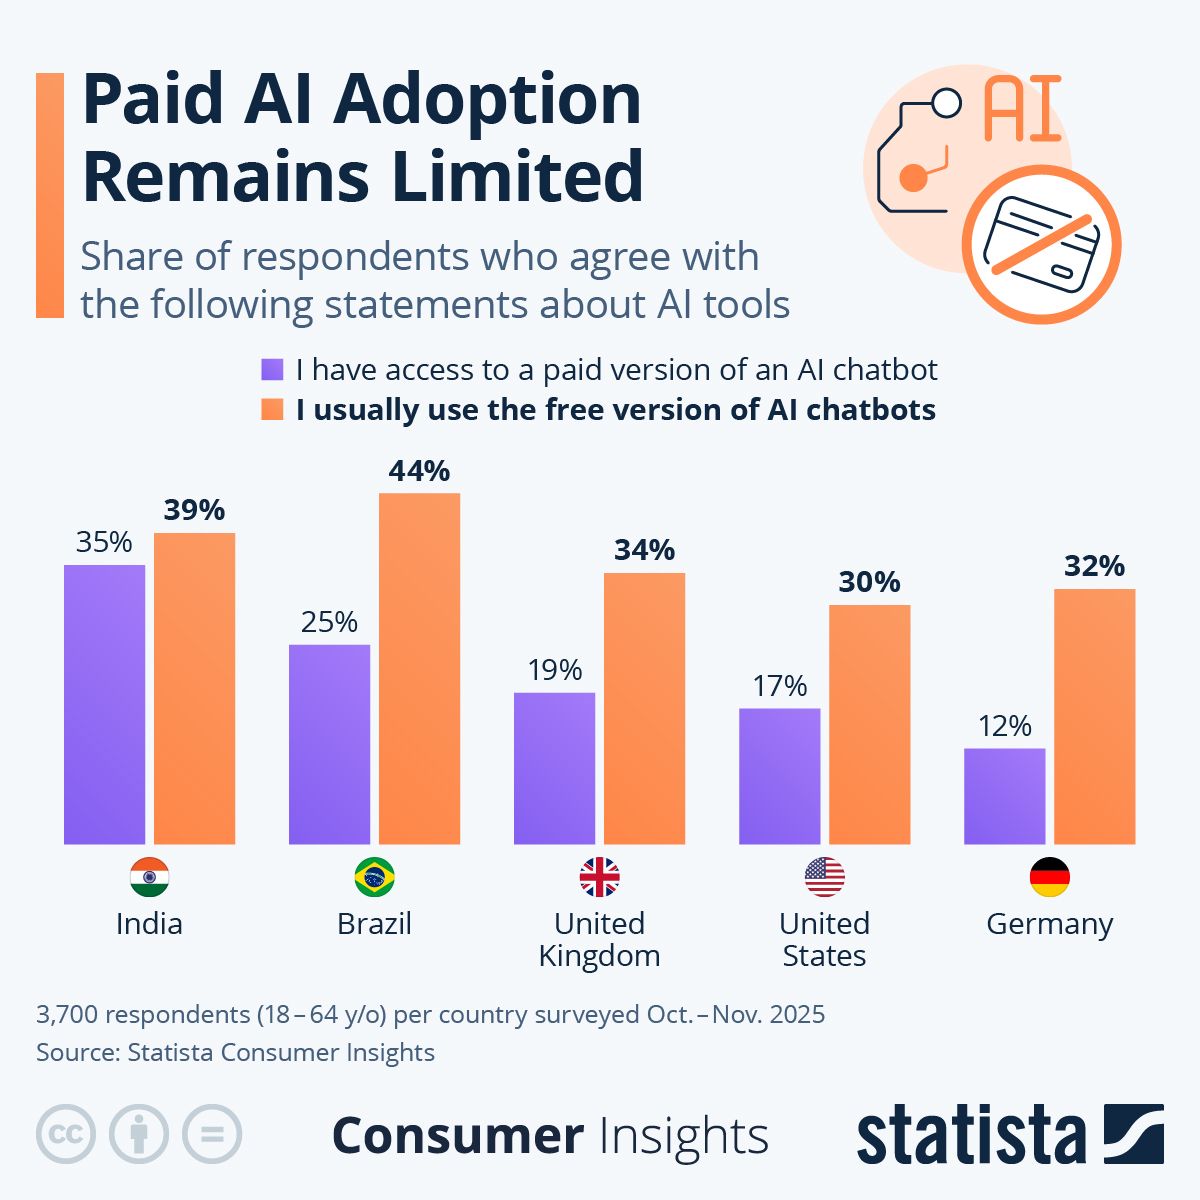
NVIDIA’s latest results once again underlined that the AI boom shows no signs of slowing down. Last quarter, the company returned to triple-digit growth, doubling revenue and net income, the latter already exceeding $100 billion halfway through the current fiscal year. And yet, behind the extraordinary spending on chips and data centers looms a harder question: when and how will all that investment pay off? One reason for the skepticism is that much of the AI economy still looks suspiciously circular. Hyperscalers are investing hundreds of billions of dollars to build AI data centers, fueling Nvidia’s extraordinary growth. Nvidia partially invests those billions in AI companies who in turn use that money to rent computing power from the aforementioned hyperscalers. What’s missing in this equation is an influx of money from outside of this loop or at least a clear idea where this money will eventually come from. As of today, many of the most popular AI tools – at least the consumer-facing ones – remain free to use to a certain extent, raising the question of who is footing the bill. Survey data from Statista Consumer Insights confirms this observation. In all five markets surveyed, respondents were significantly more likely to say they usually use free AI chatbots than to have access to a paid version. The difference is particularly pronounced in Brazil, Germany and the United States – suggesting that widespread experimentation with AI has not yet translated to willingness to pay for it. Click here for more: https://lnkd.in/ePtm2iiz
6 of 332 adsSign up to see every Statista ad, filter by format and date, and get alerts on new ones.
See all 332 adsWatch the companies you care about.
Filter every ad by industry, country, format and network, and get alerts when a company you watch starts running new ads.