On air · 1 of 3 networks
Polar Analytics 🐻❄️
- polaranalytics.com
- FR
- 36 employees
Polar Analytics 🐻❄️’s ads on LinkedIn, Meta and Google, recorded by adsrunning. Browse the latest here for free. Sign up free to see all 345. Watch Polar Analytics 🐻❄️ with Starter to get each new one in your feed.
Watchlist with Starter · $49/mo
| Network | Status | Live ads | Nov 2025LinkedIn activity · 52 weeksOct 2026 | Checked | Next step |
|---|---|---|---|---|---|
| Running | 9 | Checked 29 Oct 2026 | See all 345 ads → | ||
| Meta | Not checked | — | |||
| Recently | 100+ | Ads on the Google Ads Transparency Center | Checked 16 Oct 2026 | Collect them with the API → |
Polar Analytics 🐻❄️ has 9 live LinkedIn ads. We recorded 100+ Google ads on 16 Oct 2026.
Latest ads
- LINKEDIN · IMAGESince 21 Oct 2026
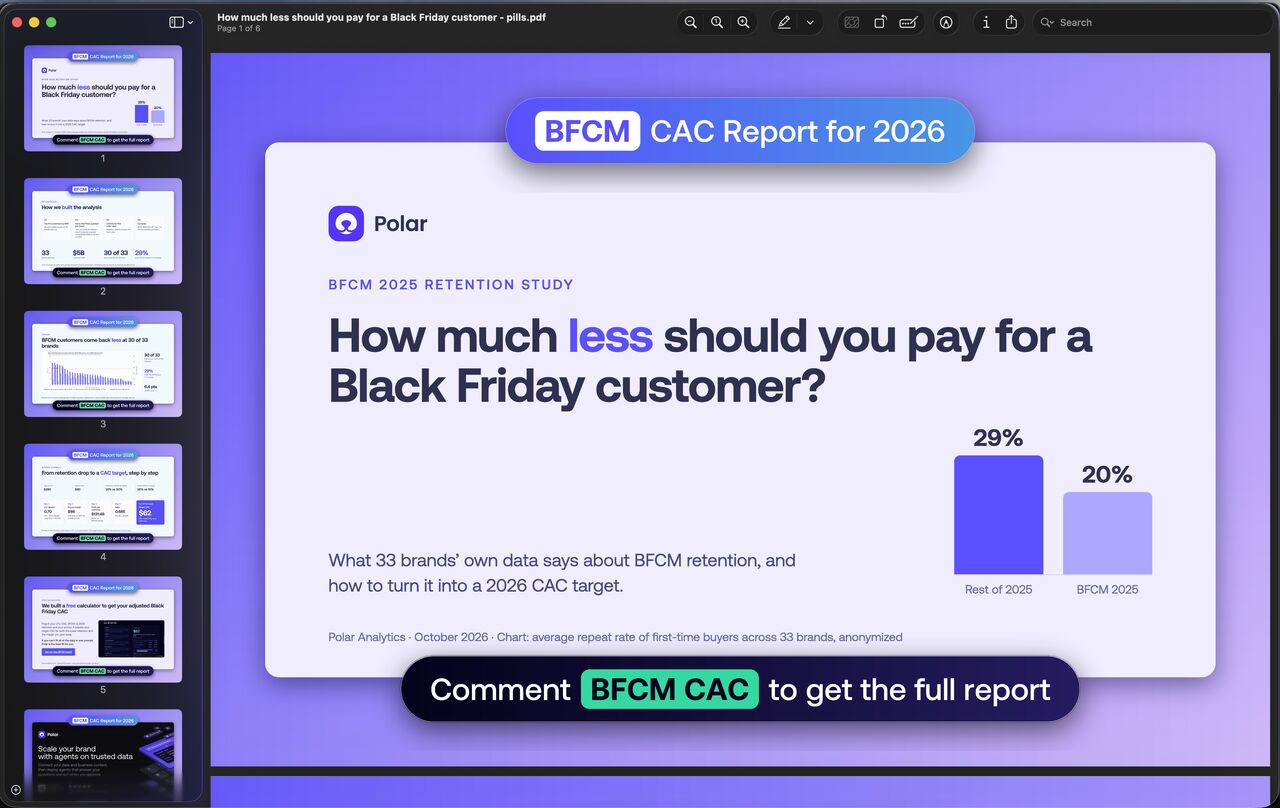
I looked at Black Friday retention across 33 top brands. Almost $5B in GMV. Retention rates averaged 29% lower. And almost nobody adjusts their CAC targets for this. Because there are two discounts to account for: - The offer you run - The lower retention of the customers you acquire I turned the full study into one report: → Do Black Friday buyers come back as often as everyone else? → How many brands saw a drop, and how big was it? → How much less should we pay per Black Friday customer? You get: the 33-brand data, a step-by-step worked example, and a calculator for your own numbers.
- LINKEDIN · VIDEOSince 20 Oct 2026
We looked at Black Friday retention across 33 top brands. Almost $5B in GMV. Retention rates averaged 29% lower. And almost nobody adjusts their CAC targets for this. Because there are two discounts to account for: - The offer you run. - The lower retention of the customers you acquire. Obviously, some brands saw little decline. Some had better retention. That’s why your BFCM budget needs your own numbers. I built a calculator to estimate how much you can afford to pay for a Black Friday customer. You input: - Your typical LTV. - Your typical CAC. - Last year’s Black Friday cohort LTV or retention rate. - The promo you plan to run. It estimates your expected LTV and adjusts your target CAC for both the promo and the retention difference. The calculator is free. It comes with a prompt to pull the inputs from your own data. Use it before setting your BFCM CAC target. PS: I pulled this analysis together in 30 minutes because you should be able to get these numbers in one prompt from your own data. And if you can’t fit all your data in one prompt, that is the reason Polar exists 😉
- LINKEDIN · IMAGESince 20 Oct 2026
I'm excited to announce that Polar is officially a Shopify Plus Certified App 🔥 Shopify has vetted Polar to meet the demanding requirements of Shopify Plus merchants. But this announcement is about something bigger than a certification. For years, building a central brain for your retail business meant: Hiring an expensive team of data engineers. Spending months stitching together data from dozens of tools. Building and maintaining a complex data infrastructure. Creating dashboards that only a handful of people could use. Spending even more time making that data accessible to everyone. We believe there's a better way. Every brand deserves a central brain for its business. One where anyone on the team can find the answers they need, without always relying on an analyst. Because the best analytics team isn't the one answering every question. It's the one empowering everyone else to find their own answers. And we're just getting started.
- LINKEDIN · VIDEOSince 20 Oct 2026
I built a free Black Friday tracker in Claude that investigates why your numbers move. Every hour. A senior operator at a $200M fashion brand recently told me: "The data isn't the problem. It's getting to the story behind the data. A human can drill through that once. They can't do it 20 times across 20 different areas. Every hour. For 4 straight days." Connect Claude to your data. Give it your goals, forecast and key metrics. Then every hour, it posts a digest to Slack/Teams/Whatsapp: → Is the data fresh enough to trust? → Where are we vs. forecast? → What moved in the last hour? → What explains the change? Whenever a metric moves, Claude keeps asking: why? Until there's no useful "why" left. You get the evidence. You make the call. Included: the intake prompt, hourly prompt and an example digest. Don't build your Black Friday command center on Black Friday. Set it up in October. Rehearse it once.
- LINKEDIN · IMAGESince 20 Oct 2026
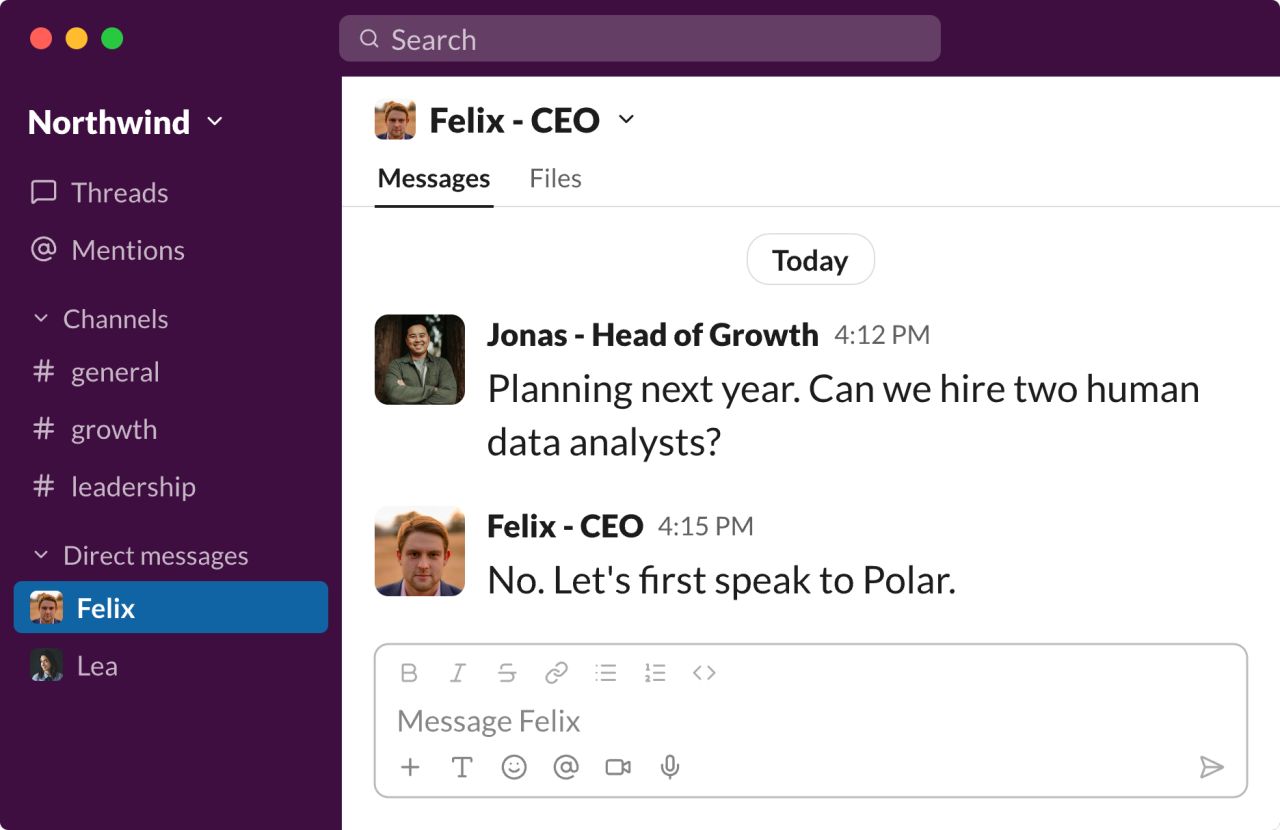
I was on a call with the CEO of a ~$100M business operating across 6 countries. His Head of Growth wanted 2 more data analysts. The CEO had a different idea. “Can we hire 2 more data analysts next year?” “No. Let's speak to Polar first.” Here's what was happening: - Daily reporting consumed the equivalent of 3 full-time employees. - Simple business questions took half a day. Sometimes an entire weekend. - Teams waited 2–4 weeks for answers. - Weekly stock planning required 10 people in a room. 50% data. 50% gut feeling. Here's the playbook we're exploring: 1. Centralize company data in one warehouse. 2. Build a governed front door so everyone can access data they can trust. 3. Connect AI to the business data. Train agents on the company’s rules. 4. Start with the analyses eating up the most hours, with support from our team. 5. Let teams ask questions in plain English instead of waiting for reports. 6. Keep humans responsible for the final decisions. The next generation of companies won't scale by hiring more people to answer questions. They'll give the power to the people closest to the business to answer their own. Fewer reporting bottlenecks. More decisions. More leverage. Smaller teams. Bigger revenue. More products.
- LINKEDIN · VIDEOSince 29 Sept 2026
Introducing Labels. Give AI context on which metrics to use and when. Create them inside Polar or directly from Claude. For data questions, AI can get the calculation right but still pick the wrong metric. When you ask about conversion rate, you mean Shopify’s conversion rate. Your AI might choose the one from Google Analytics. That preference shouldn’t live in someone’s private Claude project or a file on their laptop. It needs to be shared across the company, with permissions controlling who can create and edit it. That’s what Labels are for. How it works: 1. Create your labels. Ask Polar: "Create a Source of Truth label." 2. Assign your metrics. Select the conversion rate, sales, or other metrics your team wants AI to use, and add them to the label. 3. Put that context to work. Build a dashboard using your Source of Truth metrics. Or set up an agent to monitor your chosen conversion rate in Slack. Your team’s preferred metrics become shared context for dashboards, questions, and agents.

6 of 345 adsSign up to see every Polar Analytics 🐻❄️ ad, filter by format and date, and get alerts on new ones.
See all 345 adsWatch the companies you care about.
Filter every ad by industry, country, format and network, and get alerts when a company you watch starts running new ads.