On air · 1 of 3 networks
ODOS Tech
- odostech.com
- ES
- 11 employees
ODOS Tech’s ads on LinkedIn, Meta and Google, recorded by adsrunning. Browse the latest here for free. Sign up free to see all 82. Watch ODOS Tech with Starter to get each new one in your feed.
Watchlist with Starter · $49/mo
| Network | Status | Live ads | Nov 2025LinkedIn activity · 52 weeksNov 2026 | Checked | Next step |
|---|---|---|---|---|---|
| Running | 14 | Checked 31 Oct 2026 | See all 82 ads → | ||
| Meta | Not checked | — | |||
| Recently | 12 | Ads on the Google Ads Transparency Center | Checked 6 Oct 2026 | Collect them with the API → |
ODOS Tech has 14 live LinkedIn ads. We recorded 12 Google ads on 6 Oct 2026.
Latest ads
- LINKEDIN · IMAGESince 27 Oct 2026
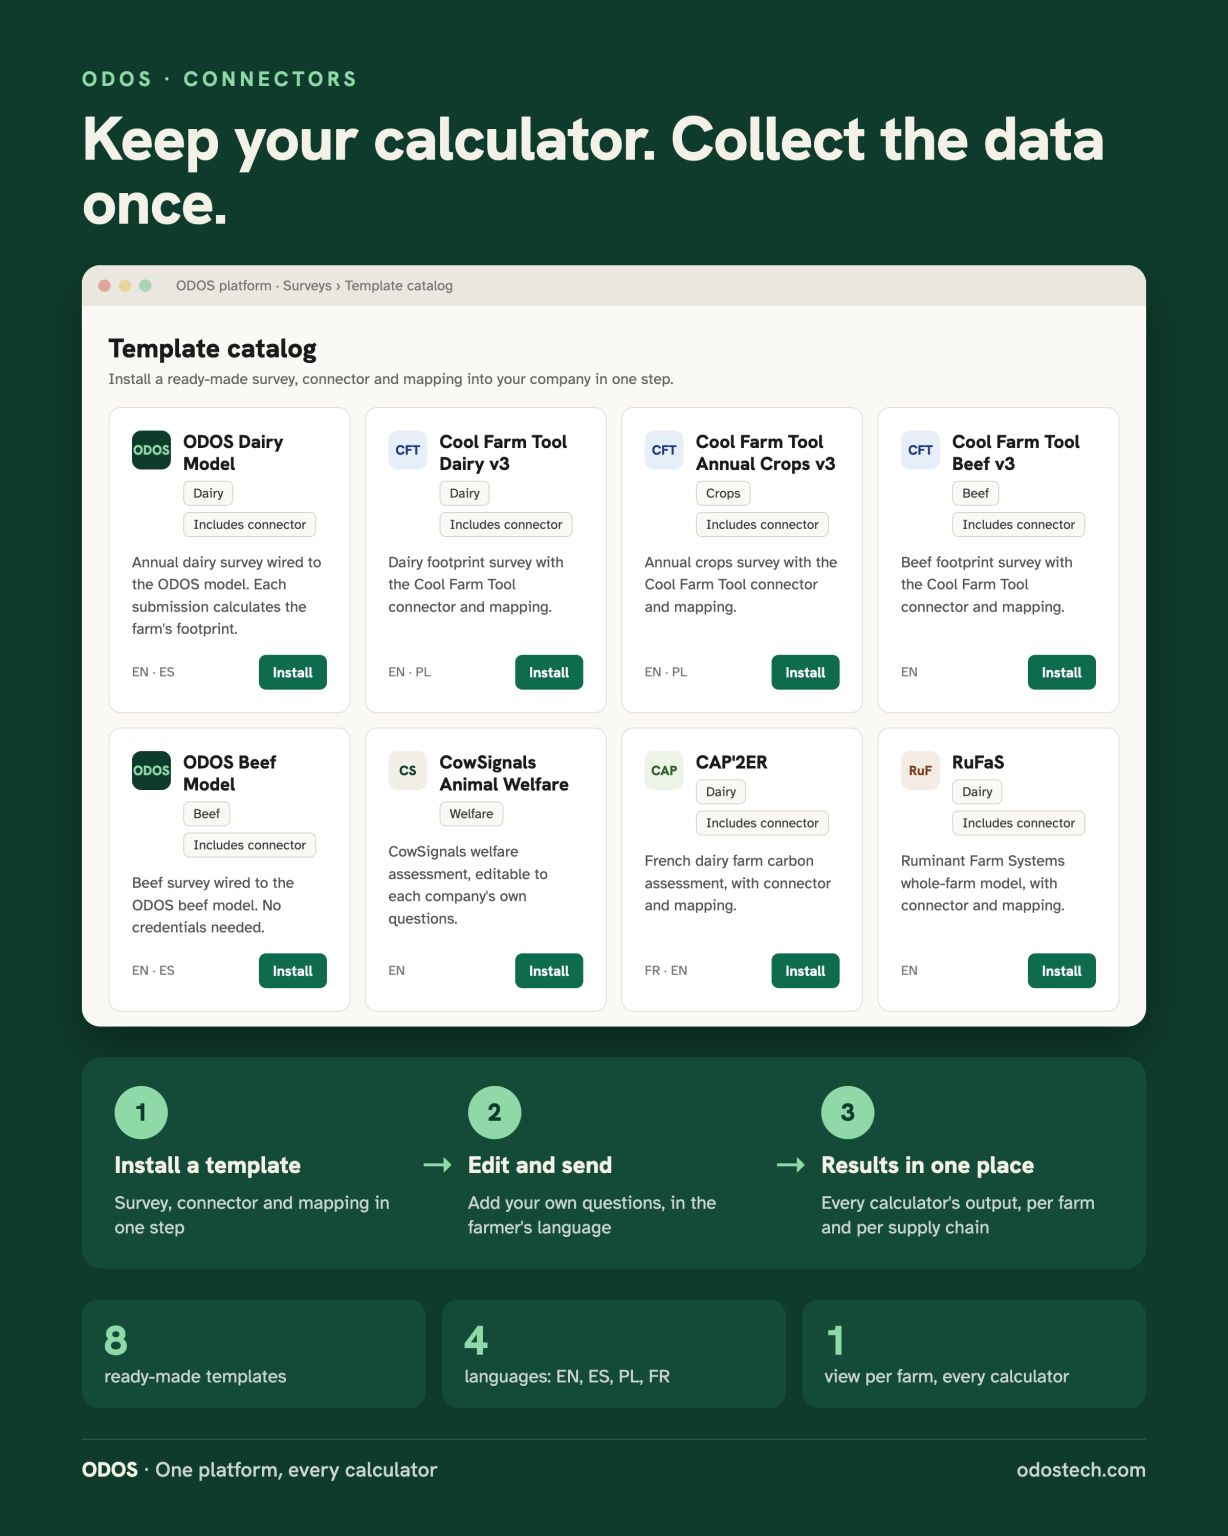
Most of our clients already use a carbon calculator, so we built ODOS to connect to it rather than replace it. The platform’s template catalogue installs a ready-made survey, its connector and the data mapping in one step. We connect to these calculators through their APIs. Every survey stays editable after install: clients add their own questions, their teams fill it in once per farm, and the data flows to every calculator that needs it. Results come back into one view per farm and per supply chain, and ODOS adds the layers a calculator alone doesn’t give you: gap filling where records are missing, mitigation scenarios, farm action plans and land intelligence. One data collection, every calculator, one place to manage progress.
- LINKEDIN · IMAGESince 13 Oct 2026
Interfood Group is working with ODOS Tech to measure the carbon footprint of dairy farms in Poland. Interfood's team, advisors and farmers collect in the ODOS platform farm data in a Polish-language portal, alongside Interfood's own animal welfare questions powered by CowSignals Training Company. Calculations run through our integration with Cool Farm Platform Dairy and Crops, consistent with the method Interfood already uses. On top of the footprint, ODOS adds a layer of climate mitigation strategies. Each farm is modelled against 28 strategies across feed, enteric methane, manure, fertiliser, grassland and herd management, and ranked by reduction potential and cost per tonne of CO2e. The result is a farm action plan: the measures that make sense on that farm, with the expected reduction and the economics of each. Thank you to Klaas Jan van Calker, Anna Strzelbicka-Pietrowicz, DVM, MBA and Julia Jadwiga Fornalik for the work together.
- LINKEDIN · VIDEOSince 9 Sept 2026
One of the quieter parts of the platform is the feed and ration tool - but it's a real time saver. In housed systems, feed is usually one of the largest single contributors to a farm's footprint, sometimes the largest. But it is frustrating for data entry! All those pesky ingredients to enter 🫠 Most teams have no clean way to model a new blend before it's already in use - a nutritionist changes a ration, a supplier swaps an ingredient, and the carbon impact only shows up months later, buried in the next footprint calculation, long after the decision's been made. Marta and Pranav built a tool that closes that gap. You upload an an ingredient list, and it builds the blend from there - matching each ingredient to the right emission factor, calculating the footprint of the full ration, and letting you compare it directly against what's currently on the farm before anyone commits to the change. This allows farms, nutritionists and advisors to model new blend compositions, ensuring the nutritional requirements are met, but make proactive decisions about carbon impact before it's locked in. Next we'll introduce pricing capabilities, so you model cost, nutrition and carbon all within one tool. If this sounds useful, let us know! Read more here: https://lnkd.in/dF-QADSg
- LINKEDIN · IMAGESince 9 Sept 2026
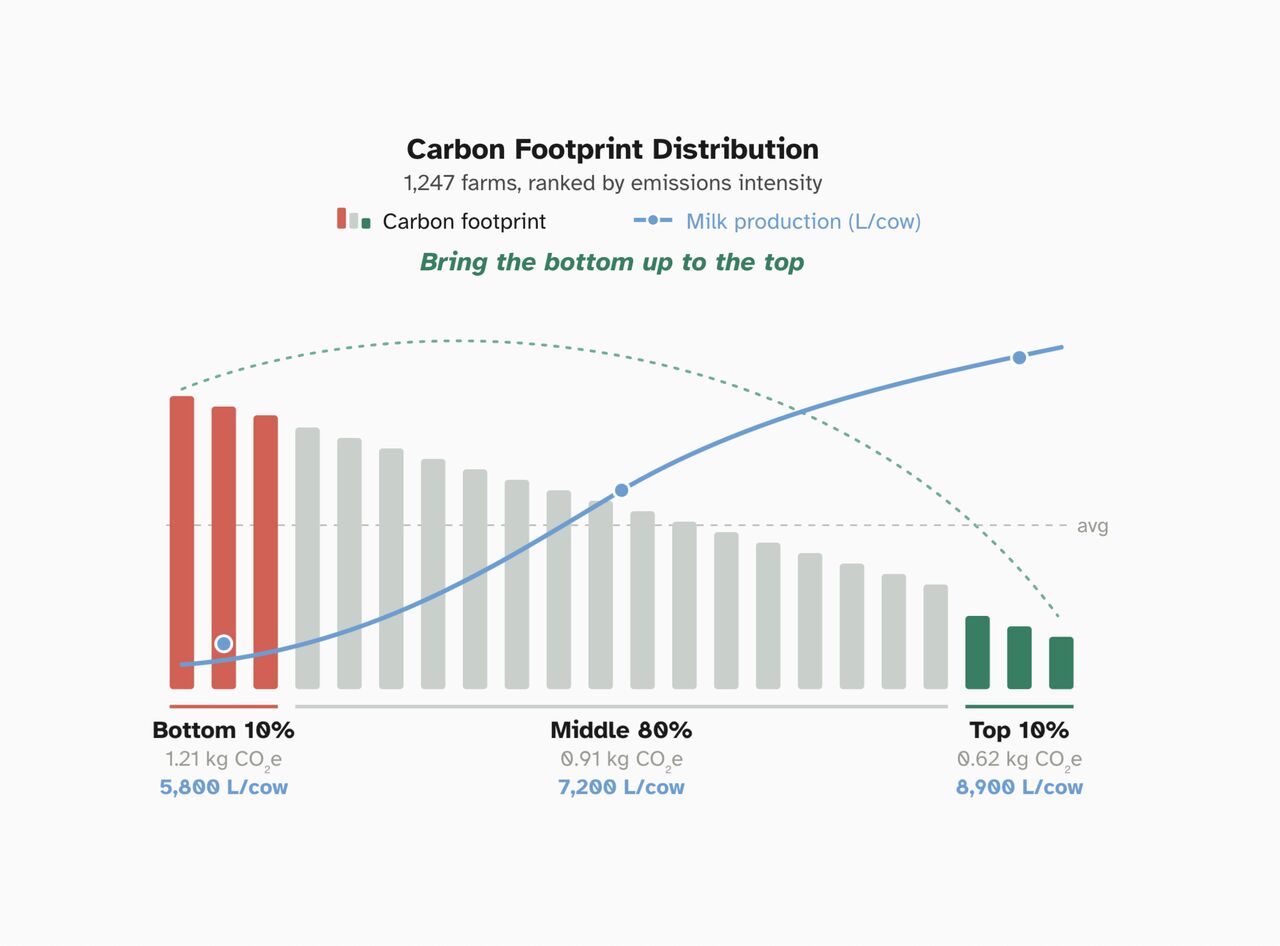
See what your scope 3 data is actually telling you. A footprint number on its own doesn't tell you where to act. You need to see the patterns behind it. That's the idea behind Analyse Your Supply Chain, one of the core pillars of the ODOS Tech platform. We turn your full supply chain into a set of interactive dashboards, so you can spot patterns, compare farms, and identify where action will have the most impact. From there, it's about understanding what's actually driving the numbers: Benchmark performance. Footprint vs. productivity, feed efficiency, nitrogen use efficiency. Spot the highest emitters, the best performers, and the farms with the biggest opportunity to improve both. Surface the drivers. Feed blends and carbon footprint by type. Fertiliser mix and application rates. Slurry storage and spreading methods. Understand what's actually driving emissions, farm by farm. Analyse habitat quantity and quality. See how much of the supply chain is managed as natural or semi-natural land, and how healthy it is, straight from satellite imagery. See how it works: https://lnkd.in/eq_px_97
- LINKEDIN · VIDEOSince 9 Sept 2026
No two dairy farms are the same, so no two farms should get the same emission reduction recommendation. That sounds obvious written down, and it's still the thing most mitigation plans get wrong — one strategy, rolled out supply-chain-wide, regardless of whether it actually fits the farm it lands on. The farm-by-farm action plans are built to fix that. Each farm gets its own auto-recommended actions, based on its own reality — not an average, not a supply-chain-wide default. Once a farmer takes an action, the evidence gets uploaded and tied directly to that intervention, so it's verified, not assumed. And once it's verified, the farmer gets rewarded for it. That last part matters most. A plan that only tells a co-op what to do, without giving farmers a reason to actually do it, doesn't hold up. This is built so the farmer who delivers the reduction is the one who benefits from it. Recommend it. Verify it. Reward it. That's what turns a mitigation strategy into something that actually happens on a farm. See how it works: https://lnkd.in/eCi7w7FM
- LINKEDIN · IMAGESince 3 Sept 2026
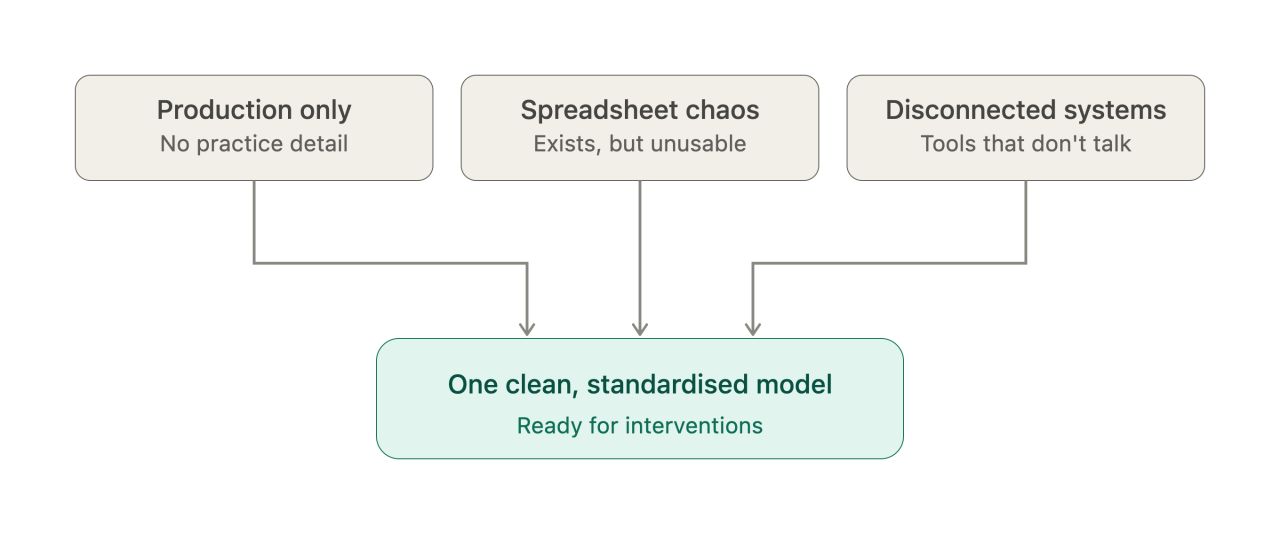
A while back, I would have told you every supply chain we work with starts the same way: messy data - a folder of spreadsheets, pdfs and someone's memory of which farm sent what last year. Turns out that's not quite right. Now, a clearer pattern is showing up: there isn't one starting point, but three. The first is production data only. A processor knows exactly what they pay for - litres, head of cattle, quality - but almost nothing about what actually happened on it. No feed records, no fertiliser rates, no sense of the practices behind the purchase. You can build a footprint off this, but it's blunt, and it can't tell you anything about what to change. The second is data scattered in spreadsheets - the messy data. The data exists, someone somewhere has collected it, but it's sitting in a dozen files, in a dozen formats, on a dozen laptops. It's very valuable for filling in the picture of what's actually happening on the farm, it's just not usable in the state it's in. The third is data spread across systems. This is the one that surprises people the most, because on paper it looks like the mature setup — a Cool Farm Tool account here, an ERP there, a national database somewhere else. But none of those systems talk to each other, so you end up doing the reconciliation work anyway, just across logins instead of spreadsheets. Three very different starting points, and until recently, three different problems to solve before you could even begin analysing anything. When we initially built the platform, we quickly realised the calculations were rarely the hard part. What is tricky is extracting inconsistent, incomplete farm data, making reasonable assumptions about missing values, different units, three names for the same fertiliser. Multiply that by herd, feed, and manure data across a whole supply base, and you understand why most sustainability projects stall here, long before anyone gets to talk about interventions. So that's what we focus on now first: something that meets you wherever you actually are: production-only, spreadsheets, or five disconnected systems - and gets you to the same clean, standardised starting point regardless. No one has to pretend they're further along than they are before we can start. Message me if you would like to see this in action. Here’s how it works: https://lnkd.in/dvABQ-FD
6 of 82 adsSign up to see every ODOS Tech ad, filter by format and date, and get alerts on new ones.
See all 82 adsWatch the companies you care about.
Filter every ad by industry, country, format and network, and get alerts when a company you watch starts running new ads.