On air · 1 of 3 networks
MisfitMarketing.co
- misfitmarketing.co
- 6 employees
MisfitMarketing.co’s ads on LinkedIn, Meta and Google, recorded by adsrunning. Browse the latest here for free. Sign up free to see all 23. Watch MisfitMarketing.co with Starter to get each new one in your feed.
Watchlist with Starter · $49/mo
| Network | Status | Live ads | Nov 2025LinkedIn activity · 52 weeksNov 2026 | Checked | Next step |
|---|---|---|---|---|---|
| Running | 2 | Checked 31 Oct 2026 | See all 23 ads → | ||
| Meta | Not checked | — | |||
| None recorded | 0 | No ads found on the Google Ads Transparency Center | Checked 4 Oct 2026 | Collect them with the API → |
MisfitMarketing.co has 2 live LinkedIn ads. We recorded no Google ads on 4 Oct 2026.
Latest ads
- LINKEDIN · IMAGESince 28 Jan 2026
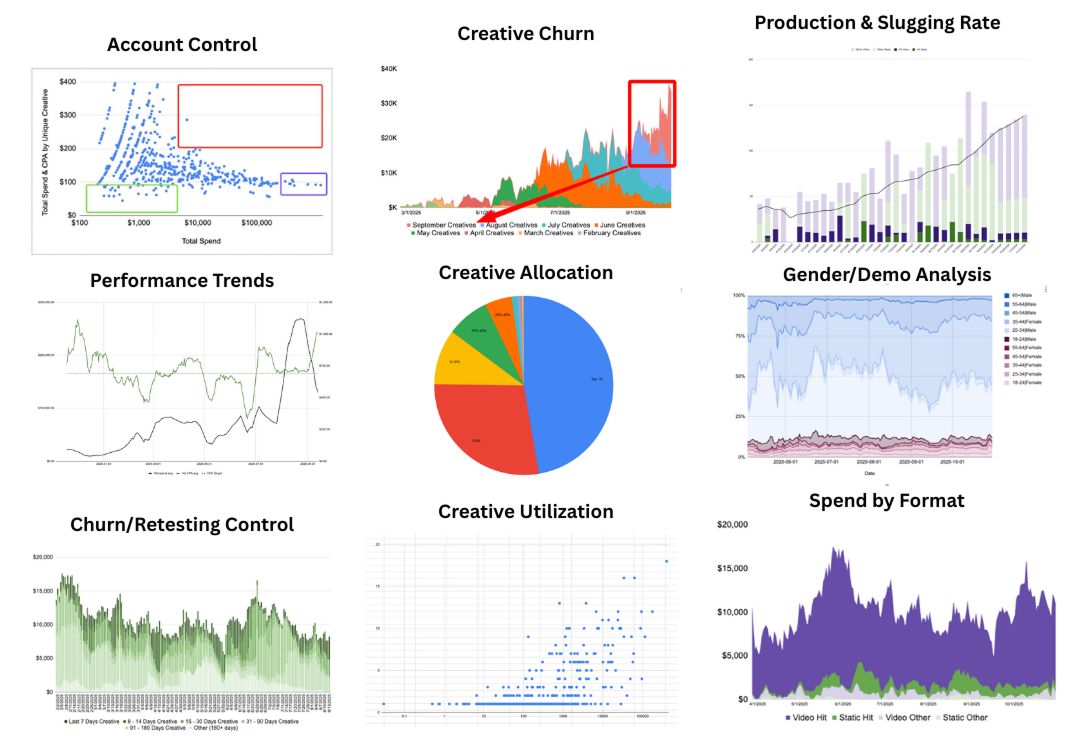
Is media buying or creative your problem? I use 9 charts to find out: Chart 1: Account Control → Maps every ad by CPA vs total spend. → Are you cutting losers before they burn cash? → Is your testing structure leaving winning ads unspent? → Are your top 10% of ads generating 50%+ of revenue? Chart 2: Creative Churn → Tracks how fast your creative inventory turns over relative to performance. → Each color = a different month's creative cohort. → High churn without performance gains = production issue. → Low churn with declining performance = you're riding old winners too long. Chart 3: Production & Slugging Rate → How many ads you're launching vs your targets. → More importantly: What % are "hits" (spending $5k+)? → If only 3/100 ads spend meaningfully, you have a creative quality problem Chart 4: Performance Trends Basic CPA vs spend over time. → Can you scale spend while holding or improving CPA? → If your line trends up and right (more spend, worse CPA), you need better creative or better structure. Chart 5: Creative Allocation → Are you spending the most on your lowest CPA ads? → This should be obvious, but most accounts fail here. → Your top 1% of ads should drive ~50% of total spend. → If your budget is scattered across mediocre performers, your account structure is broken. Chart 6: Gender/Demo Analysis → Shows who's actually buying vs who you think is buying. → Most brands guess at their audience. → This chart tells you where to focus production. Chart 7: Churn/Retesting Control → Darker colors = more new creative testing. → Are you dependent on old ads or consistently launching fresh creative. → If you see long stretches of light green, you're not testing enough. → If it's all dark with declining performance, you're churning too fast without learning. Chart 8: Creative Utilization → Y-axis: How many placements/audiences per ad → X-axis: Total spend per ad → Are you taking your winners and testing them across different audiences, placements & campaign structures → Your best ads should have 5+ variations running. Chart 9: Spend by Format → Are you producing video/static/UGC in proportion to what actually performs? → If 70% of your spend goes to video but you're producing 80% static, you have a production allocation problem. → This chart shows the gap between what you make and what works. The goal is to find data that shows you WHICH problem you actually have: Is it creative production? → Low hit rate → Poor creative allocation → Format mismatch Or is it media buying? → Bad account control → Poor utilization of winners → Scaling issues Creative and media buying both drive CPA/ROAS. Even if they are managed by the same person (they should be) that doesn't give an excuse to blend the metrics. Measure them separately or you'll fix the wrong thing. Would love to hear how you guys look at it.
- LINKEDIN · IMAGESince 28 Jan 2026
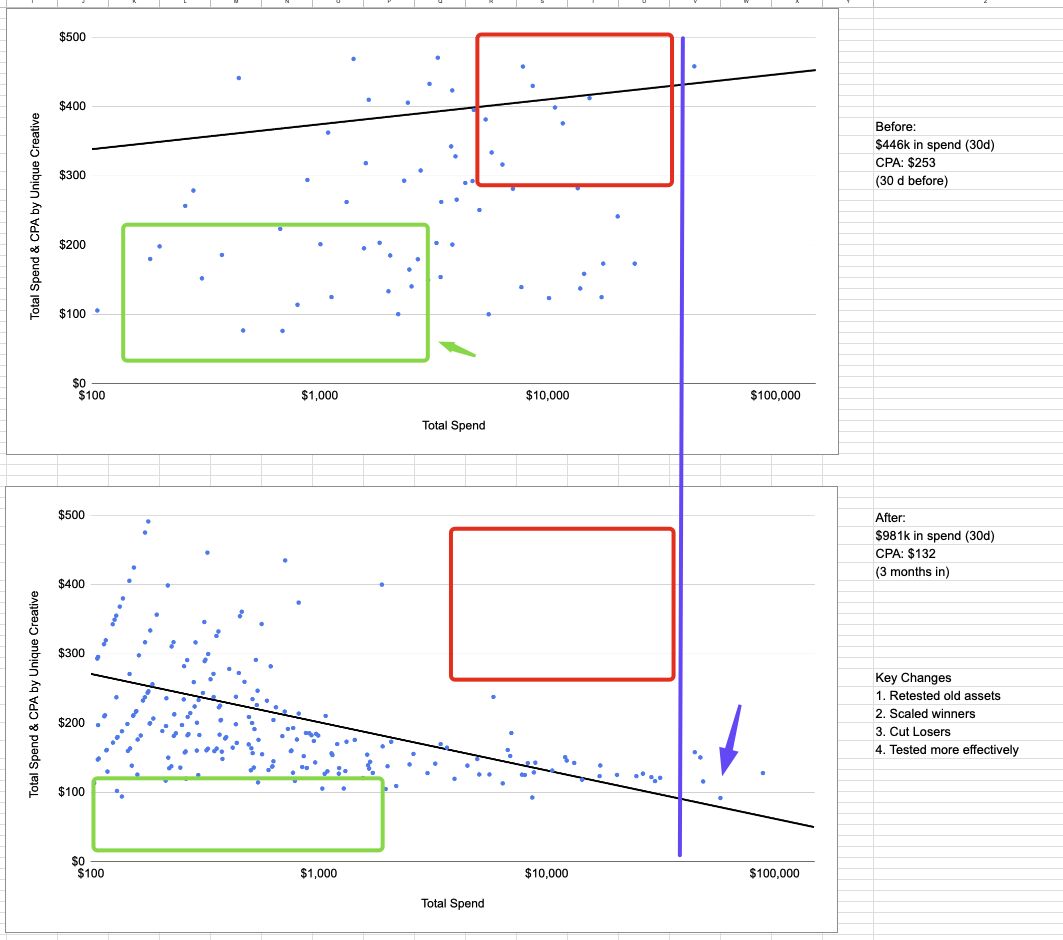
In 90 days we took ad spend from $446K to $981K And cut CPA 48% with no new ads There wasn't a creative problem. It was a media buying problem. Here's the diagnostic chart that revealed it: CPA vs Spend Scatter Plot 1. Plot every ad over 30 days: 2. Y-axis: CPA 3. X-axis: Total spend (LOG SCALE) 4. Each dot = one ad What we found: BEFORE (top image): Scattered mess. General ASC structure dumping everything in. Facebook prioritized ads with high engagement that weren't converting. (Red box in the image highlights this) Average CPA sitting at $253. Couldn't scale. AFTER (bottom image): Tight clustering at low CPA with 10 ads driving half the spend and revenue. The three moves: 1. Ads above target CPA got paused or spend-capped (Red box). The bulk of ads can't spend much but can still perform efficiently at low spend levels. 2. Retest old winners Pulled ads they'd given up on. Retested with new ad copy, headlines, and landing pages. Found winning variations that had been cut for unclear reasons. 3. Scale the top 1-2% This is the hardest part. The top 1-2% of ads should take up ~50% of spend and revenue. On the "before" chart, only 1 dot in the high-spend zone (purple line). On "after," 10 dots. We scaled these without letting CPA shoot up. The key insight: They had incredible ads already (See the green box in the op image). They'd spent heavily on production. They didn't need more creative (yet). They needed better optimization. I'm not saying don't test new ads. Absolutely test. Creative teams are ESSENTIAL to growth. But separate creative testing from media optimization. One can stop the other. If your account looks like that scattered "before" chart, more ads won't fix it. After this: -> We started testing new creatives. But now the structure was dialed in, so the creative team had better data to learn from. Testing became more effective. Win-win. Want to diagnose your account? -> Map this chart: -> Exclude non-prospecting ads -> 30-day window (60 if smaller account) -> Pull from Triple Whale/multi-touch if possible, interface works too -> If you see a scattered mess, media buying is your problem. -> If you see tight clustering with nowhere to scale, creative is your problem. Good signs 1. No ads in red (top right of chart) 2. No ads in green (left side, below average CPA) 3. Consistent 'high spending' ads I've seen many eight-figure+ brands with this issue. Media buying is hard to measure, no shame in that. Hoping this chart helps clarify that a bit. Want to chat about media buying strategy? My calendar is open, just click "Talk with Us" on Misfitmarketing.co Or just DM me. 🤘
- LINKEDIN · IMAGESince 28 Jan 2026
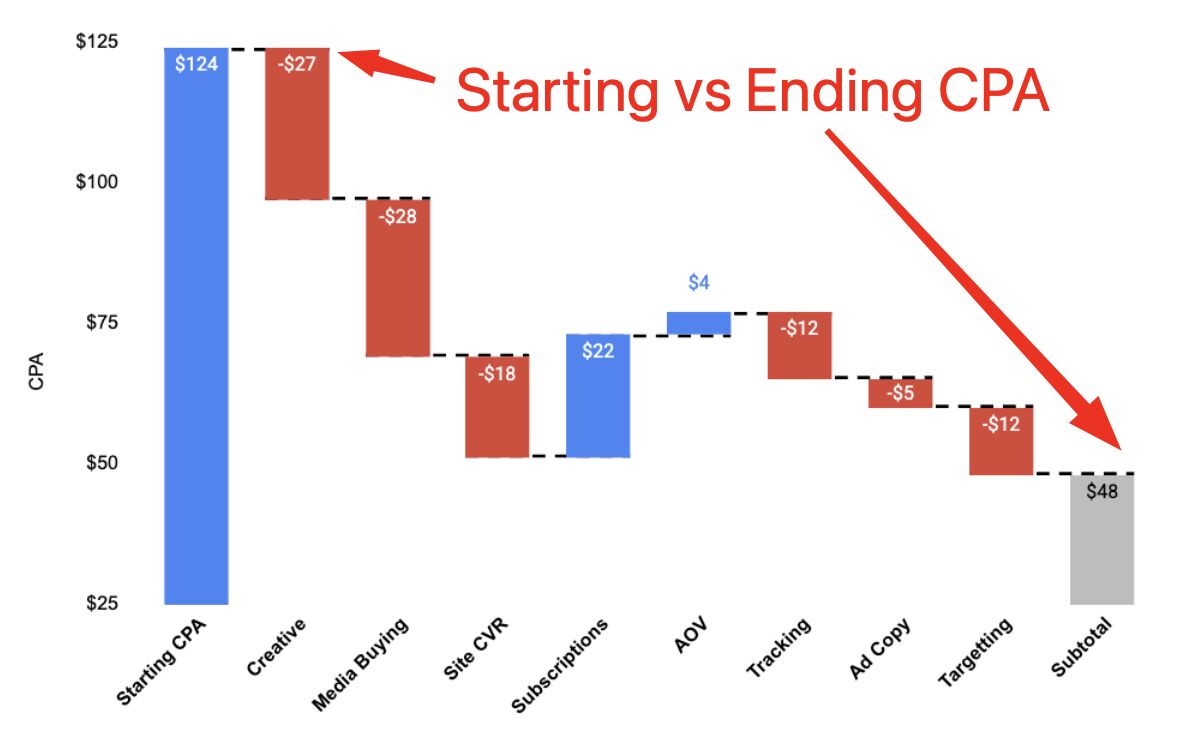
I’ve helped 5 eCom brands exit for ~$500m. The acquirer always wanted lower CPAs: So we pull 8 levers: 1. Creative → Target ~1 new concept per $10k in monthly spend. → At $500k/mo, that's 50 concepts. → 70% video (top of funnel, builds awareness) → 30% static (bottom of funnel, closes sales) That's 35 video concepts, 15 static concepts. Then 2-3 hook variations per video, and 5-8 variations per static. That's roughly 70 videos and 90 statics. Cut 70%+ of creatives before they hit two weeks. Your top 1-2% of ads should drive ~50% of spend. In most accounts, 70-80% of creative continues performing month-over-month. That means: → To maintain: replace 20-30% monthly → To grow 20%: replace churn + add 20% more volume 2. Media buying There are three actions that cut CPA without new ads: → Pause or spend-cap everything above target CPA → Retest old winners with new copy, headlines, landing pages → Scale the top 1-2% to take ~50% of total spend 8-figure brands can cut CPAs by 50% with media buying alone. Keep testing budget under 20% of total ad spend. Limit budget changes to 10-15% max, but make changes twice as often. 3. Website optimization The benchmarks: → CVR: 3%+ (top 10% hit 4.7%+) → Add-to-cart: 7-10% → Checkout completion: 60%+ Sometimes a landing page with 10% higher CPA leads to faster repurchases and higher LTV. 4. Subscription optimization The targets: → Monthly subscription churn: under 7% → 12-month retention: 40%+ → Repeat purchase rate: 30%+ The lever is segmentation: → Subscription vs one-time buyers → 4 week vs 8 week vs 12 week frequencies → Product categories → Acquisition channels The gap between 2x and 4x purchase frequency is a 2x LTV multiplier. 5. CRO Target email opt-in: 2-5%. Run distinct landing pages for each avatar. Example avatars for a supplement brand: → General nutrition → Gut health → Weight loss 6. Tracking optimization Click-based attribution overvalues lower-funnel performance by up to 250%. Top-of-funnel creative can drive 13X more incremental acquisitions than bottom-of-funnel. Click attribution will tell you the opposite. Post-purchase surveys catch what click attribution misses. Track individual nCAC on every ad you run. 7. Ad copy and headlines Ad copy can boost performance by 30%. Give creators selling points, not exact scripts. Target: → 40%+ hook rate → 2%+ CTR → 2-3 hook variations per video concept minimum 8. Data reporting and analysis Know two numbers: Maximum spend (company stays profitable): → Gross margin - OpEx = maximum marketing spend % → Example: 50% margin - 10% OpEx = 40% max Target spend (customer stays profitable): → Project 3-month customer profitability = your target CPA → Example: $55 AOV, $30 first purchase profit, $39 at month 3 = $39 target CPA End of the day, acquirers want: → Profitable customer acquisition → Reliable new customer growth for 3+ years → LTV and margins optimized
- LINKEDIN · IMAGESince 16 Jan 2026
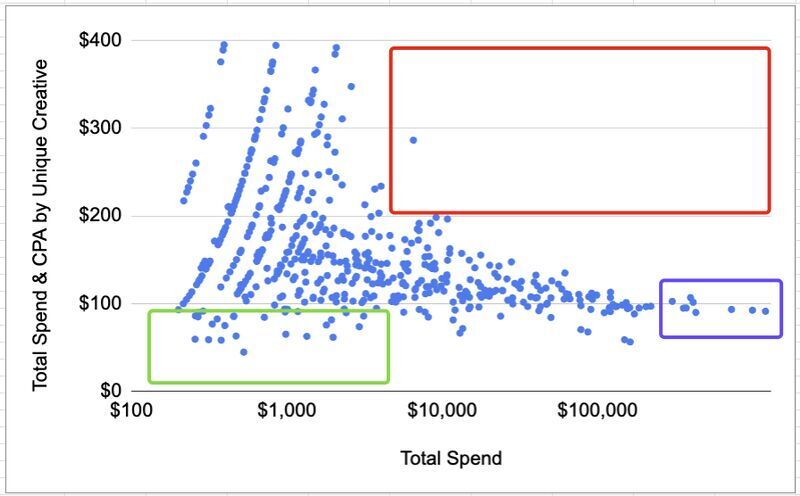
Is creative or media buying your problem? Use this chart to find out: 1. Plot all ads from the last 90 days 2. Put CPA on Y axis, spend on X axis (MUST BE LOG SCALE!!) 3. Combine performance across adsets Filter for just prospecting ads (remove BOFU / Awareness / anything else) A well-optimized account should look like this image attached below. This is what you are looking for: 1. No high-spend/high-CPA ads (top right - Red) 2. Few low-spend/low-CPA ads (bottom left - Green) (Mostly new creatives) 3. Handful of well-scaled winners (far right, good performance - Purple) Those ads in the purple box? 53% of all spend and 55% of all conversions. Why this matters: 1. Shows if they cut losing creatives quickly and consistently to save on test spend, a huge cost when you are producing the right amount of creative. (10-15% of your budget is lost on testing) 2. Reveals if they catch and scale winners or if they leave potential ads underutilized. Having too many creatives in that green box means you aren't testing properly. Worse even than overtesting. 3. Shows that they know how to scale ads effectively, finding winners is one thing, but utilizing them well is a much more difficult skill. Most people stop at the red box and the green box, but properly scaling winning ads without killing performance is the difference between 8 figure brands and 9 figure brands. The key: Most brands hire media buyers and only track average outcomes, not operations. You wouldn't do that with any other employee. Don't manage your ad spend blindly. Want to chat about media buying strategy? My calendar is open, just click "Talk with Us" on Misfitmarketing.co Or just DM me. 🤘
- LINKEDIN · IMAGESince 16 Jan 2026
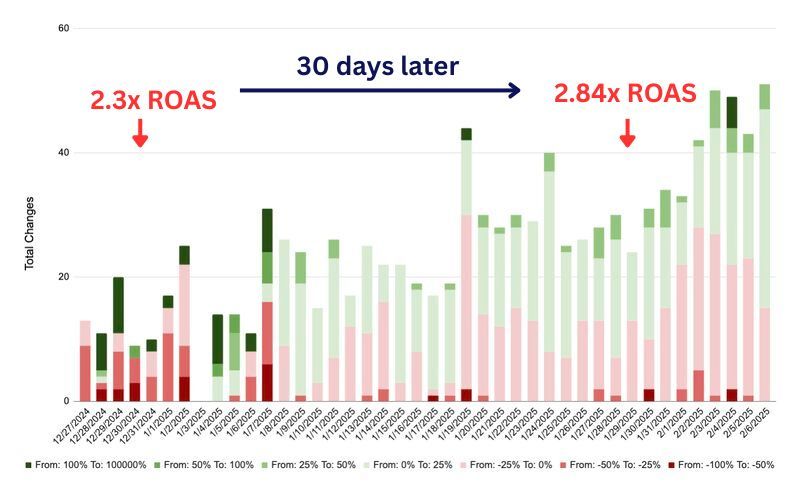
How to increase avg. ROAS With zero new ads. Only with media buying: I see two POVs when it comes to Media Buying: → POV 1 = "Performance is bad lets slash budgets asap" → POV 2 = “The Algo knows best, lets not change anything for a few days" And typically its two groups of people: → POV 1 = bosses/managers who want to default to action → POV 2 = media buyers who want to analyze and make perfect moves. Both have great intentions, but are missing the reality. Large and irregular budget swings (25%+) are typically over-reactions to short term perspectives and noisy data. And if you’re letting the ‘algo do it’s thing’ you’re missing out on mid-day trends and opportunities that exist inside the account. Instead, we opt for the Rice & Beans method when it comes to adjusting Meta ad budgets. 1. Make 2x more optimization decisions 2. Cut the size of each change in half 3. Check performance twice as often 4. Don’t overreact to small fluctuations 5. Focus on consistent, small tweaks The chart shows the total budget changes we made inside an ad account. BEFORE - 2.3x ROAS - Made less changes - Each change was bigger in size (signified by a darker colour) AFTER: - 2.8x ROAS - Made nearly 2x as many budget adjustments - We still made some big 25% / 50% changes, but they were less frequent - Majority of changes smaller in volume. RESULT: - 7 day average ROAS increased from 2.3x to 2.84x ROAS within 30 days And reminder: No new creatives launched at all. Absolutely zero. And if you’re confused why I called it the Rice & Beans method It’s because I think of media buying like sorting rice from beans. It’s not about dramatic changes... More like precise actions that compound over time. If you want to implement this: 1. Limit your budget changes to ±10-15% 2. Double the frequency of your changes 3. Track results for 2 weeks 4. DM me how you go :) Happy to discuss in the comments! Want to chat about media buying strategy? My calendar is open, just click "Talk with Us" on Misfitmarketing.co Or just DM me. 🤘
- LINKEDIN · IMAGESince 28 Oct 2025
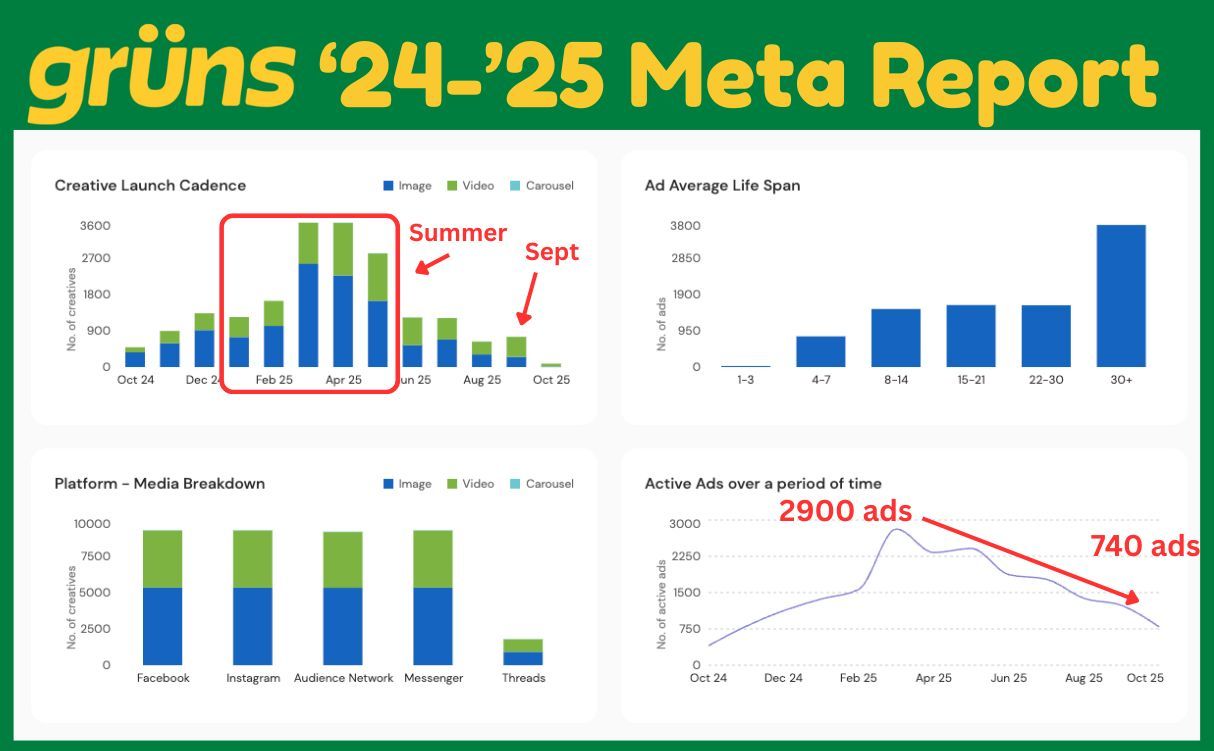
Grüns has pulled way back on ad production, What does Grüns know that we dont this Q4? First, this is Gruns $500m ad production strategy: 1. Precise understanding of marketing goals: Chad Janis, the founder of Grüns, is extremely disciplined about their "CAC ceiling" On the operators podcast, Chad said: "I'm gonna grow as fast as the world lets me at that CAC ceiling... If that means there's 50,000 customers in a month that I can go get at that efficiency, I'm going to go get them. If it happens to be 5,000 this month, no problem." The best companies spend when customers are profitable, not just because your company is profitable. Speaking from $100m in ad experience, you should track your ads like Gruns > Know your customer nCAC ceiling > Tracking individual nCAC on every single ads you run > Track LTV by channel and know exactly how much profit per customer you get 2. They give resources to their creative team: They run 6 distinct customer avatars and have landing pages for each of them. Clear, distinct, and actionable avatars. a. general nutrition b. gut health c. weight loss d. AG1 switchers e. GLP-1 users f. protein users They just completed a clinical study producing USPs to advertise and test. They have clear creative targets around production based on data from testing. They launch a new product every quarter to build excitement and hype. 3. Massive Retail Expansion They've exploded into retail in the past year: Sprouts (Dec 2024) Target (Feb 2025) Walmart (April 2025) Now in 4,000+ doors They are seeing much higher retail LTVs: "You might have a 12 times LTV to CAC in retail" vs. sub-3x on DTC - Chad Janis Its important to understand the halo effect from DTC ads, which drives Amazon and retail sales, Gruns is optimizing total spend across channels to ensure they drive the most profitable spend. Their recent ad library is full of high-quality partnership ads. Those ads drive higher brand awareness and memorability. Immediate DTC purchases may be lower, but the likelihood you will purchase next time you see it on the shelf shoots up. The majority of their pullback on ads has been static ads (blue bar in the top left), which can be great for closing the funnel on aware customers, but are far less likely to cause a retail sale. And its working, whats next for Grüns? 4,000 retail doors, a New Dallas fulfillment facility, Retail net 60-day payment terms, International expansion, and Onboarding 3rd/4th co-manufacturers. Bottom Line > Grüns knows their customer profitability > They know their omnichannel creative lift > They are optimizing creative to maximize overall LTV / Sales > They are focused on building out their operations profitably I expect to see a big Q4 push from them + a heavy new year / new me Q1 campaign. Congrats to the whole Grüns team! If you run an Ecom brand and want to grow paid ads more efficiently, DM or text me at (910) 333-6683 and let's chat (yes, that's real; please don't spam me).
6 of 23 adsSign up to see every MisfitMarketing.co ad, filter by format and date, and get alerts on new ones.
See all 23 adsWatch the companies you care about.
Filter every ad by industry, country, format and network, and get alerts when a company you watch starts running new ads.