On air · 1 of 3 networks
Float.com
- float.com
- Software Development
- 52 employees
Float.com’s ads on LinkedIn, Meta and Google, recorded by adsrunning. Browse the latest here for free. Sign up free to see all 880. Watch Float.com with Starter to get each new one in your feed.
Watchlist with Starter · $49/mo
| Network | Status | Live ads | Nov 2025LinkedIn activity · 52 weeksNov 2026 | Checked | Next step |
|---|---|---|---|---|---|
| None recorded | 0 | Checked 30 Oct 2026 | See all 880 ads → | ||
| Meta | Not checked | — | |||
| Running | 23 | Ads on the Google Ads Transparency Center | Checked 29 Oct 2026 | Collect them with the API → |
Float.com has no live LinkedIn ads. We recorded 23 Google ads on 29 Oct 2026.
Latest ads
- LINKEDIN · IMAGESince 28 Oct 2026
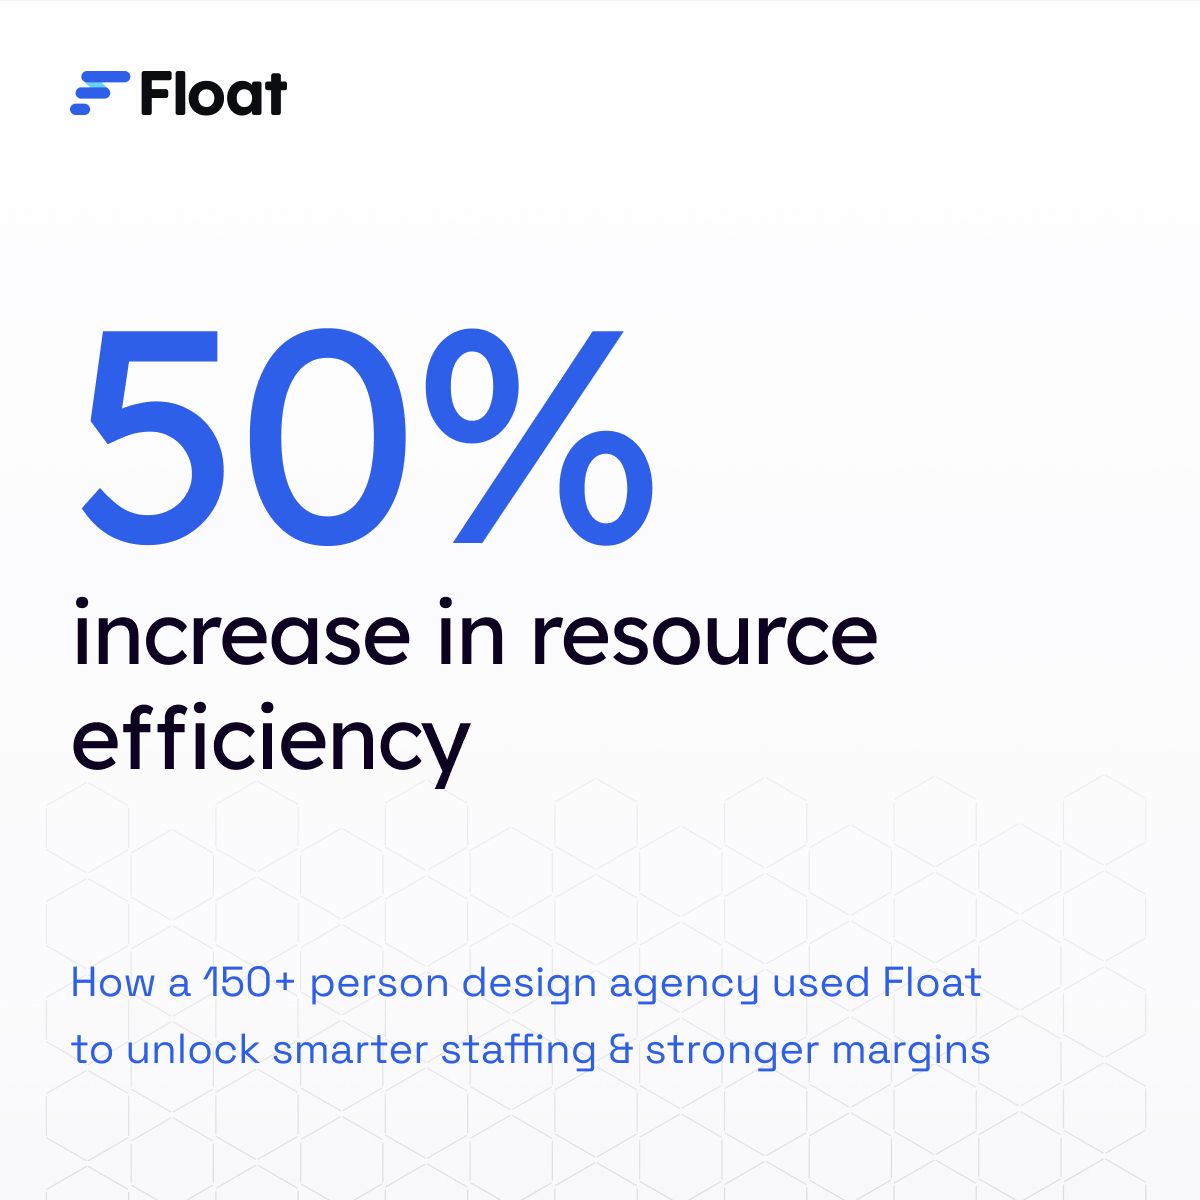
Metalab uses Float to easily plan, track, and adjust projects before issues impact the bottom line. It keeps them in control of the two things that matter most: their people and their profit.
- LINKEDIN · IMAGESince 28 Oct 2026
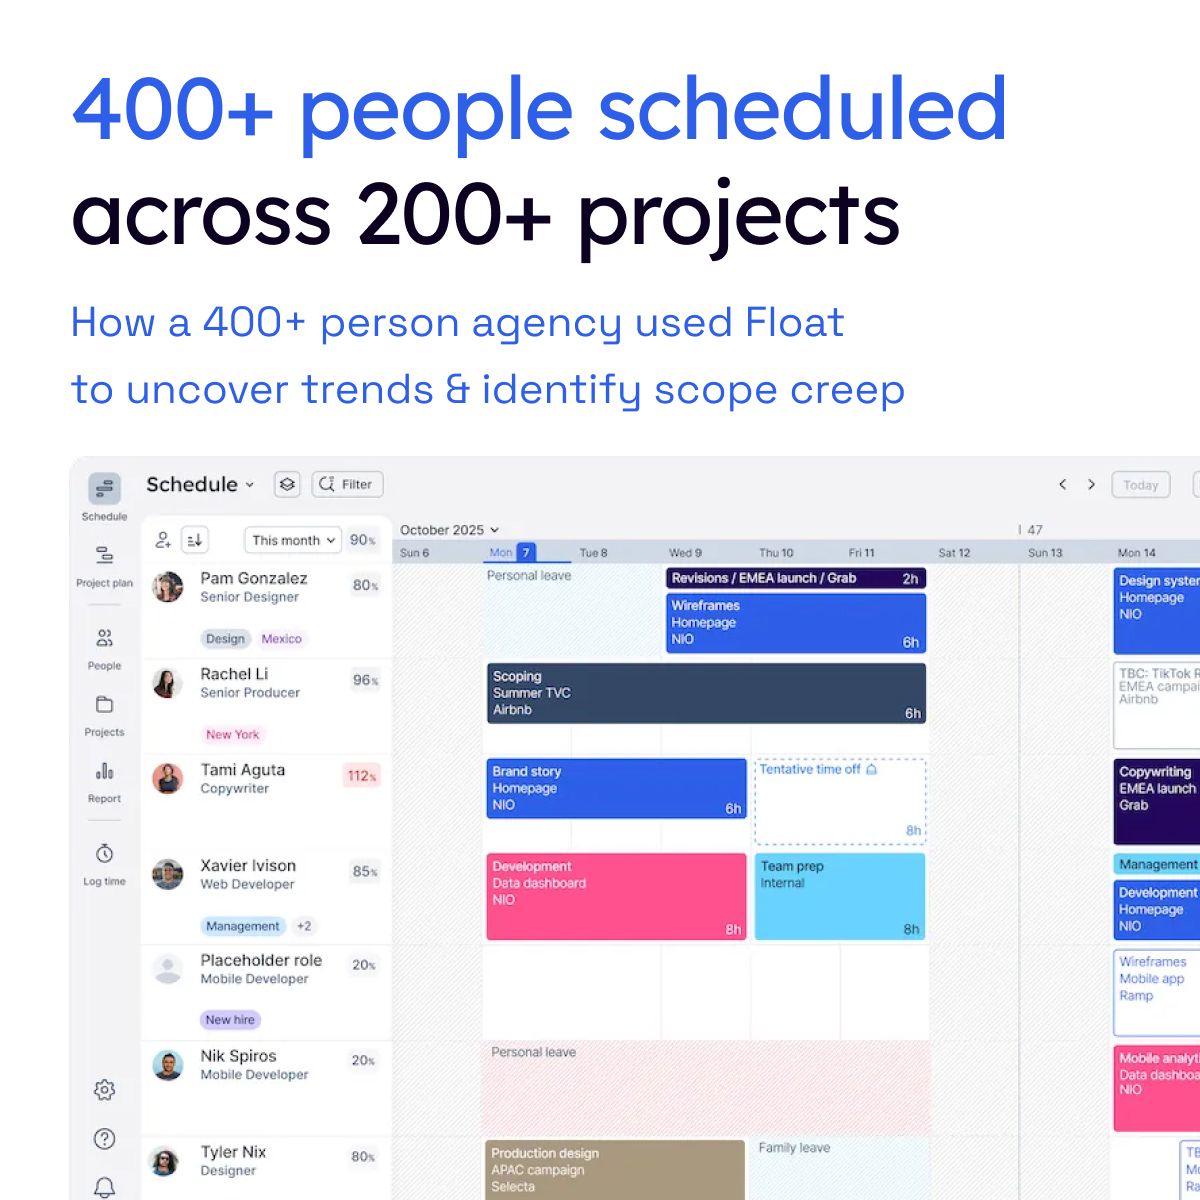
Instrument replaced spreadsheets with Float to manage 400+ people across 200 projects, improving visibility and reducing unnecessary freelance spend.
- LINKEDIN · IMAGESince 28 Oct 2026
SocialChain eliminated double-handling and now ensures the right team members are consistently assigned to the right projects.
- LINKEDIN · IMAGESince 12 Oct 2026
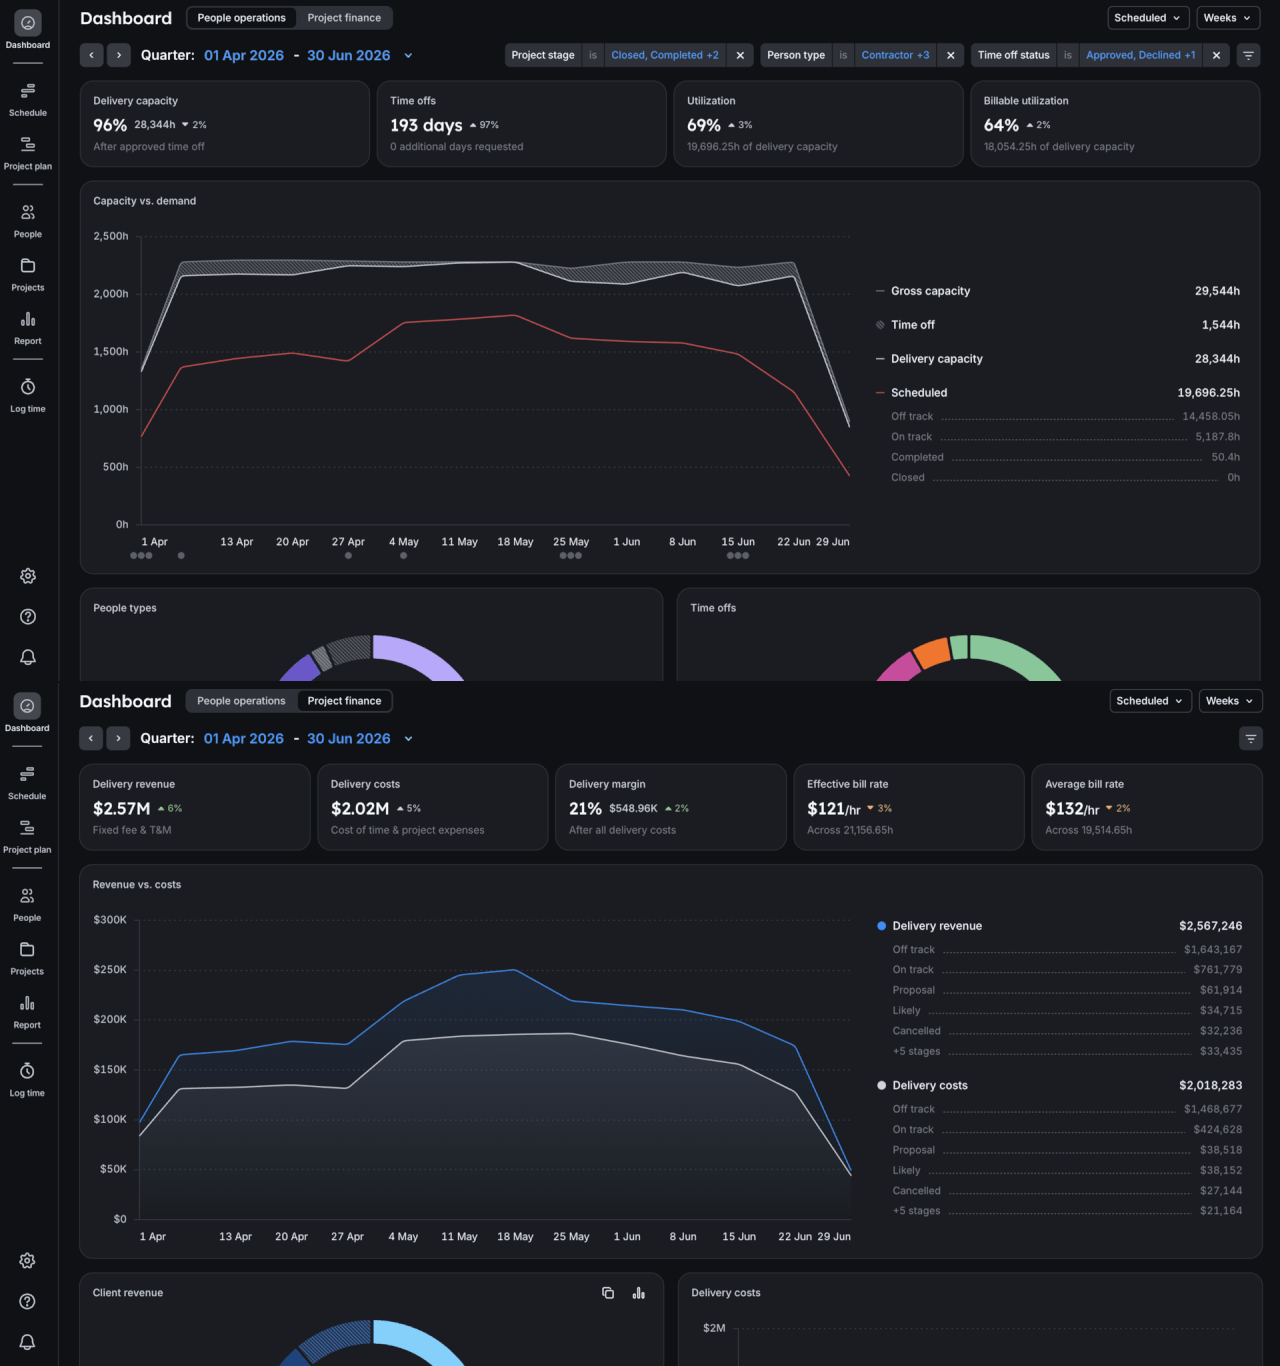
Every day, the delivery folks we talk to spend too much time downloading raw data, reformatting spreadsheets, and tab-switching to manually piece together an operational picture that's crystal clear in their own minds—but isn't tangible to show leadership. They need a reference point. A visual that tells the story when pitching a new hire, bringing in a contractor, or explaining when and why a project went off-budget and margins slipped. These are the signals ops leaders are responsible for every single day. Finally, they have somewhere to go to get them in real time. → Dashboards just landed in Float.com Your team's delivery data now has a pulse check (our heart rate's up about this one too!) ❤️🔥
- LINKEDIN · IMAGESince 12 Oct 2026
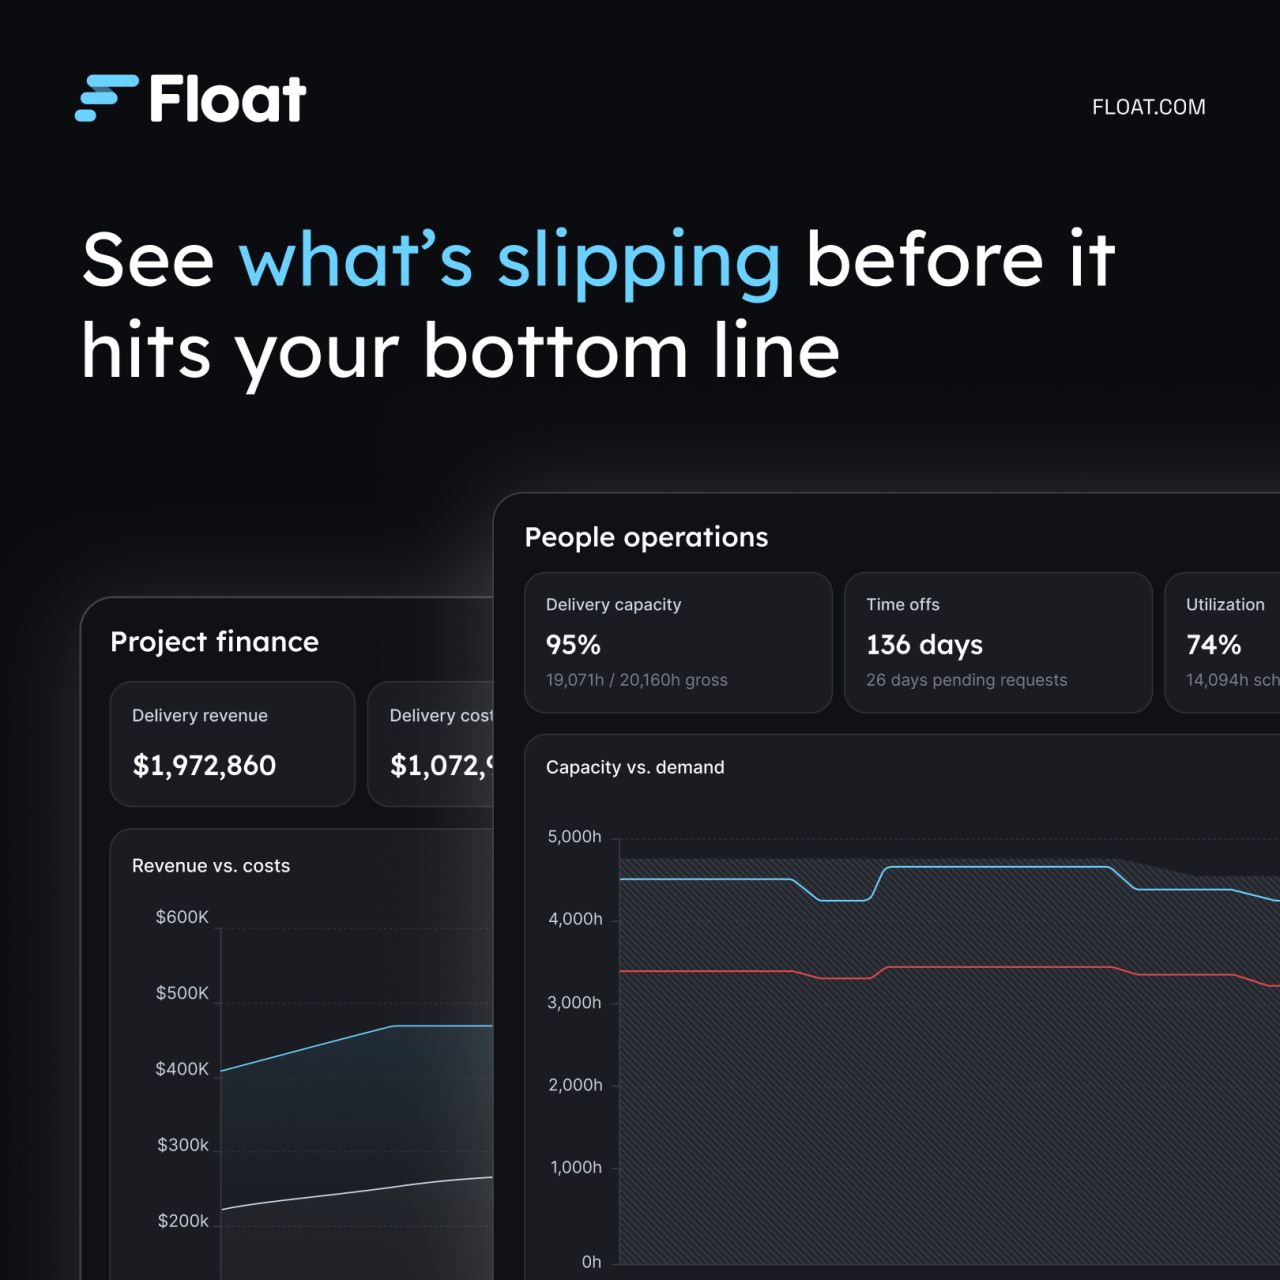
We said yes to an early access trial thinking we’d give feedback… Didn’t expect it to give us feedback back😅 We were invited to test a project finance dashboard. For our setup at HLabs, where we work across multiple contract types and scope in days, not everything was applicable out of the box. But that ended up being beside the point. Going through it sparked a load of conversations we should’ve been having already… 👉 How we track profitability. 👉 What we’re actually measuring. 👉 Where the gaps are. Sometimes a tool isn’t just useful for what it does, it’s useful for the questions it forces you to ask. The premise is simple: you shouldn’t have to wait until the end of the month (or quarter 😆) to know if you’ve made money. It brings revenue, costs, and margin trends together in real time, with capacity sitting alongside it. If you’re running multiple projects at once, that kind of visibility in one place is… pretty hard to ignore. The team at Float.com are building this out fast, properly taking feedback on board, which we love to see. 😍 If your reporting still lives across a million spreadsheets… this one’s worth a look Curious, what’s something your agency does on autopilot that probably deserves a harder look?
- LINKEDIN · IMAGESince 12 Oct 2026
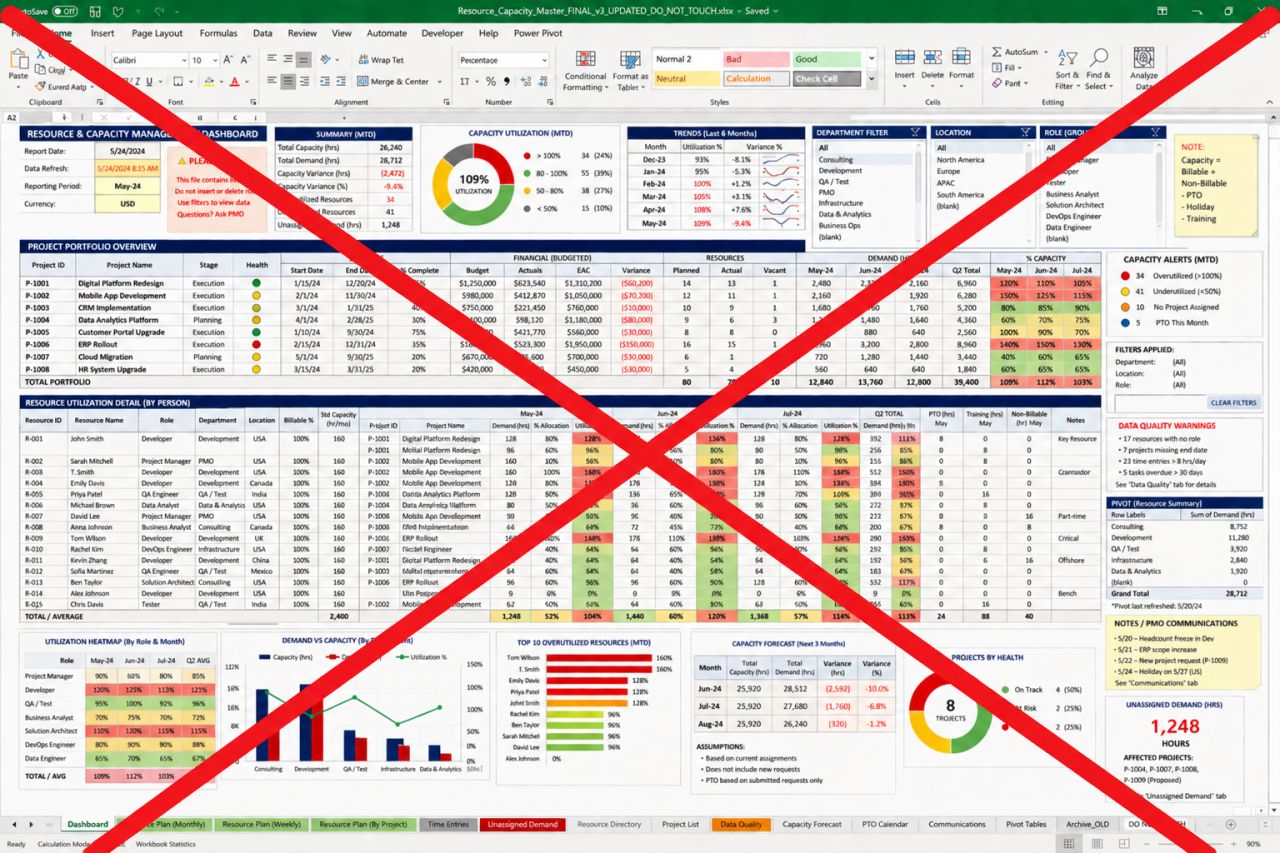
If you've ever done resource planning in Excel, you know this file. It has a name like "Resource_Capacity_Master_FINAL_v3_UPDATED_DO_NOT_TOUCH.xlsx" And there's a tab that says "DO NOT TOUCH" that everyone has touched. It works. Until it doesn't. The teams I speak with every day are brilliant. They've built incredibly sophisticated systems in spreadsheets just to answer questions like: Who's over capacity this month? Are we on track to hit margin? Which clients are driving the most revenue? But the answers are always a few hours of manual work away. And by the time the report is ready, something's already changed. That's exactly the problem Float.com's new Finance and People Operations Dashboards were built to solve. In one view, leadership can now see delivery capacity, utilization, revenue, costs, and margin. Not at the end of the quarter. Not after someone exports and reformats a spreadsheet. Right now, in real time. Your weekly planning meeting just got a whole lot easier 😉

6 of 880 adsSign up to see every Float.com ad, filter by format and date, and get alerts on new ones.
See all 880 adsWatch the companies you care about.
Filter every ad by industry, country, format and network, and get alerts when a company you watch starts running new ads.